
Small Ruminant Budgeting and Marketing
Sheep and goats are small ruminants grown for meat production in the United States. In Mississippi, small ruminant producers are faced with many different management and marketing decisions. Understanding basic economics and markets for small ruminants can help producers improve the profitability of their operations.
This publication discusses enterprise budgeting and marketing for small ruminant production. A sample production budget that can be adapted to an individual operation is included (see Table 1). This budget is designed for both small and commercial producers interested in raising meat-type small ruminants.
A variety of marketing channels are available to small ruminant producers. Sheep and goat marketing outlets include private treaty sale (directly off the farm), auction market sales, and cooperative marketing efforts with other producers. Sheep and goats can be sold as weanlings, stocker, or fed animals. Understanding market conditions is important when making production decisions.
These are some considerations to keep in mind:
- Decide what market channels to target before purchasing any sheep or goats.
- Develop a budget that coincides with your desired production level.
- Compare production costs (see Table 1) with a realistic market to determine profitability.
- Start small and develop a realistic market before establishing a large-scale enterprise.
Budgets
Budgeting is a tool used to determine expenditures and revenues for a certain period of time. It allows producers to plan ahead for expected cash flows. Producers can also use a year-end budget to evaluate how well the operation performed relative to the pre-production budget and adjust future management and marketing practices accordingly. For example, reviewing a year-end budget can reveal that nutrition-related costs made up a larger proportion of expenditures than expected. An enterprise budget is a projection of income and expenses for a certain time period for the entire sheep or goat enterprise. A sample small ruminant enterprise budget appears in Table 1. Instructions for using the Small Ruminant Production Budget developed by the MSU Extension Service are also included.
Table 1. Estimated annual income and expenses, typical small ruminant operation in Mississippi.*
|
Head |
Unit |
Quantity |
Price or Cost per Unit |
Total Value/Cost |
Value/Cost per Head |
Your Farm |
|
|
INCOME |
|||||||
|
Market kids per year |
29 |
pounds |
2,016.0 |
$2.00 |
$4,032.00 |
$161.28 |
|
|
Cull does per year |
3 |
pounds |
300.0 |
$1.00 |
$300.00 |
$12.00 |
|
|
GROSS INCOME |
$4,332.00 |
$173.28 |
|||||
|
DIRECT EXPENSES |
|||||||
|
Pasture Cost |
acres |
5.0 |
$144.83 |
$724.16 |
$28.97 |
||
|
Supplemental Feed (does) |
pounds |
1,250.0 |
$0.30 |
$375.00 |
$15.00 |
||
|
Creep Feed (kids) |
pounds |
864.0 |
$0.30 |
$259.20 |
$10.37 |
||
|
Hay |
round bales |
6.2 |
$50.00 |
$312.50 |
$12.50 |
||
|
Salt and Mineral |
pounds |
50.0 |
$0.56 |
$28.00 |
$1.12 |
||
|
Vet and Medicine |
head |
26.0 |
$6.00 |
$156.00 |
$6.24 |
||
|
Deworming |
|||||||
|
breeding stock |
doses |
52.0 |
$1.00 |
$52.00 |
$2.08 |
||
|
kids |
doses |
114.0 |
$0.25 |
$28.50 |
$1.14 |
||
|
Vaccinations |
|||||||
|
breeding stock |
doses |
52.0 |
$0.55 |
$28.60 |
$1.14 |
||
|
kids |
doses |
76.0 |
$0.60 |
$45.60 |
$1.82 |
|
|
|
Hired Labor |
hours |
12.5 |
$10.00 |
$125.00 |
$5.00 |
||
|
Miscellaneous Supplies |
head |
25.0 |
$1.50 |
$37.50 |
$1.50 |
||
|
Marketing Expenses |
head |
32 |
$4.00 |
$127.20 |
$5.09 |
||
|
Land Rent |
acre |
0 |
$30.00 |
$0.00 |
$0.00 |
||
|
Buck Maintenance Expense |
head |
1.0 |
$42.50 |
$42.50 |
$1.70 |
||
|
Repair and Maintenance (Buildings/Equipment) |
dollars |
$70.11 |
$2.80 |
||||
|
Vehicle Fuel and Oil |
dollars |
$215.71 |
$8.63 |
||||
|
Buck Replacement |
head |
0.3 |
$250.00 |
$83.33 |
$3.33 |
||
|
Doe Replacement |
head |
0.0 |
$125.00 |
$0.00 |
$0.00 |
||
|
Annual Financing Expenses |
percent |
6.0% |
$0.00 |
$0.00 |
$0.00 |
||
|
TOTAL DIRECT EXPENSES |
$2,710.92 |
$108.44 |
|||||
|
RETURN OVER DIRECT EXPENSES |
$1,621.08 |
$64.84 |
|||||
|
FIXED EXPENSES |
|||||||
|
General Overhead |
head |
25 |
$1.25 |
$31.25 |
$1.25 |
||
|
Interest on Breeding Stock |
percent |
6.0% |
$3,375.00 |
$202.50 |
$8.10 |
||
|
Interest on Buildings and Equipment |
percent |
6.0% |
$3,595.00 |
$59.10 |
$2.36 |
||
|
Depreciation |
dollars |
$193.13 |
$7.73 |
||||
|
Taxes and Insurance |
dollars |
$62.91 |
$2.52 |
||||
|
TOTAL FIXED EXPENSES |
$548.88 |
$21.96 |
|||||
|
TOTAL SPECIFIED EXPENSES |
$3,259.80 |
$130.39 |
|||||
|
RETURN OVER TOTAL SPECIFIED EXPENSES |
$1,072.20 |
$42.89 |
|||||
*This budget will work for both goats and sheep. For sheep enterprises, consider Doe=Ewe, Buck=Ram, Kid=Lamb in all values.
Notes: This budget is for planning purposes. Use it only as a guide. Use the Your Farm column to adjust these figures to fit your operation.
Expense items are based on the production parameters specified in the Small Ruminant Production Budget available at http://extension.msstate.edu/content/small-ruminant-budget-excel-file.
Marketing
Commodities that are not able to be stored and have lengthy production cycles often have prices that follow a pattern throughout the year. This is referred to as a seasonal trend. Figure 1 shows the historical price index for 60- to 80-pound No. 1 slaughter meat goat kids in San Angelo, Texas. (No historical prices are currently available for Mississippi, and San Angelo is the closest market with the most complete set of prices.) An index relates prices at a point in time to the annual average price, thus providing a point of reference for prices throughout the year. The first thing to notice from Figure 1 is that prices are higher in the early weeks of the year (weeks 2 through 22, or roughly January through April). Prices then decline during the summer and early fall before increasing again from week 42 through the end of the year (around November and December). Prices are typically 10–15 percent above the annual average price in the spring and are typically 10 percent below the annual average in the summer.
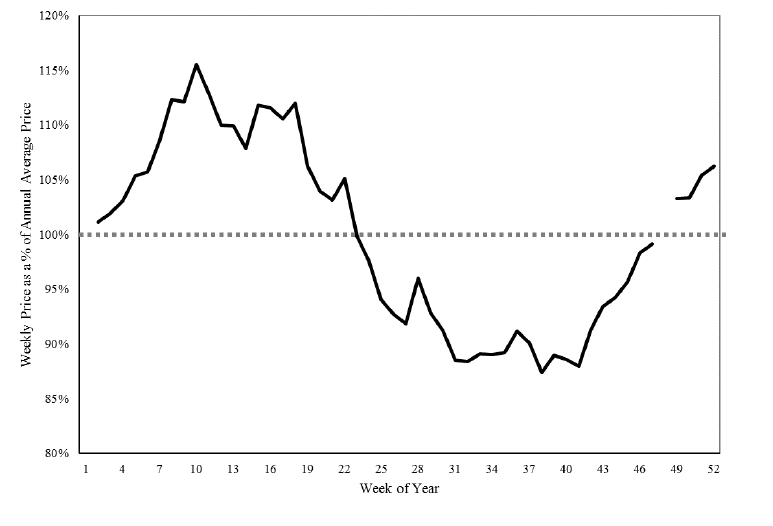
Figure 1. Ten-year average price index of 60- to 80-pound No. 1 slaughter kids in San Angelo, Texas (2008-2017). Note: no observation is given for week 48 because no data was reported during the week of Thanksgiving.
Figure 2 shows the historical price index for 60- to 90-pound slaughter lambs in San Angelo, Texas. The seasonal price behavior for lambs is similar to that of kids shown in Figure 1. Prices are generally higher during the first few months of a year than during the summer months.
Table 2 provides the index values shown in Figures 1 and 2. These are the price index values for 60- to 80-pound meat goat kids and also 60 - to 90-pound lambs. These values are useful when trying to determine prices in the future since prices typically follow a similar pattern each year. If we know what the price is today, we can use the index values to forecast what the price might be in the future if we expect prices will follow the seasonal pattern. To calculate an expected future cash price, use the price and index for the current date and the index for the date to be predicted.
This is the formula:
Predicted price = (Current cash price / Current index value) x Index value for time of prediction
For example, with respect to a meat goat kid between 60 and 80 pounds, assume the current price at week 10 is $1.50 per pound and you want to predict a price for week 25. To do this, use the index for week 10, 115.5 percent, and week 25, 94.0 percent. The predicted price using the formula above would be $1.22 per pound:
($1.50 per pound / 115.5%) x 94.0% = $1.22 per pound
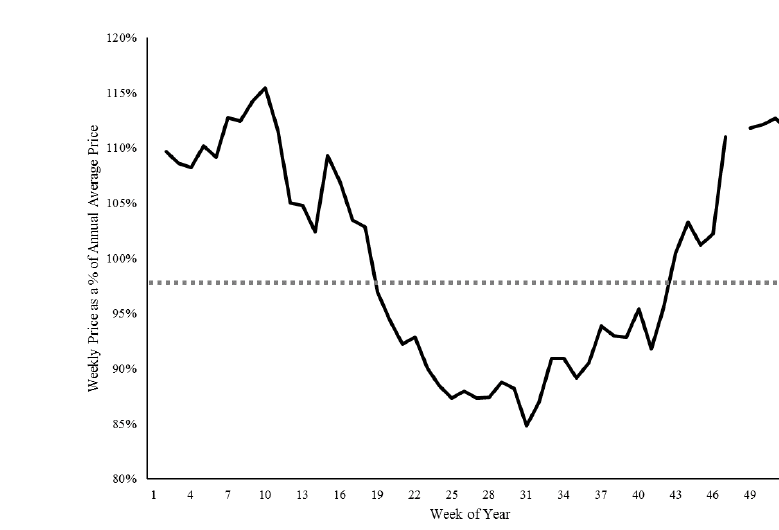
Figure 2. Ten-year average price difference of 60- to 90-pound good and choice No. 1–2 slaughter lambs in San Angelo, Texas (2008–2017). Note: no observation is given for week 48 because no data was reported during the week of Thanksgiving.
Table 2. Weekly kid and lamb price as a percent of annual average price (price index).
|
Week of the Year |
60- to 80-lb Kid Price Index |
60- to 90-lb Lamb Price Index |
Week of the Year |
60- to 80-lb Kid Price Index |
60- to 90-lb Lamb Price Index |
|
2 |
101.2% |
109.7% |
27 |
91.8% |
87.4% |
|
3 |
102.0% |
108.6% |
28 |
96.0% |
87.4% |
|
4 |
103.1% |
108.2% |
29 |
92.8% |
88.8% |
|
5 |
105.4% |
110.2% |
30 |
91.2% |
88.2% |
|
6 |
105.7% |
109.2% |
31 |
88.5% |
84.9% |
|
7 |
108.5% |
112.7% |
32 |
88.4% |
86.9% |
|
8 |
112.3% |
112.4% |
33 |
89.1% |
90.9% |
|
9 |
112.1% |
114.3% |
34 |
89.0% |
90.9% |
|
10 |
115.5% |
115.5% |
35 |
89.2% |
89.1% |
|
11 |
112.9% |
111.6% |
36 |
91.1% |
90.6% |
|
12 |
110.0% |
105.0% |
37 |
90.1% |
93.8% |
|
13 |
109.9% |
104.8% |
38 |
87.4% |
93.0% |
|
14 |
107.8% |
102.4% |
39 |
89.0% |
92.9% |
|
15 |
111.8% |
109.3% |
40 |
88.6% |
95.4% |
|
16 |
111.6% |
106.9% |
41 |
88.0% |
91.8% |
|
17 |
110.6% |
103.5% |
42 |
91.2% |
95.4% |
|
18 |
112.0% |
102.9% |
43 |
93.4% |
100.5% |
|
19 |
106.2% |
96.9% |
44 |
94.3% |
103.3% |
|
20 |
104.0% |
94.4% |
45 |
95.7% |
101.2% |
|
21 |
103.1% |
92.2% |
46 |
98.3% |
102.2% |
|
22 |
105.1% |
92.9% |
47/48 |
99.1% |
111.0% |
|
23 |
99.8% |
90.0% |
49 |
103.3% |
111.8% |
|
24 |
97.6% |
88.5% |
50 |
103.4% |
112.1% |
|
25 |
94.0% |
87.4% |
51 |
105.4% |
112.7% |
|
26 |
92.7% |
88.0% |
52 |
106.2% |
111.6% |
Data Source: Index values are based on historical San Angelo, Texas, cash market prices published by the United States Department of Agriculture, Agricultural Marketing Service.
Using the Mississippi Small Ruminant Production Budget
These instructions are intended to accompany the Excel-based Mississippi Small Ruminant Production Budget file that can be downloaded at http://extension.msstate.edu/content/small-ruminant-budget-excel-file. It provides detailed descriptions and definitions necessary to tailor the budget to an individual operation.
Within this budget, the terminology for goats and sheep is interchangeable. For example, the budget uses “doe” to describe a reproducing female. For sheep operations, the term “doe” is equivalent to the term “ewe.” The same relationship exists for “bucks” and “rams,” as well as for “kids” and “lambs.” The spreadsheet is simple to use. The green cells are where you can enter specific information about your operation and the current market environment. The orange cells are pre-filled using averages, but you can also adjust these. If you make changes in the budget, press enter after each change to ensure the formulas update. The rest of the cells are automatically calculated using the information provided in the green and orange cells. When complete, the budget can provide an estimate of producer costs and returns per animal and give a snapshot of their operation. Note: to use the Print and Reset Values buttons within the Excel document, you will need to enable macros.
Table 3. Mississippi Small Ruminant Budget user-defined budget assumptions.*
|
Assumption Descriptor |
Definition |
|
Number of Does |
Total number of does currently in your operation |
|
Does per Acre |
Carrying capacity of your operation (total number of does divided by total number of pasture acres) |
|
Culling Rate (does) |
Total number of does culled each year as a percent of total number of does (number of does culled each year divided by total number of does in your operation) |
|
Does Kept for Replacement |
Number of does kept from the kid crop for replacement in the operation |
|
Death Loss (does and kids) |
Percentage of does and kids that die from birth through marketing |
|
Kids Weaned/Doe |
Average number of kids weaned per doe each year (total number of kids born divided by the total number of does) |
|
Number of Bucks |
Total number of bucks in the operation (recommended: 1 buck per 25 does) |
|
Years of Buck Use |
Number of years planned to use buck before culling |
|
Buck Value ($/head) |
Average value of each buck in the operation |
|
Doe Value ($/head) |
Average value of each doe in the operation |
|
Labor (hours/doe) |
Number of hours for paid labor per doe owned per year |
|
Amount Financed |
Total amount of money borrowed to fund the operation |
|
Annual Interest Rate |
Annualized interest rate of money borrowed |
|
Avg. Amount of Hay Fed/Head/Day (does) |
The average pounds of feed fed to does per day (breeding and confinement) |
|
Number of Days Hay Is Fed (does) |
The number of days hay is fed to does during the year |
|
Avg. Amount of Feed Fed/Head/Day (does) |
The average pounds of hay fed to does per day (breeding and confinement) |
|
Number of Days Feed is Fed (does) |
Total number of days does are fed feed during the year |
|
Avg. Amount of Hay Fed/Head/Day (bucks) |
The average pounds of hay fed to bucks each day while hay is provided |
|
Avg. Amount of Feed Fed/Head/Day (bucks) |
The average pounds of feed fed to bucks each day while feed is provided |
|
Number of Days Feed and Hay Is Fed (bucks) |
The number of days hay is fed to bucks during the year |
|
Lb Creep Feed Fed/Head/Day (kids) |
Average pounds of feed provided to kids each day by way of creep feeding |
|
Days of Creep Feeding (kids) |
Total number of days kids are provided creep feed during the year |
|
Market Kid Price ($/lb) |
Average price per pound for all market kids sold |
|
Avg. Kid Sale Weight (lb) |
Average weight of kids sold at market |
|
Cull Doe Price ($/lb) |
Average price per pound for all does sold as culls |
|
Average Doe Weight (lb) |
Average body weight of does owned in pounds |
*This budget will work for both goats and sheep. For sheep enterprises, consider Doe=Ewe, Buck=Ram, Kid=Lamb in all values.
Mississippi Small Ruminant Production Budget User Input Instructions
The budget allows you to enter information specific to your operation, thus allowing the budget to more accurately define individual production costs and revenues. Begin by reviewing the information in the green section in the Excel file. See Table 3 for a description of what value to enter in each cell. Insert your own specific values in the dark green cells.
The Mississippi Small Ruminant Production Budget also allows users to provide up-to-date prices as an option. Review the prices in the orange cells in the Direct Expenses section. To change specific prices, enter your own values in these cells. If you make changes in the budget, press enter after each change to ensure the formulas update. Table 4 provides descriptions of each cost.
Printing and Resetting Values
To print the worksheet, click the Print button at the top of the page. The Mississippi Small Ruminant Production Budget can revert back to its original values/prices by clicking Reset Values. You will need to enable macros in Excel to use these features.
Table 4. Mississippi Small Ruminant Production Budget description of costs.*
|
Expense Descriptor |
Definition |
|
Pasture Cost |
Annual cost of pasture maintenance |
|
Supplemental Feed (does) |
Cost per pound for the feed that is provided to does |
|
Creep Feed (kids) |
Cost per pound for the feed provided to kids (as a creep feed) |
|
Hay |
Cost per round bale for hay [Note: If feeding square bales, one round bale equals approximately 17 square bales. To calculate hay cost, multiply individual square bale cost times 17.] |
|
Salt and Mineral |
Cost per pound of salt and/or mineral provided during the year |
|
Vet and Medicine |
Cost per head of all vet and medical supplies provided to does and bucks during the year |
|
Deworming (breeding stock) |
Cost per single dose to deworm breeding stock |
|
Deworming (kids) |
Cost per single dose to deworm kids |
|
Vaccinations (breeding stock) |
Cost per single dose to vaccinate breeding stock |
|
Vaccinations (kids) |
Cost per single dose to vaccinate kids |
|
Hired Labor |
Cost per hour for hired help |
|
Miscellaneous Supplies |
Cost of additional supplies |
|
Land Rent |
Annual cost to rent 1 acre of pastureland |
|
Marketing Expenses |
Cost per head to market all goats sold from the operation each year (include yardage and commission) |
*This budget will work for both goats and sheep. For sheep enterprises, consider Doe=Ewe, Buck=Ram, Kid=Lamb in all values.
Publication 2798 (POD-12-22)
By Josh Maples, PhD, Associate Professor, Agricultural Economics; R. Kipp Brown, former Extension Livestock Coordinator, Animal and Dairy Sciences; and Curt Lacy, PhD, Interim Associate Director of Extension and Regional Extension Coordinator for the Delta Research and Extension Center.

The Mississippi State University Extension Service is working to ensure all web content is accessible to all users. If you need assistance accessing any of our content, please email the webteam or call 662-325-2262.


