Irrometer Watermark Series: Irrigation Triggers
This publication series provides information and recommendations pertaining to the Irrometer Watermark 200SS, a granular matrix sensor commonly used in Mississippi for scheduling irrigation. Future publications will discuss other types of soil moisture sensors. Users should choose tools that best fit their needs.
Introduction
An irrigation trigger is the point at which an irrigation cycle starts. Starting too wet wastes water and energy, while starting too dry reduces yield. In this publication, we give guidance on how to select an appropriate trigger for each irrigation system and how to schedule irrigation using Watermark data.
Interpreting Watermark Data
Watermark data can serve as a gauge for the soil water “fuel tank” of the crop. Figure 1 illustrates how to interpret the weighted average centibars (cb) within the active root zone. Centibars are low when wet and high when dry.

Calculating the Weighted Average
The number of Watermark sensors within the active root zone can depend on crop growth and soil properties. To obtain the weighted average:
- Find the column in Table 1 that corresponds to the number of sensors currently included within the active root zone. Once the centibars from a particular sensor have been increasing progressively for some time, this sensor is included for the rest of the season.
- Perform the multiplication in each cell of that column.
- Add up the result from each cell of that column.
|
Sensor depth |
Two sensors |
Three sensors |
Four sensors |
|---|---|---|---|
|
6” |
0.5 × ____ cb  |
0.25 × ____ cb  |
0.17 × ____ cb  |
|
12” |
0.5 × ____ cb  |
0.25 × ____ cb  |
0.17 × ____ cb  |
|
24” |
n/a |
0.50 × ____ cb  |
0.33 × ____ cb  |
|
36” |
n/a |
n/a |
0.33 × ____ cb  |
These calculations may be automated by the Watermark average calculator or other web tools/services.
Choosing an Irrigation Trigger
Previous research indicates that yield-reducing water stress tends to occur when the weighted average exceeds 100 centibars. The longer the cycle time for an irrigation system, the farther below 100 centibars the weighted average should be when triggering the start of a new irrigation cycle. Table 2 suggests general triggers for irrigation cycles of various durations.
|
Irrigation cycle (days) |
Trigger (cb) |
|---|---|
|
1 |
100 |
|
2 |
92 |
|
3 |
84 |
|
4 |
76 |
|
5 |
68 |
|
6 |
60 |
|
7 |
52 |
|
8 |
44 |
Example
Take as an example an irrigation system with one well supplying water to four fields that are irrigated one after another. The time it takes to irrigate each field is 28, 25, 21, and 19 hours, respectively. Thus, the cycle time is 93 hours or nearly 4 days. According to Table 2, a trigger of 76 centibars may be appropriate.
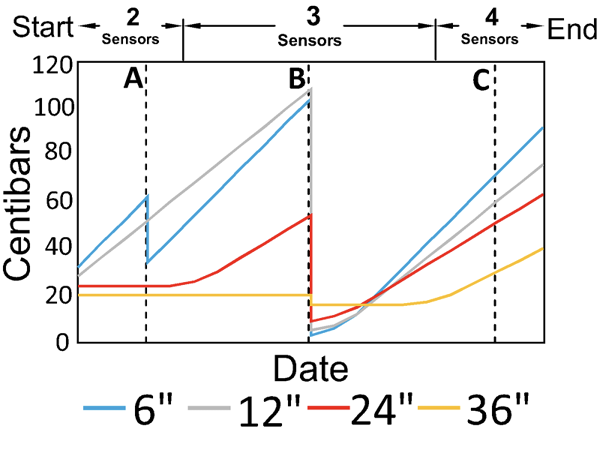
Figure 2 is an example of Watermark data early in the irrigation season. Notice that more sensors are included in the weighted average as the centibars in the deeper sensors begin to increase.

During the first quarter of the graph, only the 6-inch and 12-inch centibars are increasing, so only two sensors are included in the weighted average for example date A. During the middle half, the 24-inch centibars are increasing, so three sensors are included for example date B. During the final quarter of the graph, the 36-inch centibars are increasing, so all four sensors are included for example date C.
Table 3 shows the weighted average calculations on the three example dates. Based on the chosen trigger of 76 centibars, irrigation would be suggested for example date B but not for example dates A and C.
|
Sensor depth |
Date A (two sensors) |
Date B (three sensors) |
Date C (four sensors) |
|---|---|---|---|
|
6” |
0.5 × 62 cb = 31 cb |
0.25 × 10⁴ cb = 26 cb |
0.17 × 72 cb = 12 cb |
|
12” |
0.5 × 52 cb = 26 cb |
0.25 × 10⁸ cb = 27 cb |
0.17 × 60 cb = 10 cb |
|
24” |
n/a |
0.50 × 54 cb = 27 cb |
0.33 × 51 cb = 17 cb |
|
36” |
n/a | n/a |
0.33 × 30 cb = 10 cb |
|
Weighted average |
31 cb + 26 cb = 57 cb |
26 cb + 27 cb + 27 cb = 80 cb |
12 cb + 10 cb + 17 cb + 10 cb = 49 cb |
For more information, please contact Extension Irrigation Specialist Drew Gholson at drew.gholson@msstate.edu or (662) 390-8505.
This publication is a contribution of the National Center for Alluvial Aquifer Research (NCAAR), the Mississippi State University Extension Service, and the Row-Crop Irrigation Science Extension and Research (RISER) initiative. NCAAR is supported by the Agricultural Research Service, United States Department of Agriculture (USDA), under Cooperative Agreement number 58-6001-7-001. RISER is supported jointly by Mississippi Soybean Promotion Board, Mississippi Corn Promotion Board, Mississippi Rice Promotion Board, Cotton Incorporated, Mississippi Peanut Promotion Board, and by the Conservation Innovation Grants program at USDA’s Natural Resources Conservation Service under award number NR203A750008G007.
The information given here is for educational purposes only. References to commercial products, trade names, or suppliers are made with the understanding that no endorsement is implied and that no discrimination against other products or suppliers is intended.
Publication 3541 (POD-01-24)
By Jacob Rix, former Extension/Research Associate; Himmy Lo, PhD, Assistant Extension/Research Professor; Drew Gholson, PhD, Assistant Professor; and Mark Henry, Extension Associate, Delta Research and Extension Center.
The Mississippi State University Extension Service is working to ensure all web content is accessible to all users. If you need assistance accessing any of our content, please email the webteam or call 662-325-2262.


