
The State of Broadband Access in Mississippi
Introduction
The COVID-19 pandemic in the U.S. highlighted the vital need for broadband internet access to complete everyday activities. For example, online learning, telehealth, e-commerce, and remote work require a reliable internet connection. Due to the scope of this issue, it is important to assess where broadband availability is lacking in Mississippi. Broadband access varies across geographic locations, as well as socioeconomic segments of the population. This publication maps and analyzes the availability of broadband internet in the state and assesses how availability changes based on the rurality and economic well-being of the area.
Broadband data comes from the Federal Communications Commission (FCC). The latest FCC data from December 2019 is used for analysis (FCC, 2020). In accordance with the standard broadband definition, broadband internet is an internet connection with at least 25 megabits per second (Mbps) download and 3 Mbps upload speed. As of December 2019, approximately 20 percent of the Mississippi population did not have access to broadband internet. Table 1 displays how the percentage of Mississippi’s population with and without broadband access compares to neighboring states. Compared to other states in the region, Mississippi has the highest percentage of their population with no broadband availability (19.7 percent), followed closely by Arkansas at 19 percent.
Even though the FCC dataset is commonly used in broadband-related analyses, it is not without issues in terms of its reporting. The FCC data can overstate broadband availability due to how the data is collected. The data is gathered at the census block-level, and if one house on the census block has broadband access, then the entire block is considered to have broadband. Additionally, the FCC-provided maximum upload and download speeds for the census blocks are based on advertised speeds, not actual upload and download speeds.
To gain additional information, analysis was also conducted considering the percentage of households with at least one computing device (for example, desktop computers, laptops, smartphones, and tablets), median household income (MHI), and poverty rates. The data for these variables comes from the U.S. Census Bureau’s American Community Survey (ACS) 5-year estimates for 2015 through 2019 (U.S. Census Bureau, 2021).
|
State |
Pct. with broadband |
Pct. without broadband |
|
Mississippi |
80.3 |
19.7 |
|
Alabama |
87.6 |
12.4 |
|
Arkansas |
81.0 |
19.0 |
|
Louisiana |
88.4 |
11.6 |
|
Tennessee |
93.7 |
6.3 |
Mississippi Metropolitan Statistical Areas
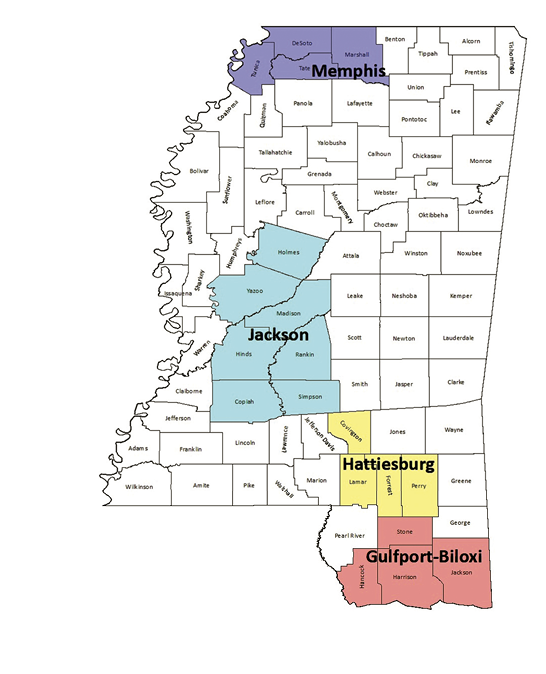
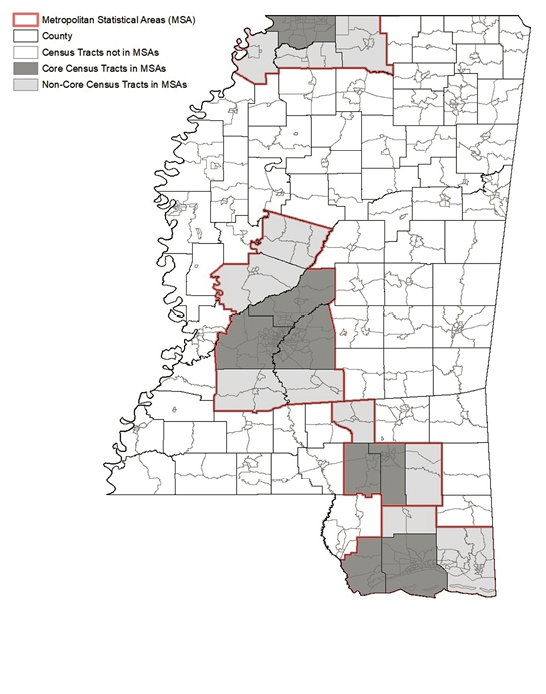
Broadband availability is first assessed at the metropolitan statistical area (MSA) level. MSA delineations for this analysis come from the U.S. Office of Management and Budget (OMB) March 2020 definitions (Office of Management and Budget, 2020a). MSAs typically have larger populations with a centralized urban area and are made up of groups of counties. Specifically, the OMB considers an MSA to be an area with at least one city with a population size of 50,000 or greater (Office of Management and Budget, 2020b). As of March 2020, there are four MSAs in Mississippi: Memphis, Jackson, Hattiesburg, and Gulfport-Biloxi. This analysis also divides the MSAs by “core” and “noncore” counties, following the OMB standards of central and outlying counties (Office and Management and Budget, 2020a). Core counties include the urban centers and have larger populations, whereas the noncore counties have residents who commute into the urban centers for work. Table 2 lists which counties are included in the four MSAs, along with which counties are core and noncore. A map showing the locations of the MSAs in the state is displayed in Figure 1. To examine the variables at a more precise geographic level, census tracts are also evaluated. Counties are broken into census tracts, and if a census tract is in a core county in an MSA according to the OMB definition, it is also considered to be core. Figure 2 shows which census tracts are core and noncore within the MSAs, based off the core and noncore county definitions.
|
MSA |
Area |
Counties |
|
Memphis |
DeSoto, Marshall, Tate, Tunica |
|
|
Core |
DeSoto |
|
|
Noncore |
Marshall, Tate, Tunica |
|
|
Jackson |
Copiah, Hinds, Holmes, Madison, Simpson, Rankin, Yazoo |
|
|
Core |
Hinds, Madison, Rankin |
|
|
Noncore |
Copiah, Holmes, Simpson, Yazoo |
|
|
Hattiesburg |
Covington, Forrest, Lamar, Perry |
|
|
Core |
Forrest, Lamar |
|
|
Noncore |
Covington, Perry |
|
|
Gulfport-Biloxi |
Hancock, Harrison, Jackson, Stone |
|
|
Core |
Hancock, Harrison |
|
|
Noncore |
Jackson, Stone |
Broadband Access by MSA
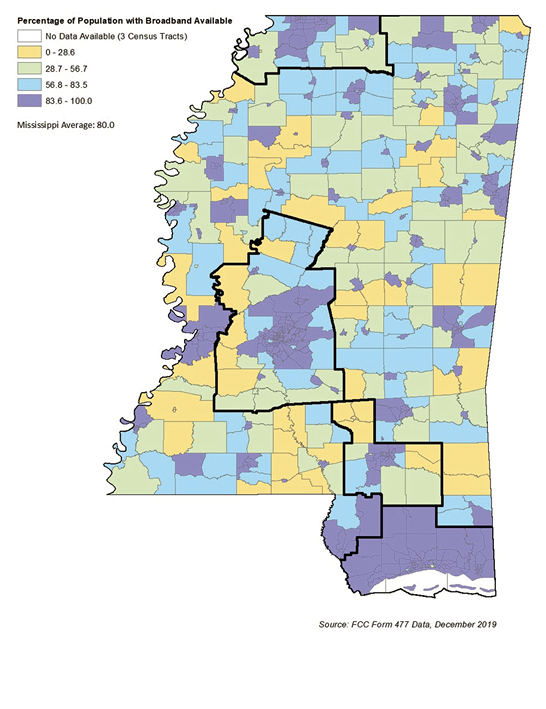
Table 3 shows the percentage of the population in the MSAs with and without broadband access. Additionally, Table 3 displays the percentage of persons in the core and noncore areas within the MSAs with and without available broadband. Looking at the percentages, the Gulfport-Biloxi MSA on the Mississippi coast has the highest percentage of its population with broadband access (97.5 percent). The Hattiesburg MSA has the lowest percentage of its population with available broadband (74 percent). Differences are also observed in terms of broadband access between the core and noncore areas. For all the MSAs, the core areas have higher percentages of their populations with broadband access in comparison to the noncore areas. This difference is particularly notable in the Hattiesburg MSA. In the Hattiesburg MSA, 87.9 percent of the population in the core areas has broadband access, while only 11.6 percent of the population in the noncore areas has access—a difference of 76.3 percent points. Figure 3 shows a map of Mississippi with the percentage of persons with broadband access at the census-tract level, with the MSA borders defined. In general, within the Memphis, Jackson, and Hattiesburg MSAs, the core areas have higher percentages of their census tracts with broadband available. The Gulfport-Biloxi MSA does not indicate that there is a notable difference in broadband availability between core and noncore areas, which is also reflected in Table 3. Even though Table 3 shows that the core areas in the Gulfport-Biloxi MSA have a higher percentage of their population with broadband availability compared to the noncore areas, this difference is only 1.1 percent points (98 percent vs. 96.9 percent).
|
MSA |
Area |
Pct. with broadband |
Pct. without broadband |
|
Memphis |
89.5 |
10.5 |
|
|
Core |
96.6 |
3.4 |
|
|
Noncore |
71.8 |
28.2 |
|
|
Jackson |
87.8 |
12.2 |
|
|
Core |
93.9 |
6.1 |
|
|
Noncore |
57.9 |
42.1 |
|
|
Hattiesburg |
74.0 |
26.0 |
|
|
Core |
87.9 |
12.1 |
|
|
Noncore |
11.6 |
88.4 |
|
|
Gulfport-Biloxi |
97.5 |
2.5 |
|
|
Core |
98.0 |
2.0 |
|
|
Noncore |
96.9 |
3.1 |
Percentage of Households with at Least One Computing Device by MSA
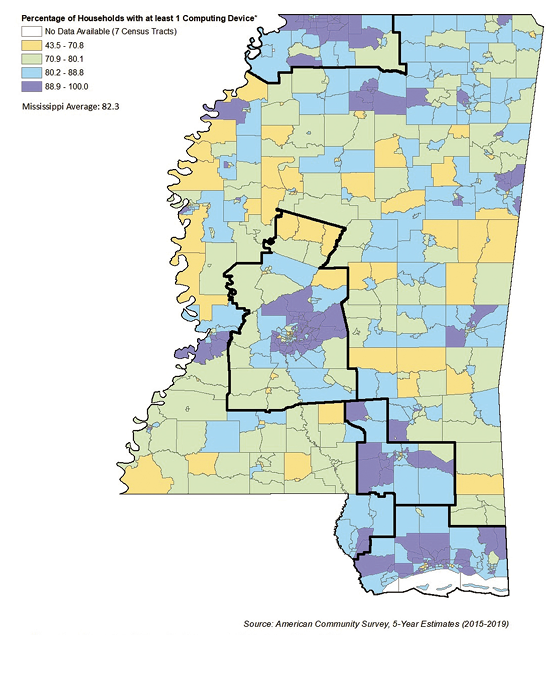
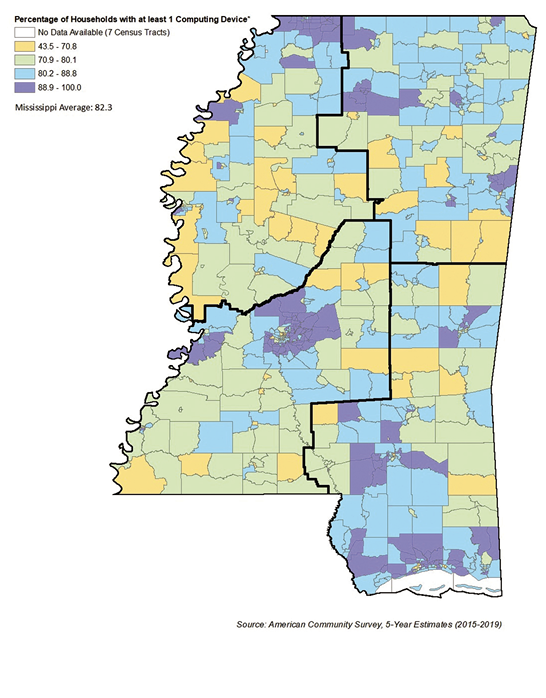
The percentage of households with at least one computing device is an important variable as it provides a measure of access to technology. A map with the MSA borders that shows the percentage of households in a census tract with at least one computing device is displayed in Figure 4. Additionally, column one of Table 4 shows the average percentage of households with at least one computing device across MSAs and core and noncore areas. The difference in the average percentage of households with at least one computing device between core and noncore areas is the largest for the Jackson MSA (87.26 and 73.26 percent, respectively). For the rest of the MSAs, Figure 4 shows that census tracts with high percentages of households with a computing device are dispersed throughout the core and noncore census tracts.
Correlation coefficients are calculated for the broadband and computing device variable across the four MSAs, as well as for the core and noncore counties. Correlation coefficients range from -1 to 1. They measure how strong the relationship is between two variables of interest. If the correlation coefficient if negative, then it implies that as one variable increases, the other variable decreases. Alternatively, a positive correlation coefficient indicates that as one variable increases, the other variable also increases. It is also important to stress that correlation coefficients do not measure the causal relationship between two variables.
The correlations are evaluated at the census tract level. These correlations for the MSAs are found in Table 5. The correlations include both negative and positive values, depending on the area being analyzed. For example, the Memphis MSA has a positive correlation value between the two values, indicating that as broadband access increases in those census tracts, so does the percentage of households with at least one computing device. The only correlations in Table 5 to be statistically significant are the positive correlations for the Memphis MSA, Jackson MSA, and the core census tracts in the Jackson MSA. A statistically significant correlation coefficient indicates that the correlation coefficient is not occurring by chance and that it is a result of an actual relationship between the two variables.
On the other hand, the Gulfport-Biloxi MSA has a negative and non-statistically significant correlation between the two variables, meaning that as broadband increases, the percentage of households with a computing device increases. None of the negative correlations are statistically significant in Table 5. In other words, there is support behind the intuitive finding that census tracts with increased broadband availability also have higher percentages of their households with at least one computing device for certain areas in Mississippi.
|
MSA |
Area |
(1) Pct. of households with at least one computing device |
(2) Median household income (MHI) |
(3) Poverty rate |
|
Memphis |
89.76 |
$59,001.17 |
13.89 |
|
|
Core |
91.96 |
$64,911.24 |
11.08 |
|
|
Noncore |
84.18 |
$43,998.69 |
21.03 |
|
|
Jackson |
84.96 |
$52,094.11 |
20.72 |
|
|
Core |
87.26 |
$55,457.41 |
18.98 |
|
|
Noncore |
73.26 |
$35,124.73 |
29.57 |
|
|
Hattiesburg |
86.85 |
$43,964.94 |
24.62 |
|
|
Core |
87.90 |
$45,563.08 |
25.19 |
|
|
Noncore |
83.07 |
$38,257.29 |
22.59 |
|
|
Gulfport-Biloxi |
86.10 |
$47,755.54 |
20.23 |
|
|
Core |
86.09 |
$47.019.82 |
21.54 |
|
|
Noncore |
86.11 |
$48,965.90 |
18.08 |
|
MSA |
Area |
Correlation |
|
Memphis |
0.35** |
|
|
Core |
-0.05 |
|
|
Noncore |
-0.16 |
|
|
Jackson |
0.38*** |
|
|
Core |
0.21** |
|
|
Noncore |
-0.22 |
|
|
Hattiesburg |
0.22 |
|
|
Core |
-0.05 |
|
|
Noncore |
-0.01 |
|
|
Gulfport-Biloxi |
-0.18 |
|
|
Core |
-0.22 |
|
|
Noncore |
0.05 |
Note: *, **, and *** represent statistical significance at the 10 percent, 5 percent, and 1 percent levels, respectively.
Correlations between Technology and Economic Variables by Metropolitan Statistical Area
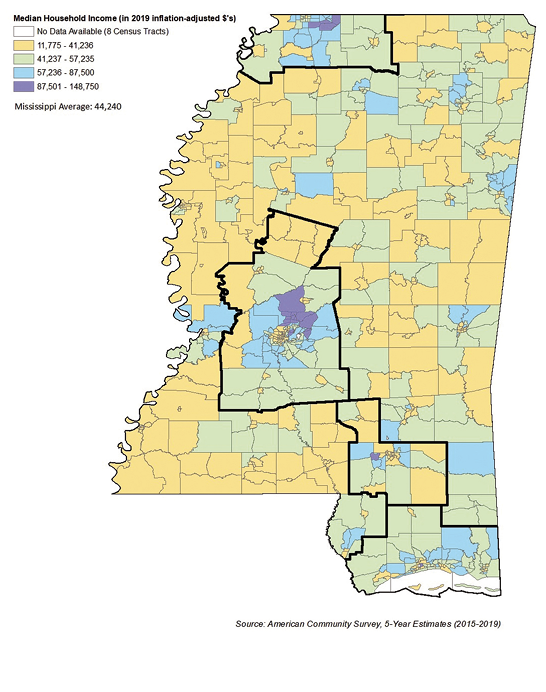
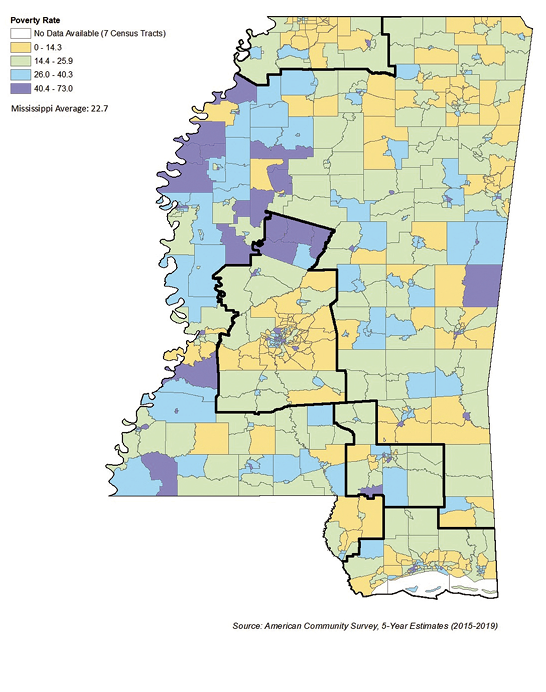
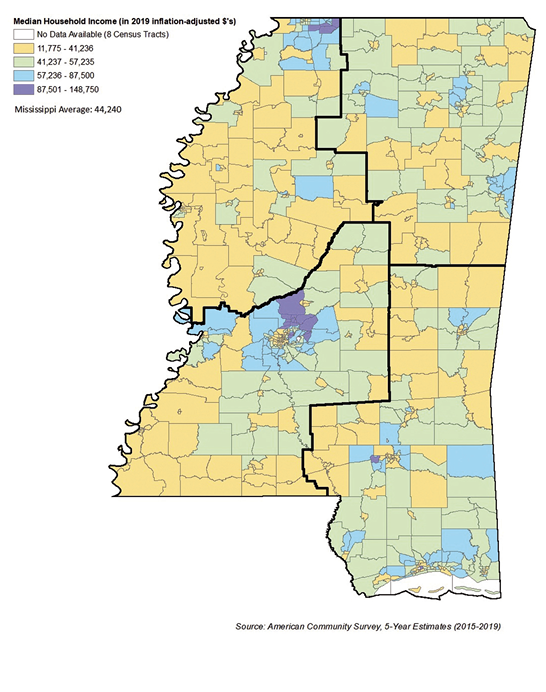
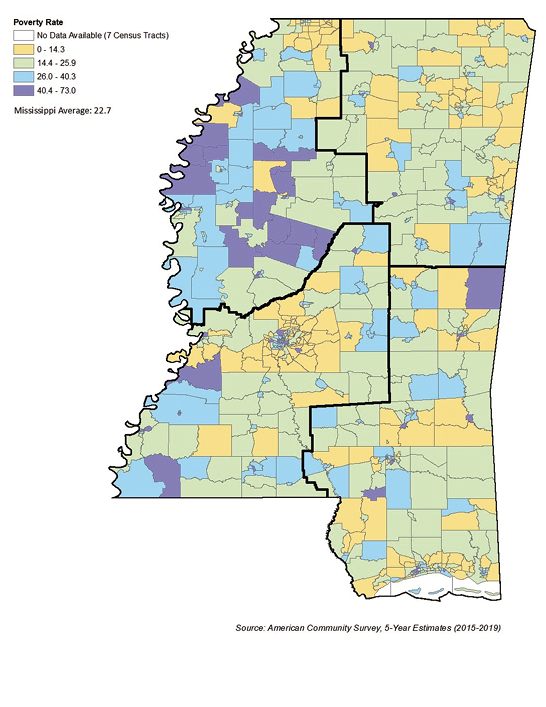
Moving to the economic indicators, Figure 5 is a map of MHI at the census tract level with the MSA borders defined. Column two of Table 4 displays the average MHI values for the MSAs and core and noncore areas. Aside from the Gulfport-Biloxi MSA, higher average MHI values are observed in the core areas of MSAs in comparison to the noncore areas. Figure 6 is a map of the poverty rates at the census tract level with the MSA borders, with column three of Table 4 showing the average poverty rates across MSAs. For the Memphis and Jackson MSAs, the average poverty rate is higher in noncore areas. However, for the Hattiesburg and Gulfport-Biloxi MSAs, the average poverty rate is higher in core areas.
Correlations between the technology-related and economic variables for the MSAs and core and noncore areas are found in Table 6. For column one, which includes the correlations between broadband access and the poverty rate, many of the correlations are positive. The positive correlations imply that when the percentage of the population with broadband increases, the poverty rate also increases. For the noncore areas of the Jackson MSA, the Gulfport-Biloxi MSA, and the core areas of the Gulfport-Biloxi MSA, their positive correlations are statistically significant. None of the negative correlations in column one are statistically significant. Column two in Table 6 also presents mixed results for the correlations between the percentage of the population with broadband available and MHI. The positive correlations indicate that census tracts in those areas will have increased broadband access as MHI increases. A statistically significant positive correlation between MHI and broadband access is observed for the Jackson MSA. The negative correlations signal that census tracts in those areas will have higher percentages of their populations with available broadband as their MHI decreases. The noncore census tracts of the Jackson MSA, the Gulfport-Biloxi MSA, and the core census tracts of the Gulfport-Biloxi MSA are the only areas to have statistically significant negative correlations in column two.
All the correlations in column three in Table 6 are negative, indicating that, as the percentage of households in a census tract with at least one computing device increases, the poverty rate decreases. Apart from the noncore census tracts in the Hattiesburg MSA, all the correlations in column three are statistically significant. Alternatively, all the correlations in column four in Table 6 are positive. This finding can be interpreted as census tracts with a higher percentage of their households with at least one computing device will also be associated with higher MHI. The noncore areas of the Memphis MSA do not have a statistically significant correlation coefficient, whereas the rest of the correlations in column four are significant.
|
MSA |
Area |
(1) Population with broadband and poverty rate |
(2) Population with broadband and MHI |
(3) Households with computing device and poverty rate |
(4) Households with computing device and MHI |
|
Memphis |
-0.15 |
0.24 |
-0.70*** |
0.64*** |
|
|
Core |
0.09 |
0.08 |
-0.60*** |
0.55*** |
|
|
Noncore |
0.41 |
-0.39 |
-0.49* |
0.42 |
|
|
Jackson |
-0.04 |
0.17* |
-0.62*** |
0.68*** |
|
|
Core |
0.03 |
0.08 |
-0.58*** |
0.66*** |
|
|
Noncore |
0.55*** |
-0.52** |
-0.70*** |
0.72*** |
|
|
Hattiesburg |
0.10 |
0.09 |
-0.40** |
0.66*** |
|
|
Core |
0.12 |
-0.16 |
-0.43** |
0.65*** |
|
|
Noncore |
-0.50 |
-0.13 |
-0.67 |
0.78** |
|
|
Gulfport-Biloxi |
0.25** |
-0.23** |
-0.70*** |
0.70*** |
|
|
Core |
0.28** |
-0.28** |
-0.80*** |
0.73*** |
|
|
Noncore |
0.13 |
-0.05 |
-0.29 |
0.65*** |
Note: *, **, and *** represent statistical significance at the 10 percent, 5 percent, and 1 percent levels, respectively.
Mississippi Regions
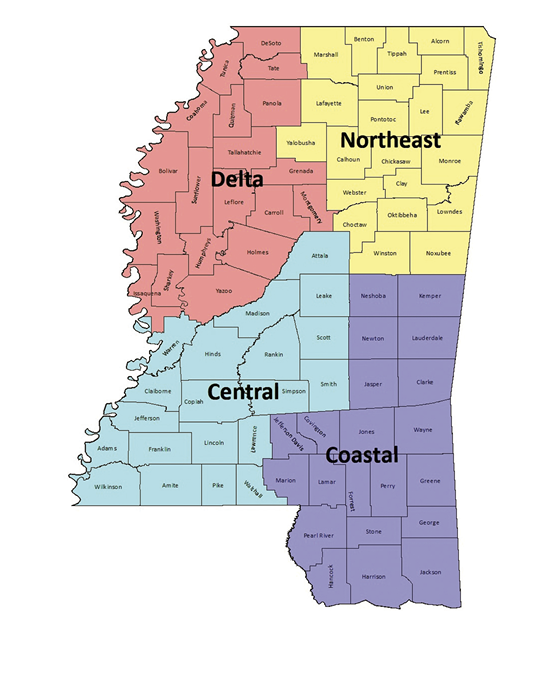
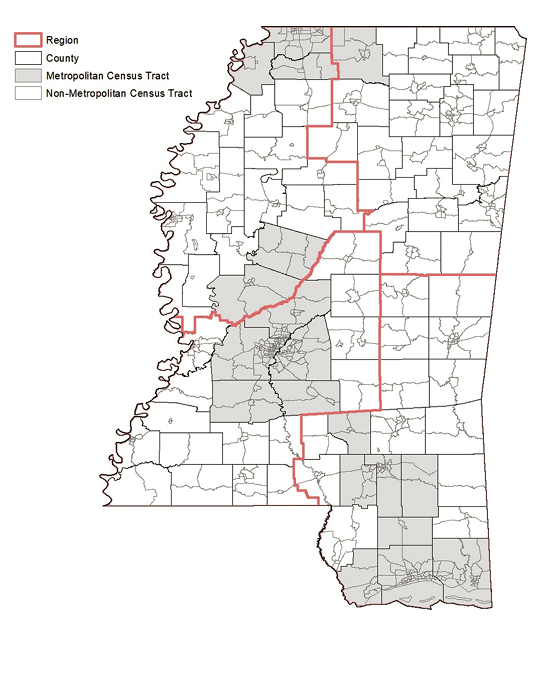
To evaluate how broadband availability varies across Mississippi, we conducted a regional analysis. Four regions across Mississippi are specified: Delta, Northeast, Central, and Coastal regions. Figure 7 displays the zones for these four regions in the state. Because an important aspect for this analysis is to examine how broadband access differs between urban and rural areas, metropolitan and nonmetropolitan counties within these regions are also specified. Table 7 lists which Mississippi counties are included in each region and which counties are considered metropolitan and nonmetropolitan inside the regions. Metropolitan and nonmetropolitan county definitions are based on the 2020 OMB MSA definitions (Office of Management and Budget, 2020a). If a county is in one of the four MSAs in Mississippi, then it is considered metropolitan. If a county falls outside the MSA borders, then it is nonmetropolitan. Figure 8 defines which census tracts are metropolitan and nonmetropolitan, based on the county classifications. Figure 8 also includes the borders for the four regions in Mississippi.
|
Region |
Area |
Counties |
|
Delta |
Bolivar, Carroll, Coahoma, DeSoto, Grenada, Holmes, Humphreys, Issaquena, Leflore, Montgomery, Panola, Quitman, Sharkey, Sunflower, Tallahatchie, Tate, Tunica, Washington, Yazoo |
|
|
Metropolitan |
DeSoto, Holmes, Tate, Tunica, Yazoo |
|
|
Nonmetropolitan |
Bolivar, Carroll, Coahoma, Grenada, Humphreys, Issaquena, Leflore, Montgomery, Panola, Quitman, Sharkey, Sunflower, Tallahatchie, Washington |
|
|
Northeast |
Alcorn, Benton, Calhoun, Chickasaw, Choctaw, Clay, Itawamba, Lafayette, Lee, Lowndes, Marshall, Monroe, Noxubee, Oktibbeha, Pontotoc, Prentiss, Tippah, Tishomingo, Union, Webster, Winston, Yalobusha |
|
|
Metropolitan |
Marshall |
|
|
Nonmetropolitan |
Alcorn, Benton, Calhoun, Chickasaw, Choctaw, Clay, Itawamba, Lafayette, Lee, Lowndes, Monroe, Noxubee, Oktibbeha, Pontotoc, Prentiss, Tippah, Tishomingo, Union, Webster, Winston, Yalobusha |
|
|
Central |
Adams, Amite, Attala, Claiborne, Copiah, Franklin, Hinds, Jefferson, Lawrence, Leake, Lincoln, Madison, Pike, Rankin, Scott, Simpson, Smith, Walthall, Warren, Wilkinson |
|
|
Metropolitan |
Copiah, Hinds, Madison, Rankin, Simpson |
|
|
Nonmetropolitan |
Adams, Amite, Attala, Claiborne, Franklin, Jefferson, Lawrence, Leake, Lincoln, Pike, Scott, Smith, Walthall, Warren, Wilkinson |
|
|
Coastal |
Clarke, Covington, Forrest, George, Greene, Hancock, Harrison, Jackson, Jasper, Jefferson Davis, Jones, Kemper, Lamar, Lauderdale, Marion, Neshoba, Newton, Pearl River, Perry, Stone, Wayne |
|
|
Metropolitan |
Covington, Forrest, Hancock, Harrison, Jackson, Lamar, Perry, Stone |
|
|
Nonmetropolitan |
Clarke, George, Greene, Jasper, Jefferson Davis, Jones, Kemper, Lauderdale, Marion, Neshoba, Newton, Pearl River, Stone, Wayne |
Broadband Access by Region
Table 8 shows the percentage of the population with and without broadband access for the four Mississippi regions, broken into metropolitan and nonmetropolitan areas. The percentage of persons with and without broadband access is also calculated for the entire state, along with all the metropolitan and nonmetropolitan areas together. It is evident that when we look at the entire state, the rural places in Mississippi are lacking in broadband availability in comparison to the urban areas. For Mississippi’s rural areas, 28.2 percent of the population does not have access to broadband, whereas only 10.7 percent of the state’s urban population lacks access.
When examining the four regions, the northeast region has the highest percentage of its total population without broadband available (25.4 percent). On the other hand, the coastal region has the lowest percentage of its total population without broadband access (16.8 percent). If only urban areas within the regions are considered, then the northeast again has the highest percentage of its urban population (36.8 percent) without broadband access. Interestingly, in the northeast region, the percentage of persons without broadband available is higher in the metropolitan areas in relation to the nonmetropolitan areas. This finding is seen only in the northeast. If only rural areas within the regions are examined, then central region has the highest percentage of its rural population (36.8 percent) without broadband availability. Figure 9 maps out the percentage of the population with broadband available, by census tract. Borders for the four Mississippi regions are also defined on Figure 9. All four regions contain census tracts with high and low percentages of their population with broadband available. Specific pockets of census tracts with low percentages of their population with broadband access are seen in the southwest corner of the central region, the central portion of the northeast region, and the southwestern portion of the Delta region. Comparing those areas to the nonmetropolitan and metropolitan delineations in Figure 8, many of those census tracts are rural.

|
Region |
Area |
Pct. with broadband |
Pct. without broadband |
|
Delta |
81.9 |
18.1 |
|
|
Metropolitan |
88.9 |
11.1 |
|
|
Nonmetropolitan |
74.6 |
25.4 |
|
|
Northeast |
74.6 |
25.4 |
|
|
Metropolitan |
67.7 |
32.3 |
|
|
Nonmetropolitan |
75.1 |
24.9 |
|
|
Central |
80.0 |
20.0 |
|
|
Metropolitan |
89.4 |
10.6 |
|
|
Nonmetropolitan |
63.2 |
36.8 |
|
|
Coastal |
83.2 |
16.8 |
|
|
Metropolitan |
90.8 |
9.2 |
|
|
Nonmetropolitan |
71.7 |
28.3 |
|
|
Mississippi |
80.3 |
19.7 |
|
|
Metropolitan |
89.3 |
10.7 |
|
|
Nonmetropolitan |
71.8 |
28.2 |
Percentage of Households with at Least One Computing Device by Region
Figure 10 displays the percentage of households with at least one computing device for census tracts in the state, again with the regional borders defined. Column one of Table 9 shows the average percentage of households with at least one computing device across regions and for metropolitan and nonmetropolitan areas. All the metropolitan areas in the four regions have higher average percentages of their households owning at least one computing device in comparison to nonmetropolitan areas.
As was done with the MSA-level analysis, correlation coefficients are calculated between the broadband and computing device variables. These correlations for the four regions, the entire state, and the metropolitan and nonmetropolitan areas are found in Table 10 and are again done at the census tract level. All these correlations are positive, meaning that census tracts with higher percentages of their households with broadband access are associated with higher percentages of their population with least one computing device. These positive correlations make intuitive sense; if one has a strong internet connection at home, then the likelihood of their owning a computing device increases. Additionally, except for the nonmetropolitan census tracts in the Delta, the metropolitan tracts in the northeast region, and the metropolitan census tracts in the coastal region, the correlations in Table 10 are statistically significant.
|
Region |
Area |
(1) Pct. of households with at least one computing device |
(2) Median household income (MHI) |
(3) Poverty Rate |
|
Delta |
79.20 |
$41,178.50 |
26.57 |
|
|
Metropolitan |
86.39 |
$54,612.96 |
17.95 |
|
|
Nonmetropolitan |
74.50 |
$32,394.42 |
32.21 |
|
|
Northeast |
81.96 |
$42,644.52 |
20.75 |
|
|
Metropolitan |
84.80 |
$40,752.83 |
21.47 |
|
|
Nonmetropolitan |
81.82 |
$42,732.50 |
20.71 |
|
|
Central |
82.98 |
$47,441.29 |
22.27 |
|
|
Metropolitan |
86.18 |
$54,203.22 |
19.28 |
|
|
Nonmetropolitan |
77.59 |
$36,140.53 |
27.29 |
|
|
Coastal |
83.99 |
$44,170.03 |
21.97 |
|
|
Metropolitan |
86.31 |
$46,691.51 |
21.46 |
|
|
Nonmetropolitan |
80.80 |
$40,706.78 |
22.67 |
|
|
Mississippi |
82.33 |
$44,240.22 |
22.71 |
|
|
Metropolitan |
86.24 |
$51,076.46 |
19.94 |
|
|
Nonmetropolitan |
79.16 |
$38,722.26 |
24.95 |
|
Region |
Area |
Correlation |
|
Delta |
0.31*** |
|
|
Metropolitan |
0.49*** |
|
|
Nonmetropolitan |
0.10 |
|
|
Northeast |
0.27*** |
|
|
Metropolitan |
0.04 |
|
|
Nonmetropolitan |
0.28*** |
|
|
Central |
0.39*** |
|
|
Metropolitan |
0.34*** |
|
|
Nonmetropolitan |
0.22* |
|
|
Coastal |
0.27*** |
|
|
Metropolitan |
0.03 |
|
|
Nonmetropolitan |
0.40*** |
|
|
Mississippi |
0.32*** |
|
|
Metropolitan |
0.24*** |
|
|
Nonmetropolitan |
0.23*** |
Note: *, **, and *** represent statistical significance at the 10 percent, 5 percent, and 1 percent levels, respectively.
Correlations between Technology and Economic Variables by Region
Maps showing the MHI and poverty rates across the census tracts in Mississippi are found in Figures 11 and 12, respectively. These maps also include the regional borders. Column two of Table 9 shows average MHI values at the regional level, with column three showing average poverty rates. The Delta region has the lowest average MHI and highest average poverty rates for their census tracts. Also, aside from the northeast region, metropolitan areas in the regions have higher average MHI and lower average poverty rates in comparison to nonmetropolitan areas.
Correlations are also calculated between the broadband and computing variables, and the two economic indicators (MHI and poverty rates). These correlations are displayed in Table 11. Columns one and two show the correlations between the percentage of the population with broadband access and the poverty rate and MHI, respectively. Many of the correlations in column one are positive. Statistically significant positive correlations are observed for the northeast region, as well as the nonmetropolitan areas of the northeast, central, and coastal regions. Additionally, the nonmetropolitan census tracts of the state of Mississippi show a significant positive relationship between the percentage of persons with broadband access and poverty rates. Generally, these significant correlations imply that nonmetropolitan census tracts across the state with higher percentages of their populations with broadband access also tend to have higher rates of poverty. The correlations between the broadband variable and poverty rates for the Delta region and the metropolitan areas of the Delta region are negative and statistically significant in column one. A negative correlation implies that as broadband access increases in those census tracts the poverty rate decreases. In column two, these are the correlations between the broadband access variable and MHI. There is a mix of negative and positive correlations in this column. However, the statistically significant correlations in column two are all positive. For the areas with a positive, statistically significant correlation in column two, it means that as broadband access increases, so does the MHI in those census tracts.
Columns three and four show the correlations between the percentage of households with at least one computing device and the poverty rate and MHI, respectively. All correlations in column three are negative. Many of the correlations in column three are also statistically significant. The only areas without statistically significant correlations in column three are the combined northeast region and the metropolitan and nonmetropolitan areas within the northeast. Aside from the northeast, these findings indicate that census tracts with higher percentages of their households with at least one computing device will have lower poverty rates. On the other hand, all the correlations in column four are positive. The northeast region is the only area to not have a statistically significant correlation coefficient in column four. Apart from the northeast region, column four shows that as the percentage of households with a computing device increases, so does the MHI.
|
Region |
Area |
(1) Population with broadband and poverty rate |
(2) Population with broadband and MHI |
(3) Households with computing device and poverty rate |
(4) Households with computing device and MHI |
|
Delta |
-0.17* |
0.25*** |
-0.77*** |
0.76*** |
|
|
Metropolitan |
-0.28** |
0.37*** |
-0.86*** |
0.75*** |
|
|
Nonmetropolitan |
0.04 |
-0.02 |
-0.57*** |
0.63*** |
|
|
Northeast |
0.27*** |
-0.02 |
-0.13 |
0.52*** |
|
|
Metropolitan |
0.29 |
-0.54 |
-0.69 |
0.58 |
|
|
Nonmetropolitan |
0.27*** |
-0.01 |
-0.11 |
0.53*** |
|
|
Central |
-0.02 |
0.19*** |
-0.57*** |
0.69*** |
|
|
Metropolitan |
0.01 |
0.12 |
-0.56*** |
0.66*** |
|
|
Nonmetropolitan |
0.25** |
-0.12 |
-0.38*** |
0.58*** |
|
|
Coastal |
0.09 |
0.08 |
-0.50*** |
0.66*** |
|
|
Metropolitan |
0.02 |
0.05 |
-0.61*** |
0.67*** |
|
|
Nonmetropolitan |
0.22** |
-0.03 |
-0.34*** |
0.56*** |
|
|
Mississippi |
0.02 |
0.15*** |
-0.55*** |
0.67*** |
|
|
Metropolitan |
-0.03 |
0.13** |
-0.63*** |
0.66*** |
|
|
Nonmetropolitan |
0.17*** |
-0.02 |
-0.42*** |
0.61*** |
Note: *, **, and *** represent statistical significance at the 10 percent, 5 percent, and 1 percent levels, respectively.
Conclusion
This publication provides a detailed examination into the current situation of broadband access in Mississippi. An additional technology-related variable and two economic indicators were evaluated to determine if they have any relationship with broadband availability. The regional analysis lends support to the idea of a “digital divide” in terms of broadband access between rural and urban areas. The percentage of persons in nonmetropolitan areas in Mississippi with broadband access is lower in comparison to the urban areas in the state. The analysis done for the MSAs also indicates that persons in core and noncore areas of MSAs differ in terms of their broadband access, with core areas having greater broadband availability. These findings can be used as a starting point for evaluating where future broadband investment should be targeted in Mississippi.
The correlations between the variables also provide interesting results. The correlations between the broadband access variable and percentage of households with at least one computing device indicate both positive and negative relationships among those two variables. However, the only statistically significant correlation coefficients between the broadband and computing device variables are positive. In other words, as broadband access increases in a census tract, so does the percentages of households with at least one computing device. For the correlations between the percentage of persons with broadband available and both poverty rates and MHI, the correlations are varied in terms of the direction of the relationship and statistical significance depending on the area being analyzed. These findings indicate that broadband availability in an area is not necessarily related to favorable economic circumstances. A potential explanation for the nonintuitive findings (as broadband access increases, poverty rates increase and MHI decreases) could be because broadband infrastructure is available for areas with higher populations surrounding city centers—the core and noncore areas in MSAs. When this finding is seen for nonmetropolitan areas, it could be due to higher levels of income inequality. So, in these nonmetropolitan areas, there could be a large enough subset of the population with high MHI, so that service providers would be willing to invest in infrastructure but that a significant proportion of the population with lower levels of MHI would also have access to that infrastructure. A study of the effect of broadband access over time should be performed to identify the specific effects that access has on both high- and low-income population groups.
The correlations between the percentage of households owning at least one computing device and the economic variables were generally uniform throughout the analysis. For most of the different areas in the regions and MSAs, there was a positive, statistically significant correlation between percentage of the households with at least one computing device and MHI. Likewise, there was generally a negative, statistically significant correlation among percentage of households with a computing device and poverty rates for all specified areas. The correlations indicate that, for all areas in Mississippi, economic well-being increases the percentage of households that have a computing device, which, in turn, provides them with the means to connect to the internet, if it is available to them.
Sources
Federal Communications Commission. 2020. Fixed Broadband Deployment Data from FCC Form 477. Available at https://www.fcc.gov/general/broadband-deployment-data-fcc-form-477.
United States Census Bureau. 2021. American Community Survey, 5-Year Estimates (2015-2019). Available at https://data.census.gov/cedsci/.
Office of Management and Budget. 2020a. Core Based Statistical Areas (CBSAs), Metropolitan Divisions, and Combined Statistical Areas (CSAs) Delineation Files. Available at https://www.census.gov/geographies/reference-files/time-series/demo/metro-micro/delineation-files.html.
Office of Management and Budget. 2020b. Delineating Metropolitan and Micropolitan Statistical Areas. Available at https://www.census.gov/programs-surveys/metro-micro/about.html.
Publication 3653 (POD-7-21)
By Devon Meadowcroft, PhD, Extension Instructor, Delta Research and Extension Center; Ayoung Kim, PhD, Assistant Professor, Agricultural Economics; Alan Barefield, PhD, Extension Professor, Agricultural Economics; and James Barnes, PhD, Associate Extension Professor, Agricultural Economics.

The Mississippi State University Extension Service is working to ensure all web content is accessible to all users. If you need assistance accessing any of our content, please email the webteam or call 662-325-2262.