
Obtaining Biomass/Volume/Carbon Estimates Using EVALIDator Version 2.0.3

Forest Inventory and Analysis Program
The Forest Inventory and Analysis (FIA) Program of the USDA Forest Service provides the information needed to assess forests of the United States. As the nation’s continuous forest census, this program can be used to project how forests are likely to appear 10 to 50 years into the future. FIA reports on status and trends in forest area and location; in the species, size, and health of trees; in total tree growth, mortality, and removals by harvest; in wood production and utilization rates by various products; and in forest land ownership.
Data is reported on a county, regional, and statewide basis, ensuring the confidentiality of individual landowner information. FIA teams will not access private land without the landowner’s permission.
The Mississippi Forestry Commission, in cooperation with the Southern Research Station of the USDA Forest Service, conducts a forest inventory to measure the status of all the forest resources in Mississippi. The FIA program consists of a series of permanently established plots that are remeasured on average every 6.6 years to determine growth, composition, and mortality of forests, as well as land use changes and potential for wildfire in the state.
Mississippi has around 5,550 sample plots across the state, of which 4,013 are currently forested. Each year, about 10 to 20 percent of these plots are visited and measured by field crews (see Appendix A). (USDA Forest Service. 2020. Forests of Mississippi, 2018. Resource Update FS-258. Asheville, North Carolina: U.S. Department of Agriculture, Forest Service. 2p)
Use of Evalidator
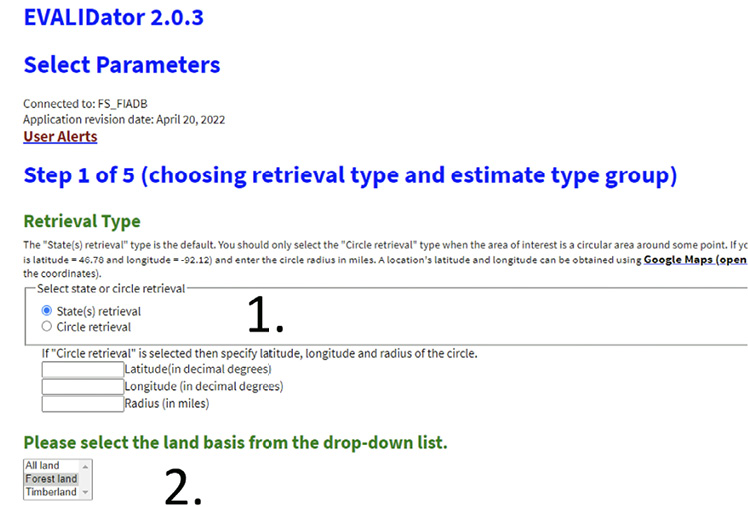
Step 1
To conduct a county, multicounty, regionwide, or state assessment, select “State retrieval.”
Step 2
Select whether you want projections on FIA-defined “Forest land” or “Timberland.” Formally, FIA timberland includes forestlands where productivity exceeds 20 cubic feet per acre per year. In other words, timberlands are more productive forested sites, while the forest land classification includes timberland but also land that is of very low productivity, perhaps due to excessive flooding or very low site fertility. Therefore, timberland is a subset of forest land. If you are interested in examining fiber resources for timber product production, select “Timberland.” If you are looking for fiber resources for biomass or carbon sequestration, select “Forest land.”
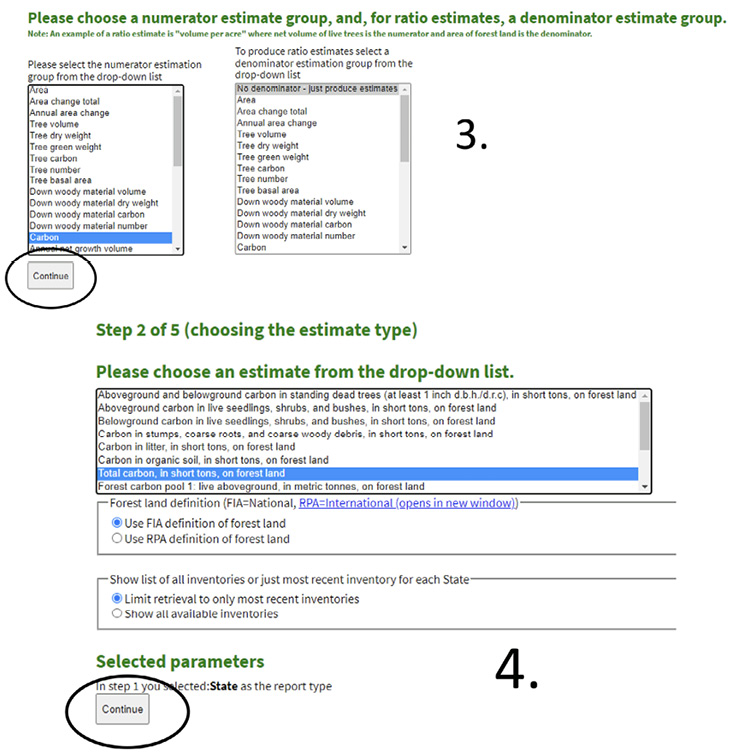
Step 3
There are many variables to examine. To look at volume production, select “Tree volume.” If you are interested in carbon, select “Tree carbon.” For information on biomass, select “Tree dry weight” or “Tree green weight.”
Next, select “Continue.”
I strongly recommend that you examine only the absolute amounts of a particular variable (left – numerator). However, you could obtain a ratio estimate (right – denominator) by selecting a numerator variable from the left and a denominator variable from the right.
Step 4
Let’s assume that you selected “Forest land” in Step 2 and “Tree carbon” in Step 3. To examine the amount of total carbon, select “Total carbon, in short tons, on forest land.”
For carbon, there are many other potential attributes, including variables of woody belowground and aboveground carbon, both living and dead. You also can obtain carbon estimates of the forest litter and soil organic pools. There are also several options if you select volume or biomass (weight) rather than carbon.
Now, select “Use FIA definition of forest land” and “Limit retrieval to only most recent inventories.”
Select “Continue.”
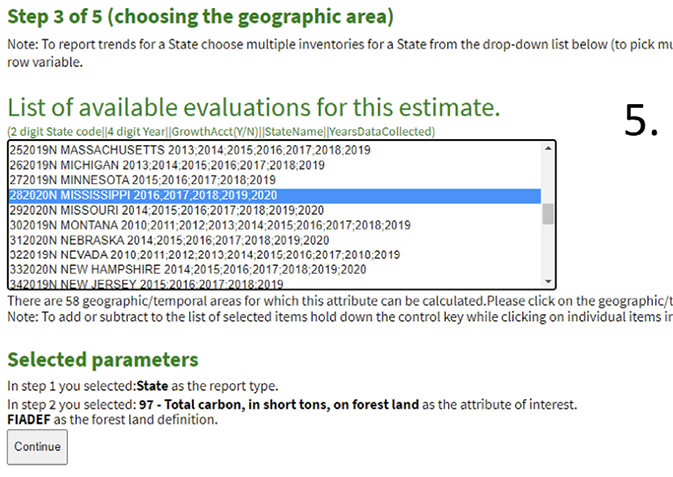
Step 5
After you complete the previous four steps, select a particular set of inventory data. Selecting “Limit retrieval to only most recent inventories” will currently allow you to select only the most current evaluation for a particular state. Within FIA, an evaluation is an estimate of a particular variable in a given year. However, within a state, not all FIA plots are measured during a single year. FIA measures what are referred to as panels of plots.
A panel is a grouping of plots that are measured during a particular year; when those same plots are periodically measured again, they are all remeasured during the same year. For Mississippi (at the time of publication), the panels comprising the 2020 evaluation are 2016, 2017, 2018, 2019, and 2020 panels. Therefore, any substantial change after 2020 (such as hurricanes or southern pine beetle infestations) to a landscape will not be observed in estimates using the 2020 evaluation. Notice in the screen capture the descriptor of “282020N.” The 28 is FIA’s code for Mississippi and, 2020 refers to the evaluation year.
Notice at the bottom that the variable of interest selected can be seen (for this example, it is “Total carbon, in short tons, on forest land”). Additionally, you can see that the FIA definition of forest land was selected (FIADEF), as opposed to the RPA definition.
Click on the “Continue” button.
Step 6
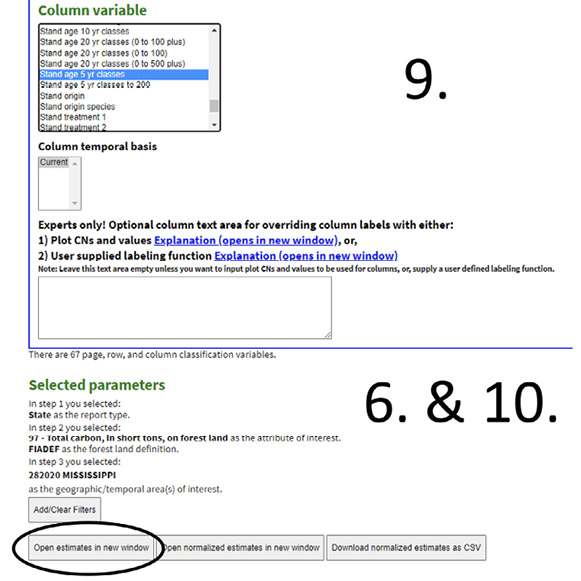
The next page contains a variety of options that display data for a particular inventory (for example, MISSISSIPPI 2016; 2017; 2018; 2019; 2020), the 2020 FIA evaluation. For beginners, I recommend only manipulating page, row, and column variables. It might be best to avoid adjusting the optional filters. However, these filters are somewhat self-explanatory and can be selected by clicking the “Add/Clear Filters” toggle.
I recommend that beginning users just select “Open estimates in new window.”
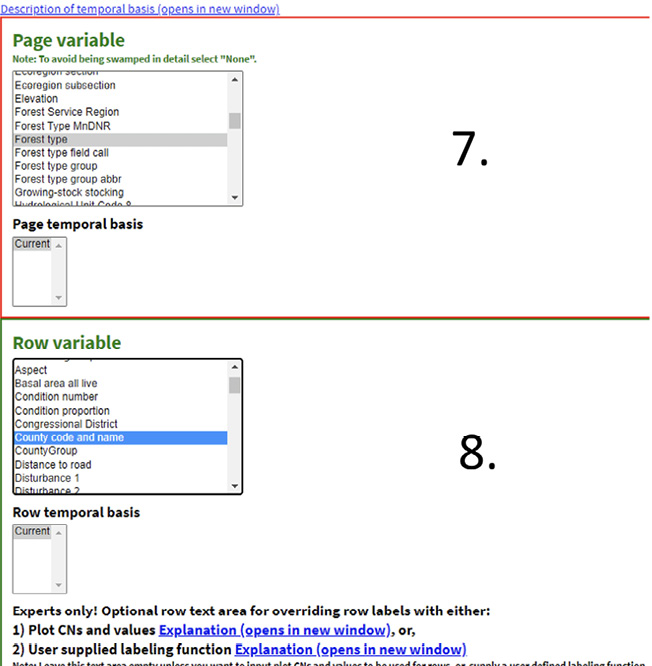
Step 7
Before you select “Open estimates in new window,” let’s first review page, row, and column variable headings. A variety of options can be selected for the “Page variable.” For this example, “Forest type” is selected. A forest type is essentially a collection of trees of an individual species or a collection of species commonly found growing naturally together. It can also be a collection of trees that are established and grouped together for management reasons. An example is loblolly pine, longleaf pine, or sweetgum/Nuttall oak/willow oak. Thus, when the data is outputted on the next screen, carbon estimates will be shown by county (the example “Row variable” in Step 8) and stand age class (the example “Column variable” in Step 9) for each forest type in a separate page (really just a separate table).
Step 8
A variety of options can be selected for the “Row variable.” For this example, we will select “County code and name.”
Step 9
A variety of options can be selected for the “Column variable.” For this example, “Stand age 5 yr classes” is selected. This allows a user to get an idea of the amount of carbon within particular age classes by county and forest type.
Step 10
After selecting page, row, and column variables, scroll past the filters (“Add/Clear Filters”), and then click the “Open estimates in new window” button.
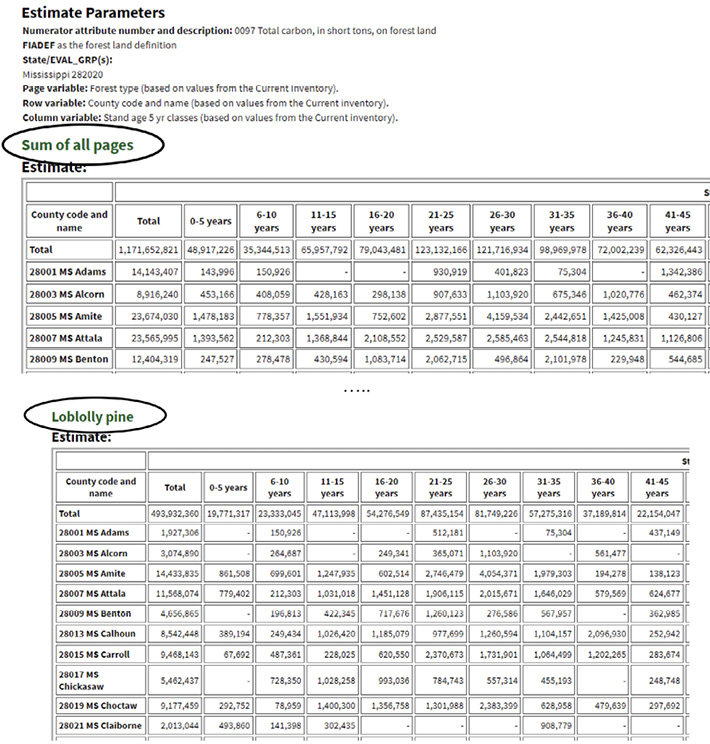
The top of the output page displays several pieces of information: (1) a description of the attribute of interest (“0097 Total carbon, in short tons, on forest land”); (2) the definition of forest land used (FIADEF); (3) the region/inventory selected (“Mississippi 282020,” where 28 is the FIA code for Mississippi and 2020 refers to the evaluation year); and (4) the page, row, and column variables selected. This display will help make sure you are viewing the analysis you wanted. If something is incorrect, simply go back or restart EVALIDator. “Sum of all pages” is the total amount of an attribute (in this case, total carbon) across all species/forest types. Below this you will find estimates by forest type (for example, Loblolly pine). Remember that forest type was selected as the page variable in Step 7.
Notice that “County code and name” is presented by row, while stand age classes are presented by column.
Associated sampling errors and number of non-zero plots are presented in tables (or pages) below specific values of the selected page variable. All estimates are derived from a subset, or reduced portion, of forestlands in a particular state (for our example, Mississippi), thus all estimates have errors associated with them. The associated sampling errors help determine how much confidence we can place in the estimates. For clarity, a 1/6-acre FIA plot is randomly located roughly every 6,000 acres, so it can be interpreted that each of the 1/6-acre FIA plots represents forested conditions on 6,000 acres. But does that FIA plot truly represent 6,000 acres on a landscape? Most likely, it doesn’t. That is sampling error. This is why not just a single plot is used to represent a landscape. Rather, 5,550 plots are used (USDA Forest Service 2020 and Appendix A). The use of 5,550 plots helps to provide us a better quantification of what forested conditions exist within a particular landscape.
Results from the tables (pages) can be copied and pasted into Excel.
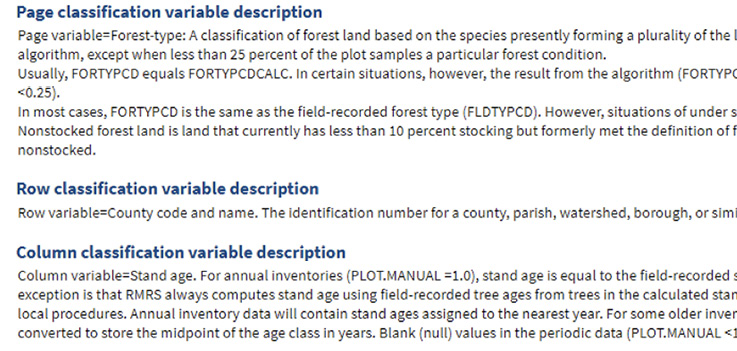
At the bottom of the output, FIA has conveniently included formal definitions of variable attributes that you select. Thus, you don’t need to look up specific attribute definitions in the FIADB Database manuals. This feature will help to ensure that any attribute selected as the page, row, or column variable is consistent with what you were trying to quantify and estimate. Definitions of attributes can be quite complex, so for the sake of brevity, the example of attribute descriptions in this document has been truncated on the right.
APPENDIX A
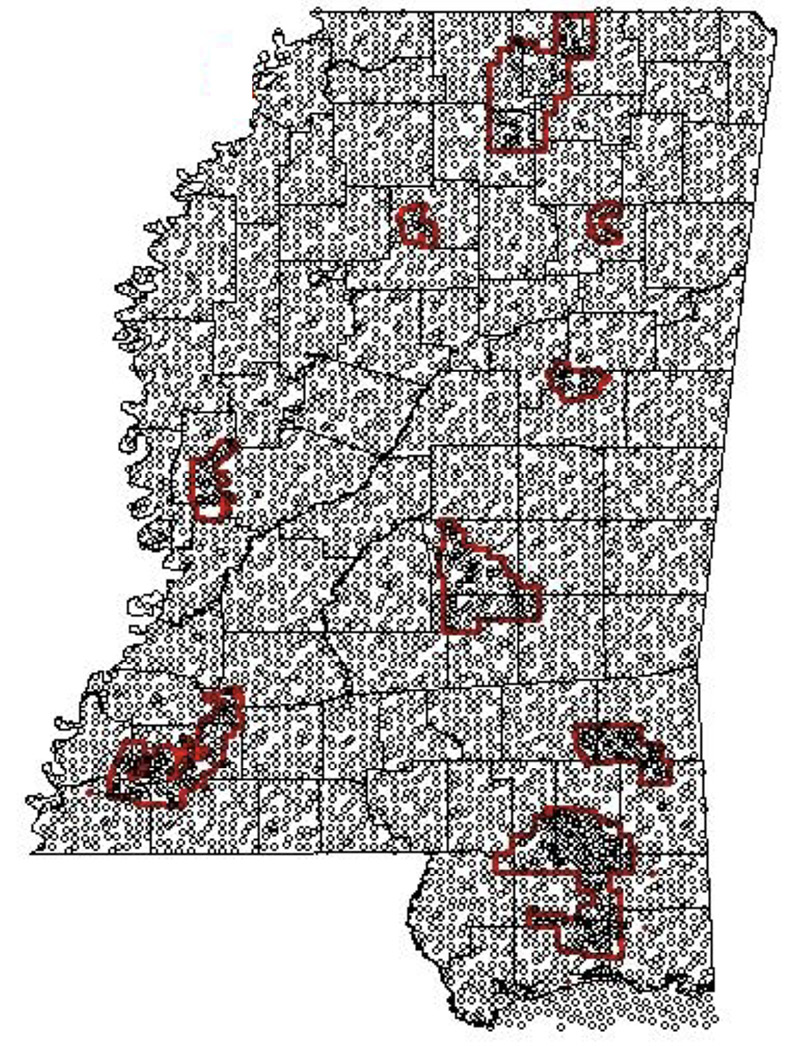
FUZZED AND SWAPPED LOCATIONS OF FIA PLOTS
This map shows fuzzed and swapped spatial locations of all FIA plots that make up the FIA Mississippi 2019 evaluation. Basically, it could be stated that around 1 in 6.6 of the plots was measured annually during 2012, 2013, 2014, 2015, 2016, 2017, 2018, and 2019. Each group of plots measured within a particular year is referred to as a panel. Each plot represents roughly 6,000 acres on the landscape. Red areas are national forests, which have a slightly higher sampling intensity of plots, so each one represents slightly less than 6,000 acres on the landscape. Notice, this is a different FIA evaluation than described throughout this user’s guide (2020 evaluation). Thus, FIA evaluations (such as 2019 and 2020) that are close to one another contain many of the same panels, but they differ in at least one panel.
Current website link for EVALIDator: https://apps.fs.usda.gov/fiadb-api/evalidator
The information given here is for educational purposes only. References to commercial products, trade names, or suppliers are made with the understanding that no endorsement is implied and that no discrimination against other products or suppliers is intended.
Publication 3830 (POD-10-22)
By Curtis L. VanderSchaaf, PhD, Forest Extension Specialist, Central Mississippi Research and Extension Center. Useful comments were provided by Dr. Melissa Kreye of Pennsylvania State University.

The Mississippi State University Extension Service is working to ensure all web content is accessible to all users. If you need assistance accessing any of our content, please email the webteam or call 662-325-2262.