
Fish-Eating Birds on Catfish Ponds in the Mississippi Delta
Commercial catfish production is the largest aquaculture industry in the nation, with most production occurring in the Mississippi Delta. Conflict between fish-eating birds and Mississippi’s catfish producers is a troubling and ongoing issue as these birds continue to eat cultured catfish. Notable among these fish-eating birds are the double-crested cormorant, great blue heron, and great egret. Information on these birds’ use of catfish ponds and management solutions will help reduce their impact on aquaculture producers and the industry.
The following information comes from a collaborative research project conducted by the Mississippi State University Extension Service and Forest and Wildlife Research Center and the U.S. Department of Agriculture’s National Wildlife Research Center. This research focused on answering questions regarding fish-eating bird behavior in relation to catfish ponds in the Mississippi Delta. This publication discusses
- how these birds choose which farm sites to use
- which ponds and catfish size category they are most likely to use
- how cormorant activity in the Delta has changed over the past couple of decades
- how cormorants use catfish ponds versus natural water bodies
- how changes in regulatory policy may affect their use of catfish ponds
Catfish Farm Site Preference
Before selecting a particular pond, fish-eating birds must first choose the general area to begin their hunt. For this study, 43 1-square-mile sections throughout the Delta that contained channel or hybrid catfish ponds were randomly selected. These pond groups were aerially surveyed twice per month over the winters (October to April) of 2015–16, 2016–17, and 2017–18 to see how the abundance of cormorants, herons, and egrets differed between each pond group and what factors influenced bird numbers.
An average of 22 cormorants per pond group were counted, with the greatest counts from February to April. An average of 14 egrets and 8 herons were counted per pond group. Both egret and heron counts were greatest from October to January.
The abundance of cormorants, herons, and egrets was greater in areas with more catfish pond acreage. For example, adding 25 acres of water to a pond group would increase average cormorant abundance by 9 percent, herons by 12 percent, and egrets by 8 percent.
The average number of cormorants and egrets increased when there was more catfish acreage in the general area. Herons, however, tended to have greater numbers when groups of ponds were more isolated.
Cormorant abundance in areas made up entirely of foodfish was on average 35 percent greater than areas containing equal amounts of foodfish and fingerlings.
Cormorant abundance was greater on pond groups that were closer to active roosts.
Pond and Fish Size Preference
This study also looked at pond characteristics that could be used to help predict where birds would be located. Over 1,100 ponds were surveyed, and ponds with and without cormorants, herons, and egrets were observed. Characteristics of these ponds were compared to determine factors that influenced where birds were found. These characteristics included what was in each pond, as well as what was around each pond.
- Larger ponds were consistently more likely to be used by cormorants, herons, and egrets compared to smaller ponds.
- Cormorants were more likely to use ponds farther away from trees, whereas egrets were more likely to use ponds closer to trees. Both cormorants and egrets showed higher use of ponds that were isolated and farther away from buildings, such as offices and shops.
- Ponds stocked with higher densities of catfish, particularly foodfish ponds, were more likely to be used by cormorants and herons.
- Herons and egrets showed greater use of ponds that had diseased fish.
- Cormorants rarely used broodfish or split-pond (Figure 1) waste-treatment cells and showed a slight preference toward channel foodfish compared to hybrid foodfish. Cormorants also used split-pond growout cells less, likely because these ponds were much smaller. Hybrid fingerling ponds were more likely to be used by cormorants compared to channel fingerling ponds.
- Herons also showed less use of broodfish ponds or split-pond waste-treatment and growout cells. Herons were more likely to use channel foodfish ponds instead of hybrid foodfish ponds and were more likely to use channel fingerling ponds over hybrid fingerling ponds.
- Egrets were more likely to forage on channel foodfish than hybrid foodfish, as well as channel fingerlings over hybrid fingerlings. However, the chance of using broodfish ponds or split-pond waste-treatment and growout cells was similar to foodfish and fingerlings. Egrets have a more generalist diet, consume less catfish compared to cormorants or herons, and may not be as dependent on what is in the pond.
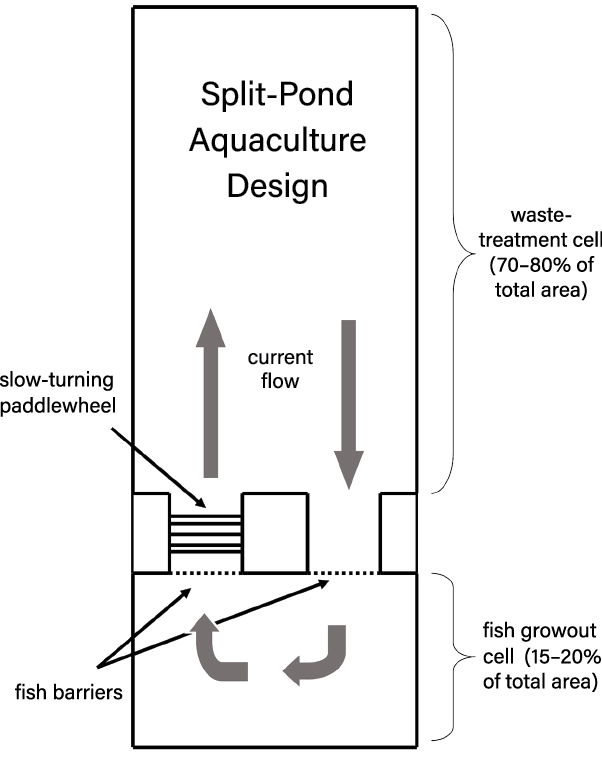
Figure 1. The split-pond aquaculture production system holds fish in a relatively small area, making the logistics of fish-eating bird harassment more feasible.
Historic versus Current Cormorant Activity
Catfish aquaculture acreage in the Delta peaked in the early 2000s, with approximately 134,000 acres of water in production. During that time, studies were conducted to measure cormorant impacts on aquaculture. However, aquaculture has decreased by over 70 percent, with approximately 36,000 acres remaining today(Figure 2). There is concern about how today’s producers are being impacted by cormorants. For example, are more cormorants using fewer acres? Using similar methods as the aerial surveys done in the early 2000s, cormorant roosting sites and aquaculture ponds were surveyed to compare historic cormorant activity in the Delta to current activity.
- Cormorants that migrate through the Delta come from the Midwestern U.S. following the Mississippi flyway south. While the Midwestern breeding population has been increasing, we see fewer cormorants staying in the Delta now compared to the early 2000s. Past roost counts averaged 33,783 cormorants per survey, whereas today, counts average 12,137 cormorants per survey.
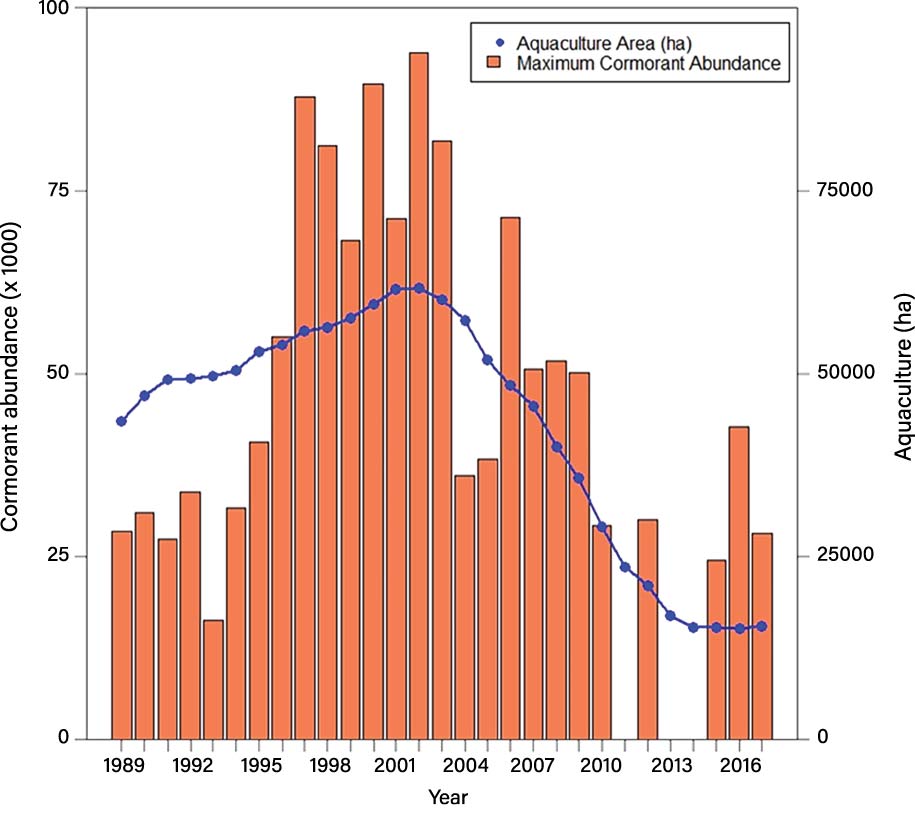
Figure 2. Maximum recorded cormorant abundance (orange bars) and total aquaculture area (blue dotted line) within the Mississippi Delta from 1989 to 2017. - Although both cormorant numbers and aquaculture acreage have declined in the Delta, cormorant density on catfish aquaculture ponds has not significantly changed since the early 2000s. Averaged over the winter season, there were 4.4 to 7.0 cormorants per 100 water acres in the early 2000s, and today there are 4.3 to 6.8 cormorants per 100 water acres. Similar cormorant density between time periods suggests aquaculture producers today face similar, but not greater, predation risk as those in the early 2000s (Figure 3).
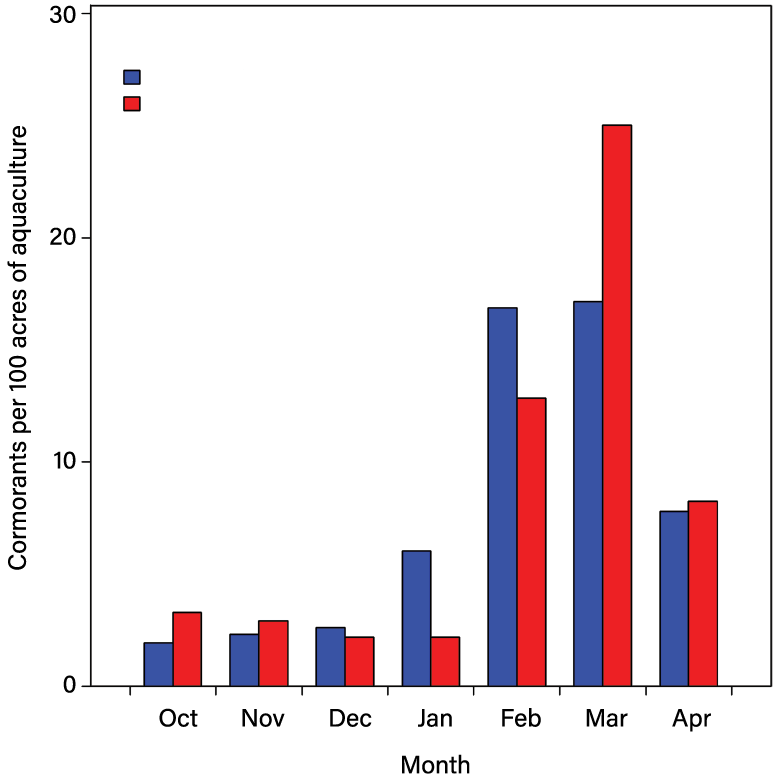
Figure 3. Number of cormorants per 100 acres of catfish ponds in the Mississippi Delta, including past estimates (2000 and 2003), and current (2015–2017). - Monthly cormorant densities on aquaculture ponds varies considerably over the winter months but was similar between time periods. Densities typically rise in January, peak in March, and drop down again in April as cormorants migrate north (Figure 3).
- Similar cormorant densities on catfish ponds between time periods and roost surveys showing fewer cormorants staying in the Delta lend support to the idea that catfish pond area is a primary factor influencing cormorants in the Delta.
- Delta roost survey data from 1996 to 2008 and 2015 to 2017 revealed that the peak cormorant abundance occurs 2.14 days earlier every year (Figure 4).
- Roosts with more catfish ponds around them have a higher chance of being used later in the winter season compared to earlier, and larger roosts often have greater numbers of cormorants.
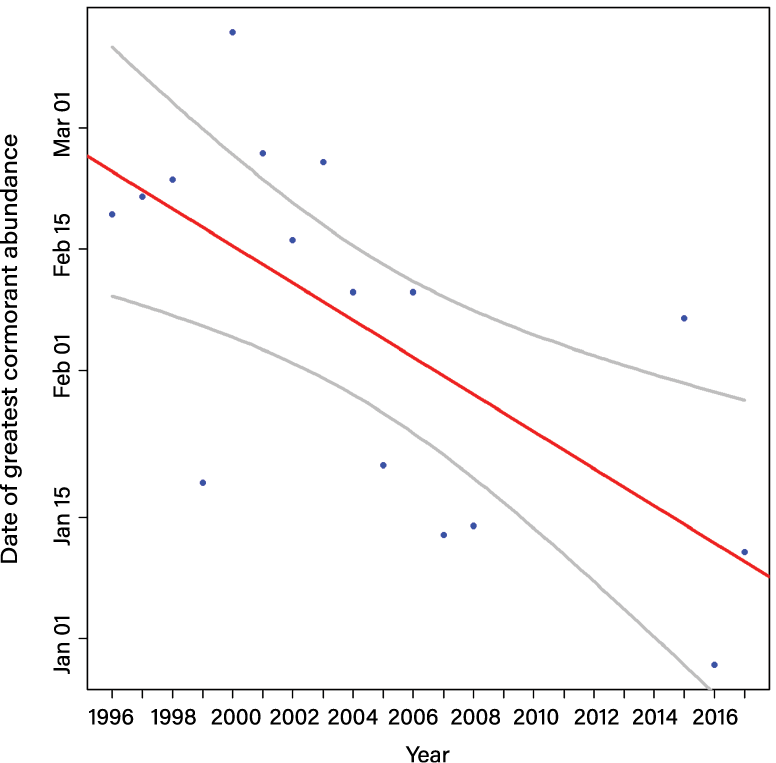
Figure 4. Date of greatest cormorant abundance in the Mississippi Delta from 1996 to 2017. The red line shows the trend, and the gray lines represent confidence intervals. On average, the greatest abundance of cormorants is happening 2.14 days earlier each year.
Cormorant Use of Catfish Ponds versus Natural Water Bodies
About 83 percent of all water within the study area was catfish ponds, and 17 percent was natural water bodies. Another goal of the research was to see if cormorants use each of these water types equally, relative to what is available. That is, are 83 percent of all cormorants found on aquaculture and 17 percent on natural water bodies, or do they favor one over the other? We also looked at whether season and environmental factors like rainfall amounts affect catfish pond use.
- Cormorants favored natural water bodies early in the winter (October to December) but preferred aquaculture ponds later in the winter (January to April). This shift may happen as cormorants try to improve their body condition as they prepare for their northern migration back to the Midwestern U.S.
- Cormorants favored aquaculture ponds more when there was more rain, whereas drier conditions resulted in a preference of natural water bodies. Wetter conditions may make foraging harder at natural water bodies, and possibly reduce bird harassment efficiency at catfish farms due to reduced access to levee roads.
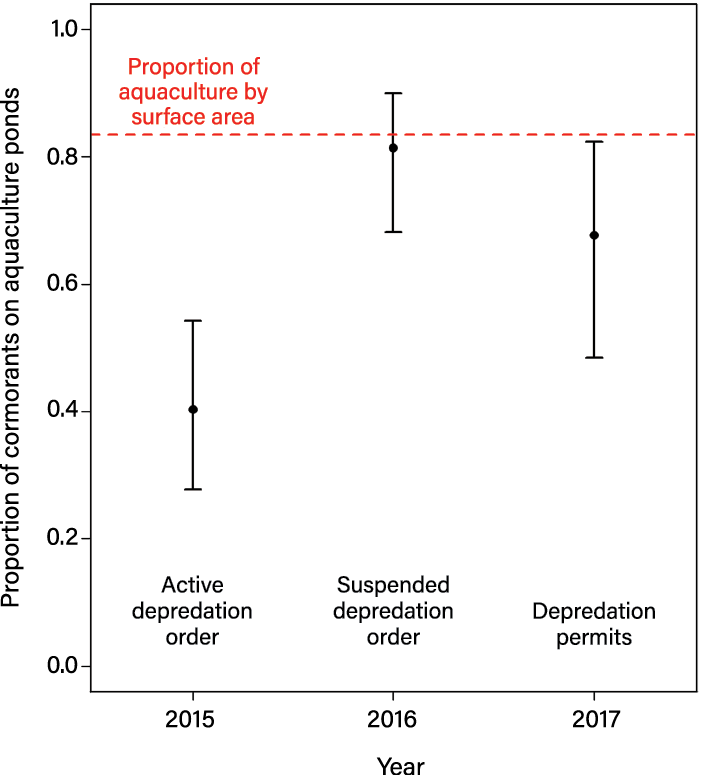
Influence of Regulatory Policy
During the 2015 winter, catfish producers could legally use lethal control against cormorants under the aquaculture depredation order. But in the winter of 2016, the order was ceased, and only nonlethal means of harassment could be legally used. During the 2017 winter, producers were allowed limited lethal take, under a depredation permit system. This study found that the proportion of cormorants using aquaculture in 2015 was 41 percent, climbed to 81 percent in 2016, and was intermediate at 69 percent in 2017 (Figure 5).
These findings suggest that lethal control may be influencing how cormorants distribute themselves between aquaculture and natural water bodies. Removing the aquaculture depredation order may have resulted in cormorants’ becoming accustomed to nonlethal methods, resulting in greater use of aquaculture ponds, and demonstrates the importance of using lethal reinforcement in addition to nonlethal tools.
Summary
Catfish acreage in the Mississippi Delta has significantly declined in the past two decades, but cormorant density on catfish ponds has remained the same. One possible explanation is that there are fewer cormorants in the region, and this is supported with decreasing roost counts. Cormorant roost harassment can be even more effective today than in the past, because there is less aquaculture acreage to protect and fewer cormorants to move. Roost harassment is important over the entire winter, but even more so around mid-January when cormorant abundance is greatest and when cormorants are more focused on aquaculture ponds. The addition of limited lethal management on ponds and roosts may make dispersal efforts more effective.
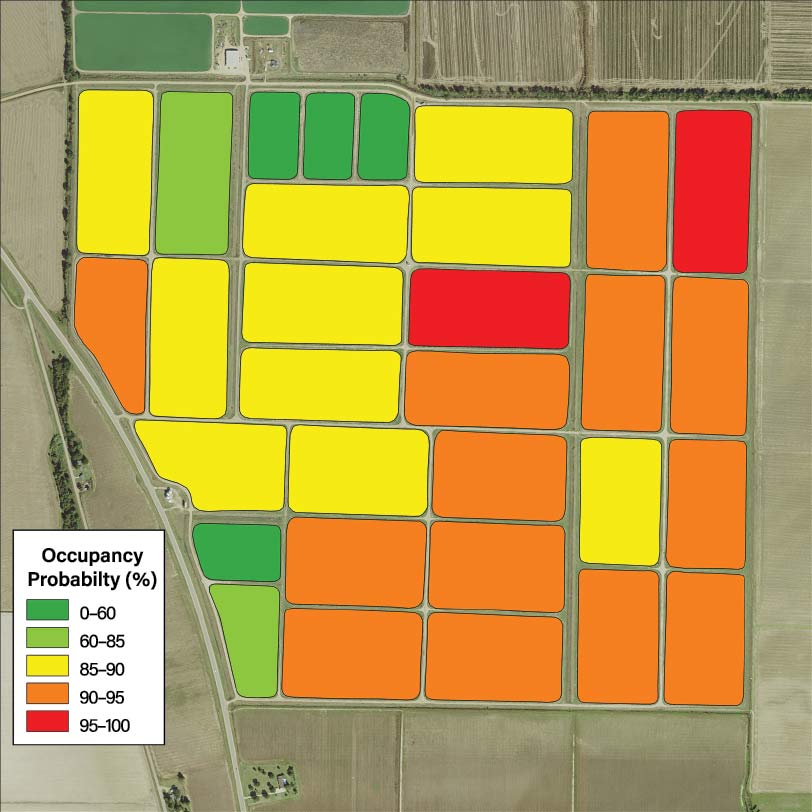
Understanding which ponds fish-eating birds decide to use is important for effective management at catfish farms. Many pond characteristics influence use by cormorants, herons, and egrets. What is in the pond and what is around the pond are things these birds take into consideration. From this work, it is possible to produce a “heat map” of farms showing the probability that each bird species will use a given pond (Figure 6). Paying more attention to ponds with higher probabilities of damage may help bird harassment efficiency on the farm and reduce depredation.
Suggested citation format:
Burr, P., J. Avery, G. Street, B. Strickland, and B. Dorr. 2020. Fish-eating Birds on Catfish Ponds in the Mississippi Delta. Mississippi State University Extension Service Publication 3482.
Funding for this project was provided in part by the Southern Regional Aquaculture Center through grant number 2016-38500-25752 from the U.S. Department of Agriculture National Institute of Food and Agriculture.
The findings and conclusions in this publication are those of the authors and should not be construed to represent any official USDA or U.S. government determination or policy.
Publication 3482 (POD-07-20)
By Paul Burr, Research Associate, Wildlife, Fisheries, and Aquaculture; Jimmy Avery, Extension Professor, Delta Research and Extension Center; Garrett Street, Assistant Professor, Wildlife, Fisheries, and Aquaculture; Bronson Strickland, Extension Professor, Wildlife, Fisheries, and Aquaculture; and Brian Dorr, Research Wildlife Biologist, U.S. Department of Agriculture, Wildlife Services, National Wildlife Research Center, Mississippi Field Station.
Copyright 2020 by Mississippi State University. All rights reserved. This publication may be copied and distributed without alteration for nonprofit educational purposes provided that credit is given to the Mississippi State University Extension Service.
Produced by Agricultural Communications.
Mississippi State University is an equal opportunity institution. Discrimination in university employment, programs, or activities based on race, color, ethnicity, sex, pregnancy, religion, national origin, disability, age, sexual orientation, genetic information, status as a U.S. veteran, or any other status protected by applicable law is prohibited. Questions about equal opportunity programs or compliance should be directed to the Office of Compliance and Integrity, 56 Morgan Avenue, P.O. 6044, Mississippi State, MS 39762, (662) 325-5839.
Extension Service of Mississippi State University, cooperating with U.S. Department of Agriculture. Published in furtherance of Acts of Congress, May 8 and June 30, 1914. GARY B. JACKSON, Director

The Mississippi State University Extension Service is working to ensure all web content is accessible to all users. If you need assistance accessing any of our content, please email the webteam or call 662-325-2262.


