Conducting Camera Surveys to Estimate Population Characteristics of White-Tailed Deer

White-tailed deer management has become increasingly popular among private landowners and leaseholders. More than ever, hunters play an active role in the management of deer populations. Too often, though, deer management practices are interpreted simply as planting supplemental food plots or implementing a feeding program. While these practices can certainly be an important component of deer management, equally important are harvest management practices designed to change deer population characteristics.
Much of the information needed to make management decisions regarding deer populations can be gleaned from a properly conducted game camera survey. Population characteristics, such as age structure, adult sex ratio, fawn crop, and even population density, can be estimated from a thorough camera survey. What started as an interesting gadget for hunters to use to photograph deer and other wildlife species has since become an important survey instrument for deer managers. In some situations, game camera surveys can photographically record 80 to 90 percent of the deer herd, which is more than sufficient to develop reliable herd management information. When compared with other survey methods, game camera surveys provide the best potential for a reliable, cost-effective method to estimate deer population characteristics.
Background
The use of game cameras as a deer herd management tool began in Mississippi and Texas. Researchers at the Mississippi State University Deer Ecology and Management Lab (www.msudeerlab.com) and Stephen F. Austin State University recognized the potential for trail cameras as a method of estimating deer population size. Researchers determined this same method could be used to estimate fawn crop, adult sex ratio, and the minimum number of bucks on a property.
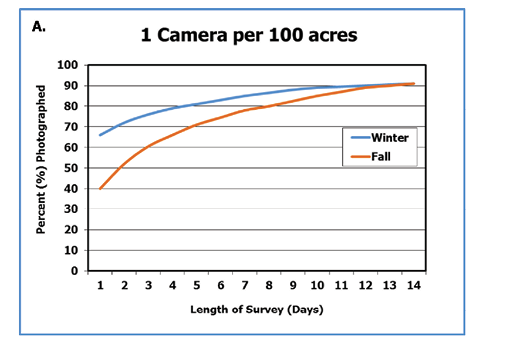
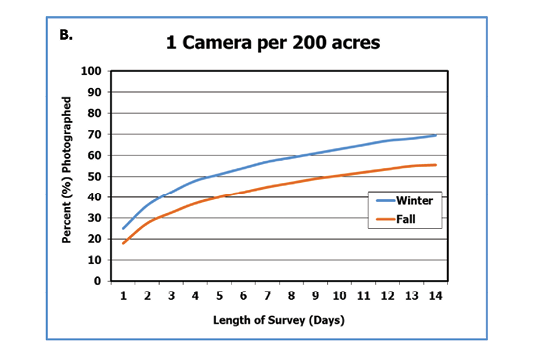
Following the initial study, researchers at the MSU Deer Lab conducted a camera survey study with different deer populations and verified its effectiveness for determining fawn crop, adult sex ratio, and density. In addition, they showed that survey accuracy increases with camera density and length of survey period up to 14 consecutive days (Figure 1, A–B).
The Importance of Population Characteristics
Estimating deer population characteristics, such as sex ratio, fawn crop, and age structure, provides biologists and deer managers with insight into the demographics and productivity of a particular deer population. Biologists use this information to make recommendations that help landowners or hunting clubs reach their management goals.
Adult Sex Ratio

Adult sex ratio—also called buck-doe ratio—is simply the number of adult males relative to the number of adult females in a deer population. Deer populations with adult sex ratios skewed heavily toward females, such as five adult does for every one adult buck, is a strong indicator of overharvest of bucks and underharvest of does. Such a heavily skewed buck-doe ratio also indicates a potential overpopulation problem. Increased doe harvest would reduce forage intake and allow the habitat to provide more food per individual deer, which would improve deer quality and productivity.
Another benefit of an even adult sex ratio is a more intense breeding season (“rut”), which makes for a more exciting hunting experience. It also reduces the number of late-born fawns by causing the fawning season to be earlier and shorter. Often, leaseholders and landowners do not harvest enough does for fear of negatively impacting the population. However, this scenario is rarely a problem for much of the Southeast, and even if the population is overharvested one year, it usually can recover in one to two years.
Recommended adult sex ratios in deer populations mostly depend on management objectives. For example, if the landowner’s objective were to produce the maximum number of deer for annual harvest (called maximum sustained yield), a sex ratio of 1:3 (one adult buck for every three adult does) would be ideal. However, if the goal is to produce bigger bucks, and fawn survival is sufficient, a sex ratio closer to 1:1 is ideal. Thus, the sex ratio can be managed to achieve the herd characteristics and harvest goals for the property.
Fawn Crop
Annual fawn crop estimates are a good way to gauge deer herd productivity, or the numbers of new individuals recruited into a population. In turn, this information helps form the basis for harvest recommendations. For example, if one of your management objectives is to stabilize population growth, then harvest numbers of adult deer should be approximately equal to that of the previous year’s fawn crop. To account for natural mortality, the recommended harvest would be 10 percent less than the estimated fawn crop. Based on this assumption, a deer population with an estimated fawn crop of 100 individuals would require harvesting about 90 adults to keep the population stable.
What if the estimated fawn crop numbers are low in proportion to adult doe numbers in the population? Low fawn recruitment can be a result of several different factors or a combination of factors. Habitat conditions may be poor as a result of overpopulation or lack of habitat management, in which case the poor physiological condition of does negatively impacts their reproduction and/or fawn survival. Antlerless harvest rates, either too high or too low, may have resulted in heavily skewed sex ratios that caused fawn production to be low. Maybe fawn predation rates are high because of inadequate fawning cover or too many predators, such as coyotes.

Accurately determining the number of fawns produced requires estimating population density and separating the antlerless portion of the herd into does and fawns. If you do not have enough cameras to conduct a complete survey (see Camera Density and Length of Survey Period on page 6), then only fawns per doe (recruitment rate) can be estimated. The recruitment rate is vital information because it informs the deer manager about the productivity of the herd.
Buck Age Structure

The age structure of a deer population is simply the proportion of animals in each age class (1.5 years old, 2.5 years old, etc.). If producing larger-antlered bucks is one of your management goals, then knowledge of buck age structure is critical. What most deer managers like to see in a buck population is an even age structure, which is a nearly equal number of young and old bucks. An even age structure indicates that young bucks are being produced (i.e., the deer herd is productive), and many of them are surviving to reach the 3.5- to 5.5-year-old age classes. On the other hand, a deer population that consists mostly of 1.5- to 2.5-year-old bucks and very few 3.5-year-old and older bucks indicates many bucks are being harvested at a young age. While nutrition is certainly a factor in antler growth and development, the best formula for producing large antlers is to allow young bucks to reach those older age classes.
Probably the most exciting thing about this part of the survey is seeing the bucks present on your property and determining which ones might be available for harvest. Many people want to know if the buck that got away last year is still around this year—and if so, is he a bigger and better buck? Once individual bucks have been determined and grouped according to age class, these same photos can be used to identify which bucks to target for harvest and which to protect. In addition, harvesting older bucks with undesirable antler characteristics frees up food resources for younger bucks with better antler growth potential.
The MSU Deer Lab has developed software called Buckscore to assist deer managers and hunters with scoring and aging bucks in game camera photographs. Deer managers can then calculate buck age structure of the herd and age-specific antler sizes of all the bucks photographed. In turn, this information can be used to formulate buck harvest decisions (e.g., which bucks should be protected from harvest because they are too young or which bucks should be harvested because they meet the deer manager’s criteria for age and associated antler size). Go to www.buckscore.com for more information on how this software can be used in your deer management program.
Conducting a Camera Survey
You may have already used trail cameras at some point to evaluate bucks on a property. If so, then your experience puts you one step ahead in the game. In conducting a camera survey, you are simply taking it to another level and applying your experience to a more scientific process. Simply put, you will intensify your efforts to photograph as many deer as possible to produce an accurate “snapshot” of the population. Camera surveys can capture up to 90 percent of the deer herd. The actual percentage of the deer herd you record during the survey depends on the following:
- Time of year the survey is conducted.
- Bait attractiveness relative to native forage (acorns) and competition with other species, like wild pigs.
- Camera density and length of survey period.
- Camera site selection and preparation.
- Weather.
- Movement of individuals into and out of the local population.
Not all of these factors can be controlled, but the information provided in the following sections will enable you to plan and conduct an accurate survey of the deer population on your property.
Camera Survey Timing
The best time to conduct a survey depends on (1) what you want to know about the deer population, (2) state regulations, (3) alternative food sources, and (4) fawning dates. If the primary objective is to obtain harvest criteria for bucks before hunting season, then preseason is obviously the most appropriate time. Antler growth is complete, making bucks identifiable, and bucks are beginning to move more frequently.
If a fawn crop estimate is your primary objective, then timing will depend on average fawning date, as fawns do not often visit camera bait sites during their first two to three months. While it is easier to distinguish adult females from fawns when they are very young, a camera survey during September to October will underestimate fawn crop if peak fawning is late July through mid-August. However, in areas of the Southeast where fawning occurs during June through mid-July, a September to October camera survey should provide accurate fawn crop results.
Postseason surveys make distinguishing fawns from adult females more difficult, but the resultant fawn crop estimate may be much more representative of a property with midsummer fawning dates. With care and experience, most people can learn to accurately distinguish fawns from adults in the post-hunting season. It helps to operate cameras throughout the hunting season to have reference photos of does and their fawns at different ages. Depending on state regulations, you may not be allowed to use bait on the ground during hunting season.
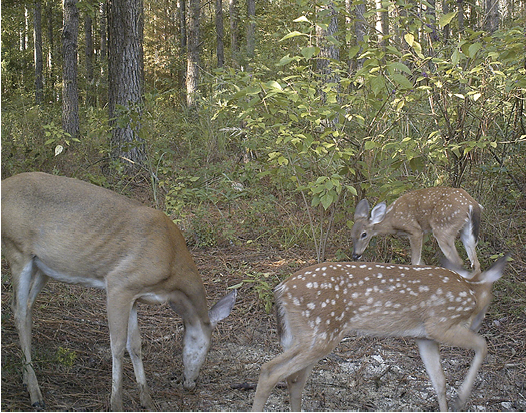
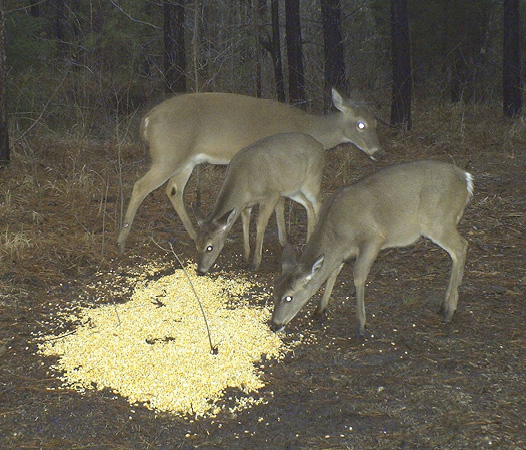
Bait attractiveness varies with the time of year and competition with preferred native forages and other wildlife species.
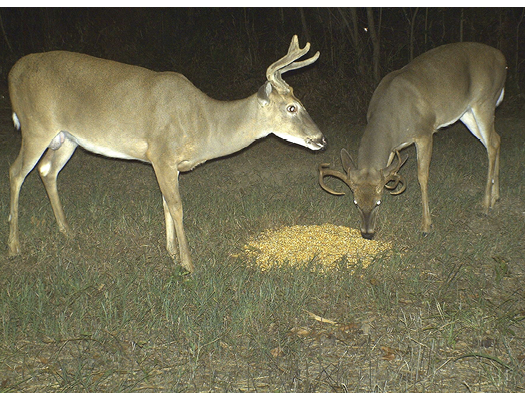
In order to photograph deer, you must be able to attract animals to the camera site. The best way to accomplish this is with bait.
Factors such as familiarity with bait, acorn crop, and other alternative food sources will influence baiting success. If the animals cannot be successfully attracted to bait, then the camera survey method has significant limitations. Therefore, it is important to schedule camera surveys before or after acorn availability. Table 1 shows the best times of year to conduct camera surveys for specific population characteristics. Table 1. Recommended times of the year to conduct camera surveys for estimating population characteristics of white-tailed deer.
PopulationCharacteristic |
Preseason |
Postseason |
|
adult sex ratio |
x |
x |
|
fawn recruitment |
x |
|
|
adult herd density |
x |
x |
|
total herd density |
x |
|
|
buck age structure |
x |
x |
|
preseason harvest criteria |
x |
|
|
harvest criteria |
x |
x |
|
herd health |
x |
x |
Note: In some states, it is illegal to use bait to attract wild animals for harvesting and photographing. In addition, improper use of baits can pose potential health risks to deer and other wildlife. Consult your state wildlife agency to determine if a permit is required to lawfully place corn or other baits on the ground for a camera survey.
Camera Density and Length of Survey Period
Survey accuracy increases as camera density and survey length increase. MSU Deer Lab research conducted on tagged deer populations within large fenced acreages (630 and 2,000) showed that when using a camera density of one camera per 100 acres, 90 percent of deer were photographed during 14 consecutive survey days. Using a camera per 200 acres for 14 days decreased the level of accuracy to about 68 percent during winter and 55 percent during fall (see Figure 1, A-B). With a camera per 100 acres, the number of consecutive days required for the buck population estimate to stabilize in the fall was about 13, but during winter it stabilized after only 11 days. It took only three to four days for the sex ratio estimate to stabilize at the 100- or 200-acre camera density during both fall and winter. So estimating adult sex ratio of a population can be accomplished in as little as three survey days in either fall or winter. However, for best estimates of population characteristics as a whole, camera surveys should be conducted when there are no acorns competing with the bait and at a camera density of one camera per 100 acres for a period of 10 to 14 consecutive days.
Survey Design
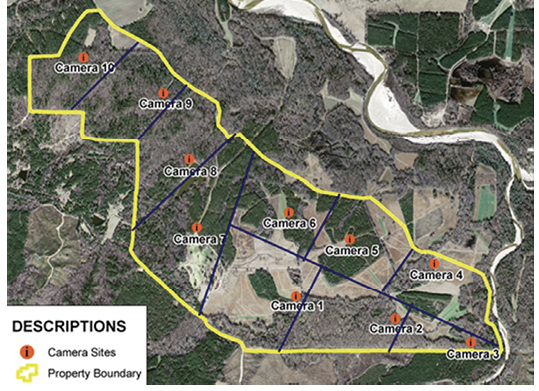
Once you decide which information you want to gain from the survey, the next step is to determine the survey design that will best provide it. Camera survey design and preparation should begin several weeks before the survey. You need an aerial photo of the property to determine where to place cameras so they are evenly distributed over the survey area. Aerial photos can be found on the Internet or purchased from the county tax assessor’s office.
Ideally, it is best to disperse cameras over the entire area for each survey period. However, if camera numbers are limited, the camera survey can be broken into two or three parts. For example, survey half of your property, and rotate cameras to new stations on the other half of the property after the first survey period.
Site Selection and Preparation
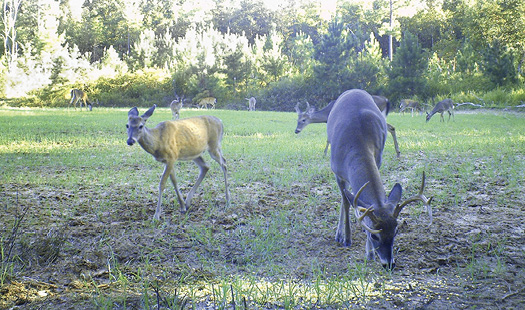
Your goal with site selection is to place the cameras in areas where you can get the maximum number of deer photographs, so carefully select from areas heavily used or often frequented by deer. Some ideal locations for camera sites include edges of small or narrow food plots, paths or roads leading into food plots, and beside salt/mineral licks.
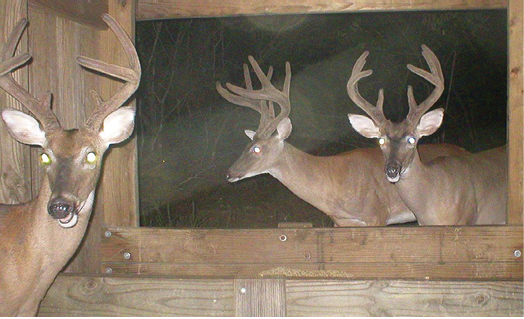

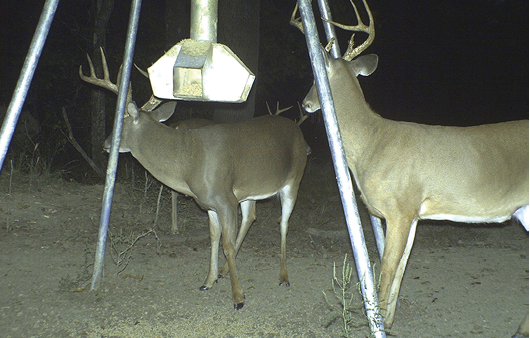
Supplemental feeder locations can be used as camera sites, but it is best to stop feeding and place the bait and cameras away from the feeders.
Feeders in the photograph will likely obstruct the view of some deer, making them difficult to identify. Bait should also be used for camera stations set up adjacent to salt licks.
A less intensive approach, and one to use throughout the fall and winter, is to place cameras along active scrape lines. Most bucks, as well as many does and even fawns, will visit scrapes within their home range. It is common to photograph as many as three to four bucks in one night and as many as 10 or more during a two-week period at a single scrape. Depending on when the breeding season is in your area, scrape activity may start by early November and continue through most of the deer season. Other factors to consider when selecting a camera site include:
- Road or ATV trail access to the site or within close proximity to the site for re-baiting.
- Flat or gentle sloping terrain.
- A semi-open site without a lot of vegetative ground cover and encroaching tree limbs to clear away (running the survey itself is work enough).
- A “closed” background, such as a tree line or brush line, located 10 to 15 yards along the back edge of the site (provides greater contrast for photo clarity and minimizes unidentifiable deer in the distance).
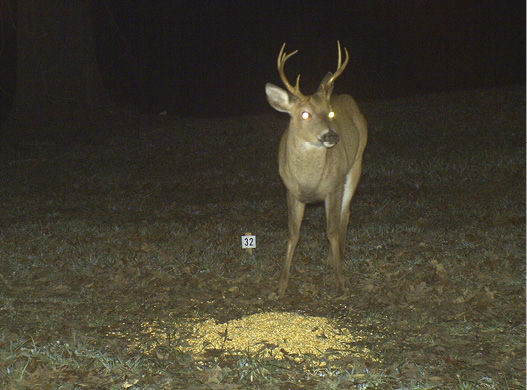
Once suitable locations for camera sites have been determined, clear away any standing vegetation, encroaching tree limbs, and downed debris that may interfere with the camera view or flash effectiveness. Recommended site dimensions call for an area of open ground 25 by 25 feet. Select a tree or install a post 15 to 20 feet from the center of the bait site and attach a camera. Preferably, the camera should face north to avoid glare from the sun. Assign each camera station a number or name and place a sign that clearly displays the station’s ID within range of the camera’s view. Record camera site locations on a map or aerial photo of the property for future referencing.
Prebaiting Sites
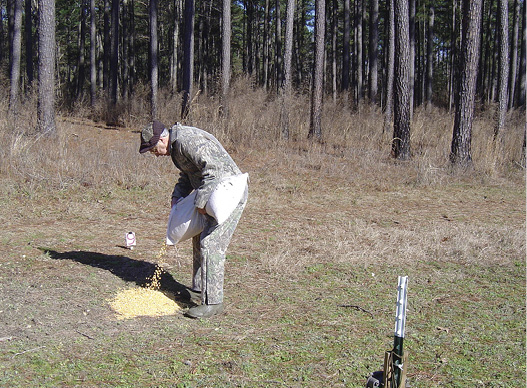
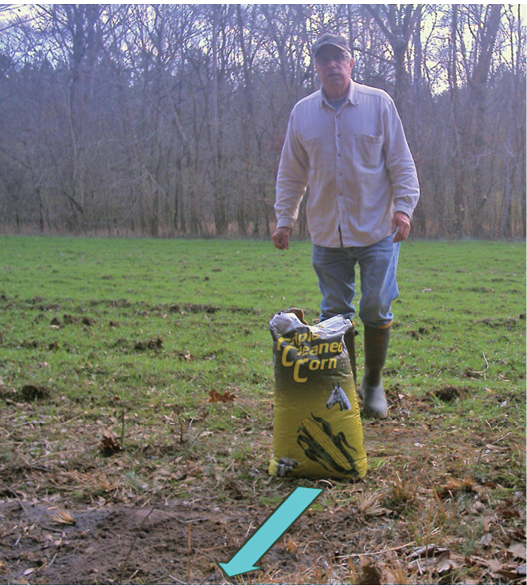
Prebaiting of sites should be conducted at a minimum for four to six consecutive days leading up to the survey period. Prebait each site by scattering 20 to 25 pounds of shelled corn on the ground, and check the sites at least every other day. Information from the cameras, along with deer tracks and bait use, will help you determine if deer are using the sites on a regular basis. If sites need to be relocated, be careful to keep them as evenly distributed across the property as possible and prebait these sites for another four to six consecutive days.
The prebaiting period also provides time to ensure the cameras are operating correctly and deer are centered in the photos and are at the correct distance for identification. You can adjust the camera height and distance from the bait before the survey begins. Adhering to the following steps before and during the prebaiting phase will increase your chances of attracting deer to the bait:
- Before prebaiting sites, shut down all supplemental feeding on the property and remove any remaining feed from feeder locations. Discontinue supplemental feeding for the duration of the camera survey.
- Leave as little human scent as possible when checking sites and resupplying bait.
- Do not use tobacco.
- Do not handle or touch the bait with bare hands.
- If transporting corn in bulk (e.g., loose in a large bin), use a shovel to distribute the corn at bait sites.
- Pour bagged corn directly from the bag.
Camera Selection and Programming
Digital cameras have become the gold standard for conducting camera surveys and are now readily available from many sources at reasonable costs. However, prices vary according to features and quality, so the old adage “you get what you pay for” applies here. The best approach is to research different camera brands based on dependability, photo quality, and features, and purchase from a reputable manufacturer that specializes in trail camera technology. Trigger speed is not an important feature for a survey camera because deer will provide numerous opportunities for photos at the bait site. Instead, choose a camera that delivers quality photos to help identify individual deer and antler characteristics. For optimal survey results, cameras should be equipped with the following features:
- Color photograph capability with a resolution of at least three megapixels.
- Standard white flash with a flash range of 30 to 50 feet.
- Passive detection triggering system.
Program the cameras to record the date and time and operate on a five-minute delay between recording images. Place the camera 15 to 20 feet from the bait, or the distance suggested in the camera operator’s manual. Set the monitor so the beam is aimed 20 to 30 inches above the bait to reduce unwanted photos of raccoons and other small animals. Pay special attention to the camera “views”; remove any obstructions and make sure the area around the bait pile and numbered sign are clearly visible. As mentioned previously, camera placement and functionality should be verified during the prebaiting period. Before leaving the site, take a test picture of yourself to ensure the camera is activated and functioning properly before the survey begins.
Running the Camera Survey
Run (check) the camera sites no less than five consecutive days, and keep in mind that survey accuracy increases with each additional day the cameras are allowed to operate (see Figure 1, A–B on page 2). Running cameras for up to 10 consecutive days can significantly improve results, especially if individual buck photographs are an important objective. The camera survey should begin on the day immediately following the prebaiting period. Check the cameras and bait on the second day of the survey to ensure cameras are still functioning properly and deer are being photographed, and monitor the amount of bait use. Check the cameras and bait every other day for the remainder of the survey period.
Do not visit camera sites during peak times of deer activity, such as dawn to midmorning and late afternoon to dusk. Continue to be mindful of scent control and leave behind as little human scent as possible. When running the cameras, be sure the following tasks have been completed for each site:
- Record the number of pictures taken between site visits.
- Download pictures to a computer file folder for that specific site or change out the memory cards if necessary.
- Check camera batteries.
- Replenish bait as needed.
- Take a test picture of yourself to ensure the camera is activated and functioning properly.
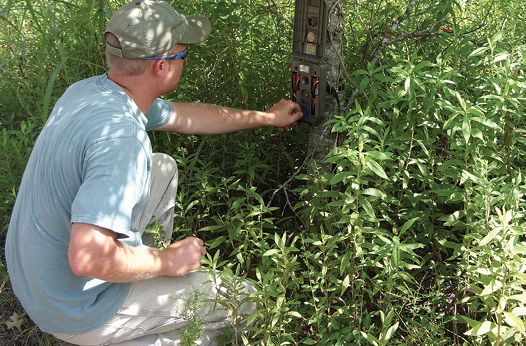
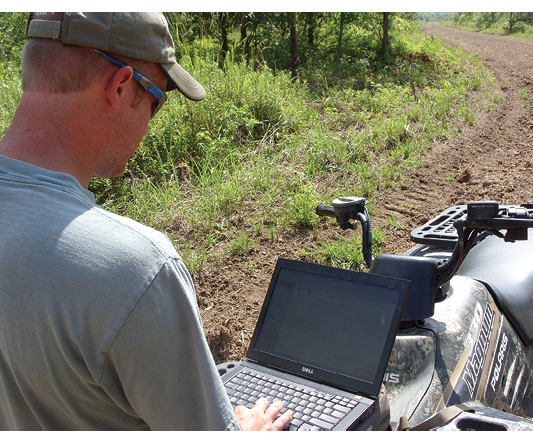

Photo Analysis
Following the survey period, analyze the digital photos to determine (1) total number of bucks, (2) total number of does, and (3) total number of fawns photographed. It is helpful if you create “buck,” “doe,” and “fawn” folders for each camera station at the beginning of the survey and organize the pictures accordingly as you go.
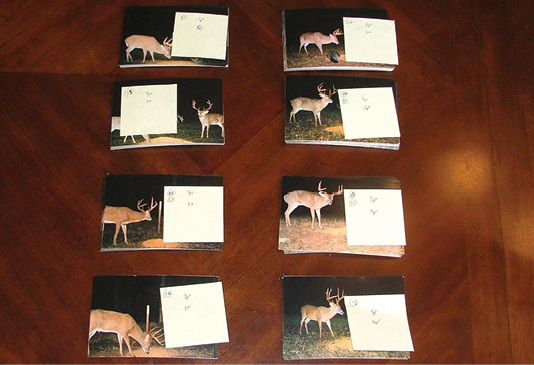
Next, create a separate file folder on your computer for all buck pictures collected from the survey. Carefully examine the buck photos to identify unique/individual bucks based on comparisons of antler and body characteristics. Create a separate file folder for each unique buck identified, and place all photos of that individual in the appropriate folder. Another option is to print only the buck photographs and sort all unique bucks into individual stacks.
The ratio between the numbers of unique/individual bucks photographed and the total number of buck photographs is used to calculate a population factor. The population factor is then applied to the total number of does and fawns photographed to estimate their numbers. These calculations can then be used to provide estimates of the population characteristics.

Conclusion
The camera survey method offers an exciting and practical option for deer managers and hunters, especially with advances in digital technology. Though it may not provide all the answers needed, it is an effective tool that can be used in conjunction with other deer data collection techniques. It is guaranteed to add a new level of knowledge and an element of excitement to deer management and hunting.
Wild Pig-Dominated Sites
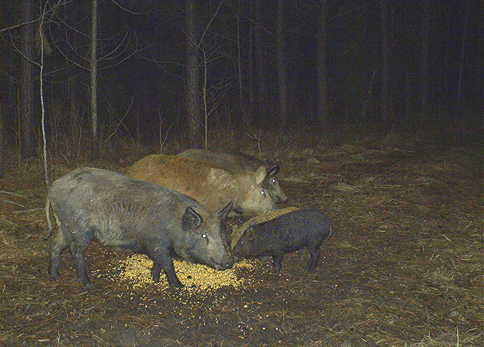
Conducting camera surveys in areas where deer and wild pigs coexist can be frustrating. Wild hogs are aggressive animals and, in “head-to-head” competition with other species for a limited resource, the pigs always win. Upon discovering a baited camera station, wild pigs not only will push any deer present “off” the bait, but they will usually consume all of the bait before leaving the site. Survey success hinges on the ability to attract deer to the camera site, but once wild pigs have discovered the bait, the probability of photographing deer at that location decreases greatly.
So what should you do when such a situation arises? Although the thought of continually feeding wild pigs may be unsettling for some, it is exactly what you should do. Locate a bait site in another area of the same survey compartment (the farther away, the better), and begin prebaiting for deer again. Meanwhile, continue baiting the compromised location in an effort to try to keep the wild pigs visiting that specific site. The objective here is twofold: (1) you reduce the chance of the same group of pigs discovering other camera stations, and (2) you have already conditioned them to the bait and location, which improves your chances of trapping them when the survey has ended.
So be advised: If wild pigs are in the area, it’s a pretty safe bet they will find at least one of your sites. Please see MSU Extension Publication 2659 A Landowner’s Guide for Wild Pig Management: Practical Methods for Wild Pig Control or visit www.wildpiginfo.com for more information about strategies for controlling wild pig populations.
Infrared Cameras or Flash Cameras?
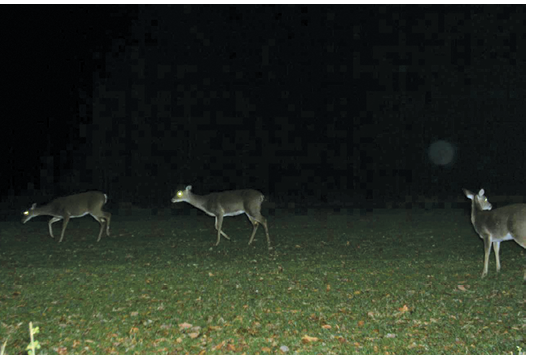
Flash model game cameras are currently the best tools available for surveying deer population characteristics. Flash cameras record color images at night, providing more detail and making it easier to identify individual antlered bucks. In addition, flash cameras take clearer images, even if animals are moving when the image is captured.
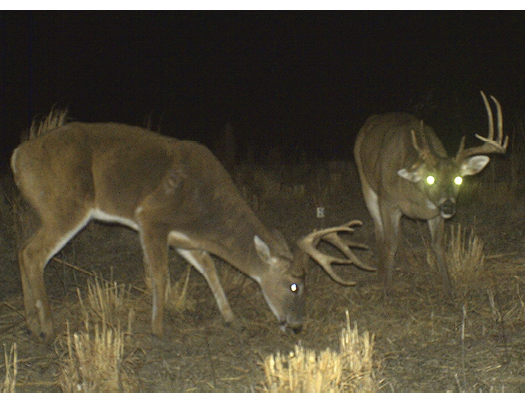
While infrared (IR) cameras are great for preseason scouting or monitoring scrape activity, they are not ideal for camera surveys. Yes, they have a stealth component (they operate without a flash), but there is little evidence to suggest that flash cameras are a deterrent to deer. Pictures taken at night with IR cameras are black and white, which often makes it difficult to distinguish between individual forked bucks and spikes of similar antler sizes. Also, nighttime black and white images are darker, so some deer in the background of photos either go undetected or are unidentifiable as bucks or does. Lastly, IR cameras do not respond well to movement, often resulting in images that are blurred because deer were moving when the camera was triggered.

Don’t Skimp on Camera Batteries!
When purchasing batteries for your camera survey(s), stick with the battery type (lithium or alkaline) and brand name recommended by the manufacturer. While the expense of quality batteries can add up quickly, you’ve invested too much time to risk a failed or poorly conducted camera survey. Some of the newer model game cameras have a built-in sensor that allows you to see the battery life when running the cameras. If using a camera that does not have the built-in battery life sensor, it is worth the few extra dollars to go ahead and purchase a battery tester so that you can check the battery life each time you run the cameras. This will greatly increase your peace of mind for the duration of the camera survey.
Rechargeable vs. Disposable Batteries
A disadvantage of rechargeable batteries, other than price, is that they have a slightly lower voltage output than their disposable counterparts. However, if you’re conducting annual or biannual camera surveys, rechargeable batteries will pay for themselves over time. For a one-time survey, disposable batteries are the more economical option.
Buck- and Doe-Dominated Sites
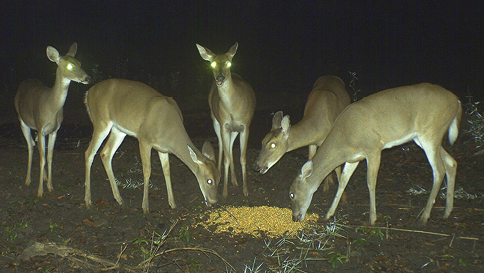
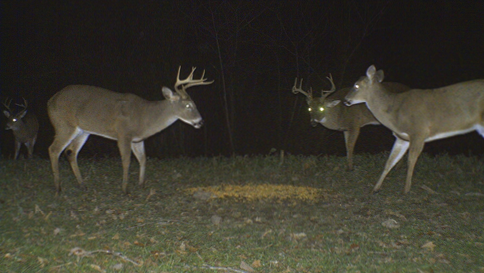
When planning and implementing camera surveys, it is important to understand that deer are not evenly distributed across a property. Instead, deer distribution is most often dependent upon their basic needs: food, cover, and water. Well-managed or higher-quality habitat on a property will receive more frequent deer use because it can support higher deer densities than poorly managed or poor-quality habitat. Therefore, rather than being concerned with evenly distributing cameras across a property (the center of each survey compartment), focus more on locating camera stations in “high traffic” areas of each survey compartment.
Sex and age class also factor into how deer distribute themselves across a property. Bucks and does are segregated for much of the year and tend to use different habitats during this time. This is especially true on properties with permanent feeding stations. Also, depending on when the survey is conducted and the timing of rut in your area, bucks may still be in bachelor groups. So it is not uncommon to have camera stations dominated by bucks and stations dominated by does. With enough camera stations distributed throughout the property, these buck- and doe-dominated sites should “even out” and not bias the survey results.
The Importance of Keeping Good Field Records
A component of camera surveys that people tend to overlook is properly checking each camera and keeping detailed field records. Conducting a camera survey is a major investment of your time and effort, so paying close attention and detecting problems early when running the cameras will increase your chances of conducting a successful survey. Depending on bait usage, cameras should be checked at least every two or three days.
Simply looking to see if the camera is recording images and how many images have been recorded is not sufficient. Just because the camera is recording images does not mean that all is well. Even though the cameras appear to be working, one or more scenarios could be in play that prevent you from recording quality images. Some of the more common problems include (1) a processor going bad, (2) low battery charge, (3) a bad sensor, and (4) flash illumination not functioning.
When running the cameras, be sure to check each camera by viewing the most recent series of photos taken, and record the number of pictures from each site. Collecting this information is invaluable for trouble-shooting camera problems and monitoring camera survey progress.
Appendices
Example: Calculations for Estimating Population Characteristics
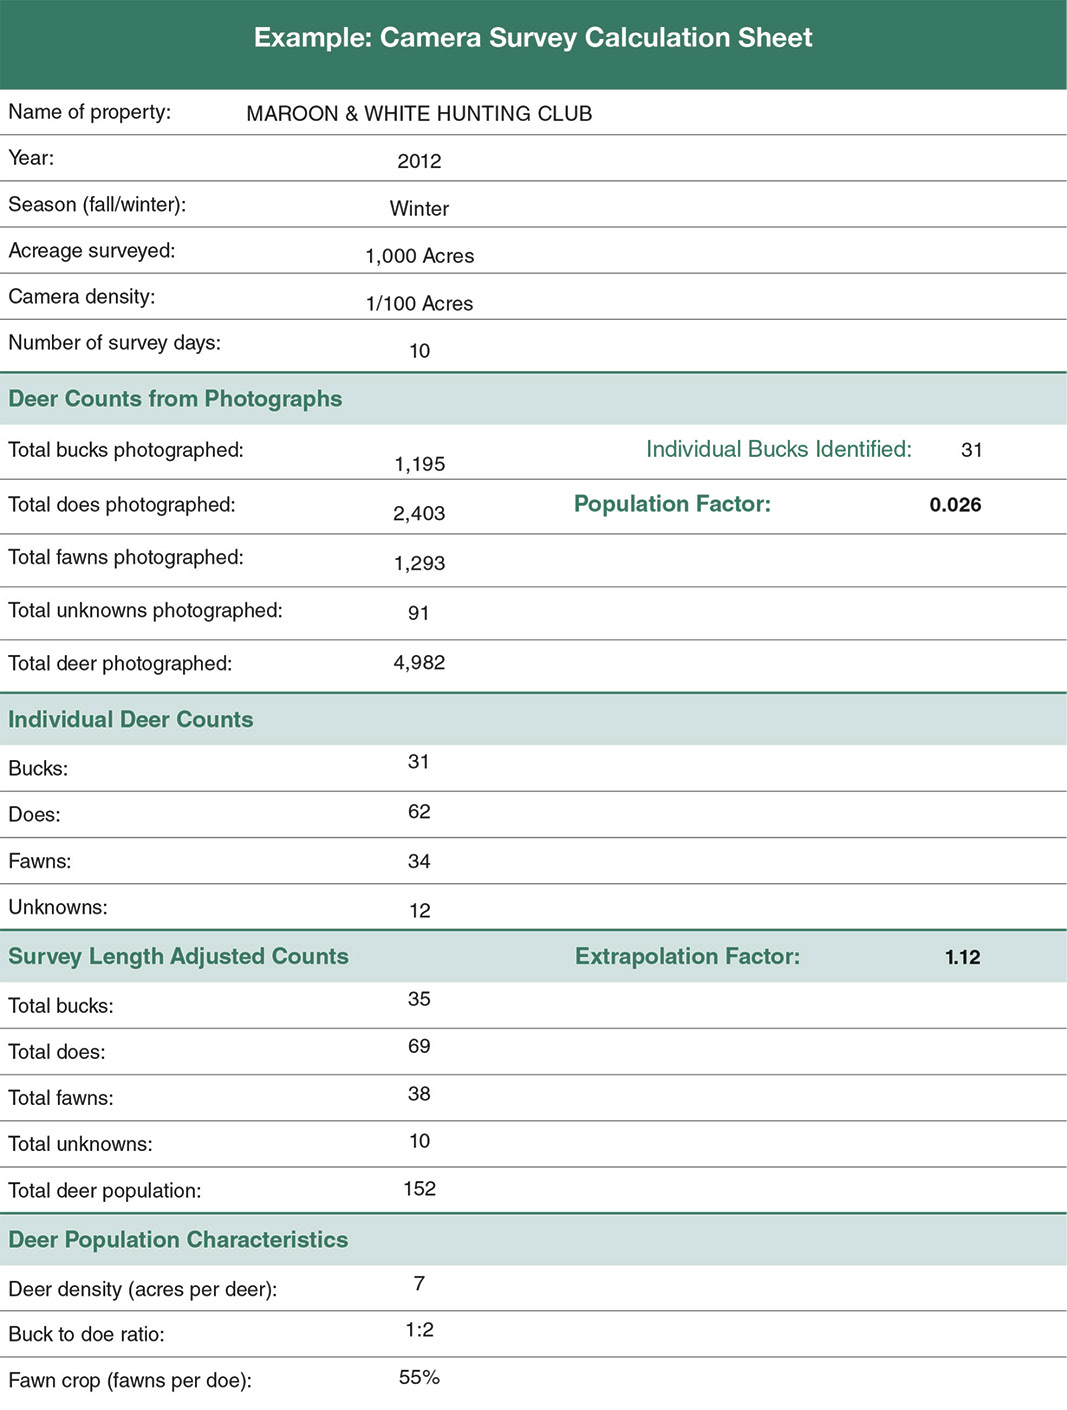
The following example demonstrates how to calculate estimates of deer population numbers and population characteristics for a 1,000-acre property surveyed in winter for 10 consecutive days using a camera density of one camera per 100 acres. Total numbers of deer photographed are as follows:
Total deer photographed = 4,891
Buck photos = 1,195; individuals identified = 31
Doe photos = 2,403
Fawn photos = 1,293
(1) Calculate a population factor based on the relationship between the number of individual bucks (31) and the total number of bucks photographed (1,195).
Population factor = total number of individual bucks / total number of bucks photographed = 31 / 1,195 = 0.026
(2) The population factor (0.026) is then used to calculate a count of individual does and fawns that were photographed during the survey. The number of individual bucks (31) has already been determined.
-
Bucks = 31
-
Does = (Number of photographed does × Population factor)
Does = (2,403 × 0.026) = 62
-
Fawns = (Number of photographed fawns × Population factor)
Fawns = (1,293 × 0.026) = 34
(3) Refer to Table 2 and locate the standardized percentage of the deer population photographed based on the relationship between camera density and consecutive survey days (percentages are taken from Figure 1, A–B). Table 2 shows that the survey described in this example (winter survey; camera density = 1/100 ac.; 10 consecutive days) should result in 89 percent of the deer population photographed. This percentage is then used to calculate an extrapolation factor (Table 3), which simply accounts for the proportion of the deer population that likely was not photographed.
Extrapolation factor = 1 / % of deer photographed = 1 / .89 = 1.12
(4) The extrapolation factor is then multiplied by each number of bucks, does, and fawns determined or calculated in Step 2 above. Their products are the survey length adjusted counts of bucks, does, and fawns, which serve as the final estimated numbers of individuals in the population.
-
Bucks = 31 × 1.12 = 35
-
Does = 62 × 1.12 = 69
-
Fawns = 34 × 1.12 = 38
-
Total deer population = 142
(5) Estimated numbers of individual deer are then used to calculate the following population characteristics.
-
Deer density = total acreage of property / total deer population = 1,000 / 142 = 7 acres per deer
-
Buck to doe ratio = number of does / number of bucks = 69 / 35 = 1:2
-
Fawn crop = number of fawns / number of does = 38 / 69 = 0.550 × 100 = 55%
Data Interpretation
Now that you have successfully photographed the deer herd, analyzed the photographs, and calculated the estimated deer population characteristics for your property or hunting lease, the next step is to interpret the data. Are the survey results in agreement with your deer management objectives for the property? What steps, if any, are required to meet the deer management objectives you have chosen for the property? The following examples demonstrate how estimated population characteristics may be interpreted and used to make deer management recommendations based on hunting club or landowner objectives.
Example 1
Following are the Maroon & White Hunting Club’s post-hunting season camera survey results from the previous page. The property is 1,000 acres, and deer survey numbers have been adjusted for survey length (10 consecutive days) and season.
|
Category |
Number |
|
Total bucks |
35 |
|
Total does |
69 |
|
Total fawns |
38 |
|
Total deer population |
142 |
|
Deer density (acres/deer) |
7 |
|
Buck to doe ratio |
1:2 |
|
Fawn crop (fawn/doe) |
55% |
The hunting club’s objectives:
-
Keep deer numbers in balance with the habitat to maintain quality deer.
-
Maintain high production and harvest of deer each year for recreation.
Based on these survey results, the composition of the deer population is in accordance with the objectives of the hunting club. That is, the ratio of bucks to does is consistent with the objective of producing many deer for harvest. However, their wildlife biologist suggests that a deer density of one per 7 acres is too high to maintain quality habitat on their property. The biologist recommends a deer density in the range of one per 10 to 15 acres to maintain deer productivity and habitat quality. Deteriorating habitat quality from too many deer may explain why the fawn crop is only 55 percent. The biologist explained that a fawn crop of 75 to 125 percent is typical of herds with deer numbers kept in balance with the habitat. Alternatively, the low fawn crop estimate may be a result of coyote and/or bobcat predation. If this is the case, the wildlife biologist should assist the club with strategies for providing more fawning cover.
Example 2
The following results are from a post-hunting season camera survey conducted on a 5,300-acre property. Deer survey numbers have been adjusted for survey length (seven consecutive days) and season.
|
Category |
Number |
|
Total bucks |
97 |
|
Total does |
105 |
|
Total fawns |
92 |
|
Total deer population |
294 |
|
Deer density (acres/deer) |
18 |
|
Buck to doe ratio |
1:1.1 |
|
Fawn crop (fawn/doe) |
88% |
The hunting club’s objectives:
-
Keep deer numbers in balance with the habitat to maintain quality deer.
-
Maintain an even adult sex ratio and buck age structure to maximize production of quality bucks for recreational harvest.
Based on the survey results, the adult sex ratio corresponds with the objectives of the hunting club. The ratio of bucks to does is almost even, which indicates bucks are protected from harvest and are likely living to older age classes. Although the hunters have no actual estimate of buck age structure, they can tell from the photos that many older bucks are in the population. The adult sex ratio is also consistent with the hunting club’s management objective of keeping the deer population in balance with the habitat. A steady harvest of about 70 deer (40 does and 30 bucks) per year should maintain this adult sex ratio and deer density. Their wildlife biologist recommended a deer density of one deer per 15 to 20 acres to optimize deer quality and production and maintain healthy deer habitat. The deer density calculated from the survey matches the biologist’s recommendation.
|
Season |
Camera Density |
5 |
6 |
7 |
8 |
9 |
10 |
11 |
12 |
13 |
14 |
|
fall |
1 to 100 acres |
71% |
75% |
78% |
80% |
83% |
85% |
87% |
89% |
90% |
91% |
|
winter |
1 to 100 acres |
81% |
83% |
85% |
87% |
88% |
89% |
90% |
90% |
90% |
91% |
|
fall |
1 to 200 acres |
40% |
42% |
45% |
47% |
49% |
51% |
52% |
54% |
55% |
56% |
|
winter |
1 to 200 acres |
51% |
54% |
57% |
59% |
61% |
63% |
65% |
67% |
68% |
70% |
|
Season |
Camera Density |
5 |
6 |
7 |
8 |
9 |
10 |
11 |
12 |
13 |
14 |
|
fall |
1 to 100 acres |
1.41 |
1.33 |
1.28 |
1.25 |
1.20 |
1.18 |
1.15 |
1.12 |
1.11 |
1.10 |
|
winter |
1 to 100 acres |
1.23 |
1.20 |
1.18 |
1.15 |
1.14 |
1.12 |
1.11 |
1.11 |
1.11 |
1.10 |
|
fall |
1 to 200 acres |
2.50 |
2.38 |
2.22 |
2.13 |
2.04 |
1.96 |
1.92 |
1.85 |
1.82 |
1.79 |
|
winter |
1 to 200 acres |
1.96 |
1.85 |
1.75 |
1.69 |
1.64 |
1.59 |
1.54 |
1.49 |
1.47 |
1.43 |
Camera Survey Calculation Sheet
Name of property:
Year:
Season (fall/winter):
Acreage surveyed:
Camera density:
Number of survey days:
Deer Counts from Photographs
Total bucks photographed:
Individual bucks identified:
Total does photographed:
Population factor:
Total fawns photographed:
Total unknowns photographed:
Total deer photographed:
Individual Deer Counts
Bucks:
Does:
Fawns:
Unknowns:
Survey Length Adjusted Counts
Total bucks:
Total does:
Total fawns:
Total unknowns:
Total deer population:
Extrapolation factor:
Deer Population Characteristics
Deer density (acres per deer):
Buck to doe ratio:
Fawn crop (fawns per doe):
Digital Camera Census – Field Record Sheet
Pre-bait start:
Survey start:
|
Survey Days and Dates |
|||||||||||||||
|---|---|---|---|---|---|---|---|---|---|---|---|---|---|---|---|
|
Station |
1 |
2 |
3 |
4 |
5 |
6 |
7 |
8 |
9 |
10 |
11 |
12 |
13 |
14 |
Totals |
|
1 |
|||||||||||||||
|
2 |
|||||||||||||||
|
3 |
|||||||||||||||
|
4 |
|||||||||||||||
|
5 |
|||||||||||||||
|
6 |
|||||||||||||||
|
7 |
|||||||||||||||
|
8 |
|||||||||||||||
|
9 |
|||||||||||||||
|
10 |
|||||||||||||||
|
Totals |
|||||||||||||||
The information given here is for educational purposes only. References to commercial products, trade names, or suppliers are made with the understanding that no endorsement is implied and that no discrimination against other products or suppliers is intended.
Publication 2788 (POD-04-23)
By Bill Hamrick, Senior Extension Associate; Bronson Strickland, PhD, Extension Professor; and Steve Demarais, PhD, Professor, Wildlife, Fisheries, and Aquaculture; William McKinley, Deer Enclosure Program Coordinator, Mississippi Department of Wildlife, Fisheries, and Parks; and Bob Griffin, former Instructor, Mississippi State University.
The Mississippi State University Extension Service is working to ensure all web content is accessible to all users. If you need assistance accessing any of our content, please email the webteam or call 662-325-2262.


