Vol. 14, No. 5 / Market Potential for Spotted Seatrout Aquaculture
ABSTRACT
This newsletter summarizes the Spotted seatrout's long-term commercial and recreational landings and dockside values in the United States and major producing states. It attempts to develop an approach to assessing the market potential of Spotted seatrout for aquaculture. The trends in retail markets are compared by major categories. The major determinants of commercial landings and dockside values are identified.
KEYWORDS
Market potential, Spotted seatrout, Marine aquaculture.
ACKNOWLEDGEMENT
This newsletter is a contribution of the Mississippi Agricultural and Forestry Experiment Station and the Mississippi State University Extension Service. This material is based upon work that is supported in part by the National Institute of Food and Agriculture, U.S. Department of Agriculture, Hatch project under accession number 081730, and Mississippi-Alabama Sea Grant Consortium using federal funds under Grant NA24OAR4170090 from the National Sea Grant Office, NOAA, U.S. Dept. of Commerce. The statements, findings, conclusions, and recommendations are those of the author and do not necessarily reflect the views of the National Sea Grant Program, NOAA, U.S. Department of Commerce. This newsletter is a Mississippi-Alabama Sea Grant Publication number MASGP-24-057-05.
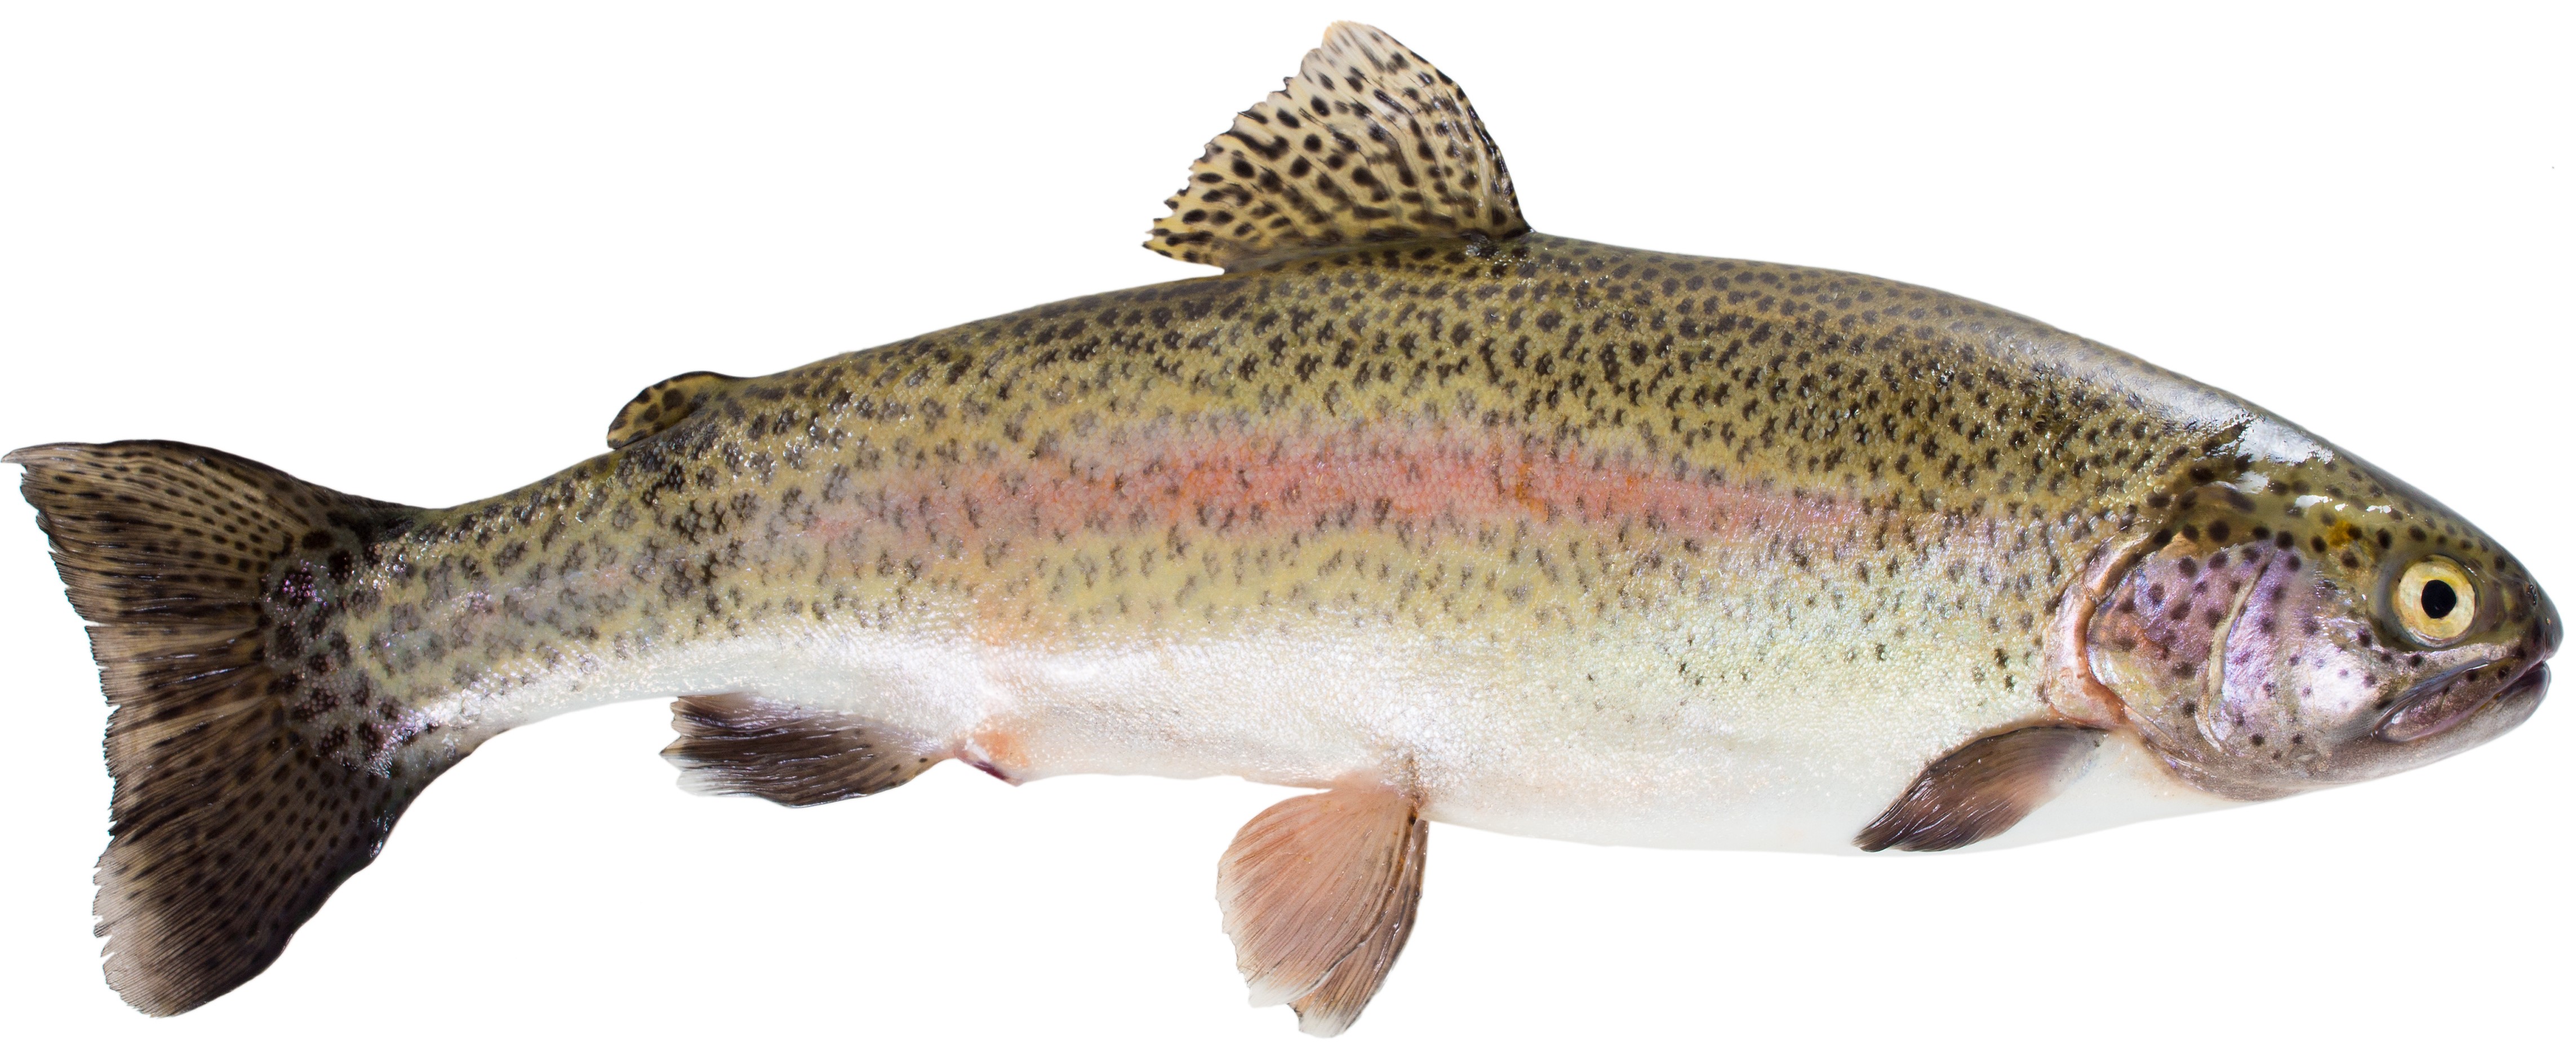
SPOTTED SEATROUT
Scientific name: Cynoscion nebulosus
- Common Names: Speckled Trout, Speck, Yellowmouth
- Size: Typically, 1-3 pounds, fish to 5 pounds are not rare, and occasional fish exceed 10 pounds.
- Food Value: Very good, excellent when not frozen.
- Source: https://www.seagrantfish.lsu.edu/biological/drum/spottedseatrout.htm.
- Management:
- Spotted Seatrouts are managed in each Gulf and South Atlantic state by specific catch/harvest regulations.
- In Mississippi waters, Spotted Seatrout are managed as a single stock. Recreational limits are a minimum total length of 15 inches and 15 fish/person daily possession. The commercial harvest is regulated by a minimum total length of 14 inches and a total allowable catch (TAC) quota of 50,000 pounds per year.
- Source: https://www.usm.edu/fisheries-research-development/spotted-seatrout-tag-release.php.
STATUS OF SPOTTED SEATROUT AQUACULTURE
- Seatrout culture techniques were adapted from red drum (Sciaenops ocellatus) protocols developed in the 1970s. Broodstock husbandry, spawning, and extensive pond-rearing techniques using fertilized and bloomed brackish ponds were well-established by the 1980s.
- By 2018, approximately 80 million 25–30-day old seatrout had been produced, mainly for stock enhancement. Cannibalism and poor nutrition hindered intensive tank culture.
- Between 2005 and 2015, an intensive tank-rearing protocol that reduced cannibalism and intracohort variability and increased average survival to almost 50% was developed using algal concentrate, rotifers, brine shrimp (Artemia sp.), and microencapsulated feeds.
- Preliminary results suggested that a 500 g fish could be produced in approximately 10 months. Nevertheless, interest in commercialization has remained low.
- Zootechnical performance throughout the latter stages of culture, the economics of production, consumer preferences/perceptions, and market capacity must be documented to complete the assessment of the spotted seatrout as a species for commercial aquaculture.
- To further facilitate industry growth, the optimization of aquafeeds specific for seatrout and a domestication program is warranted.
- Source: https://onlinelibrary.wiley.com/doi/10.1111/jwas.12805.
LET US START OUR MODELING EFFORT!
- The commercial and recreational landings and dockside values of Spotted seatrout in the United States since 1950 were compiled from the NOAA Fisheries website.
- Major producing states were identified, and shifts in landings were measured.
- Nominal dockside prices ($/lb) are imputed from commercial landings (lb/yr) and dockside values ($/yr).
- Empirical commercial landings and dockside price models are developed, identifying significant determinants.
U.S. COMMERCIAL AND RECREATIONAL SPOTTED SEATROUT LANDINGS
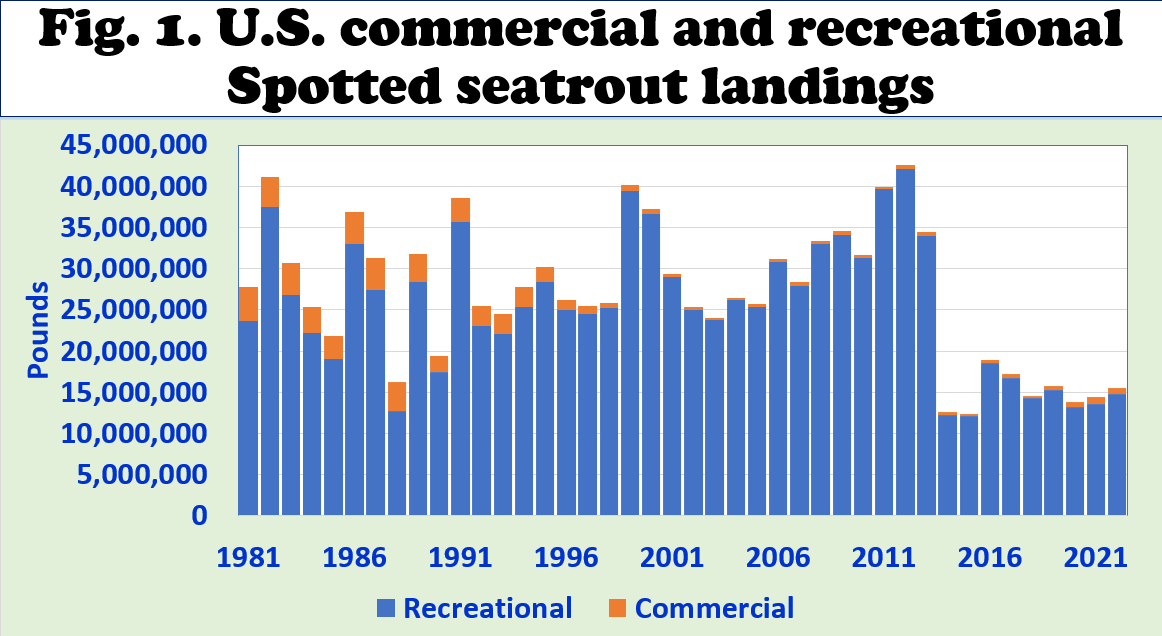
- In Fig. 1, NOAA Fisheries data show commercial and recreational landings of Spotted seatrout in the U.S. since 1981.
- Combined landings peaked in 2012 at more than 42 million pounds.
- Recreational landings contributed to an average of 97% of total landings since 2010.
U.S. COMMERCIAL SPOTTED SEATROUT LANDINGS
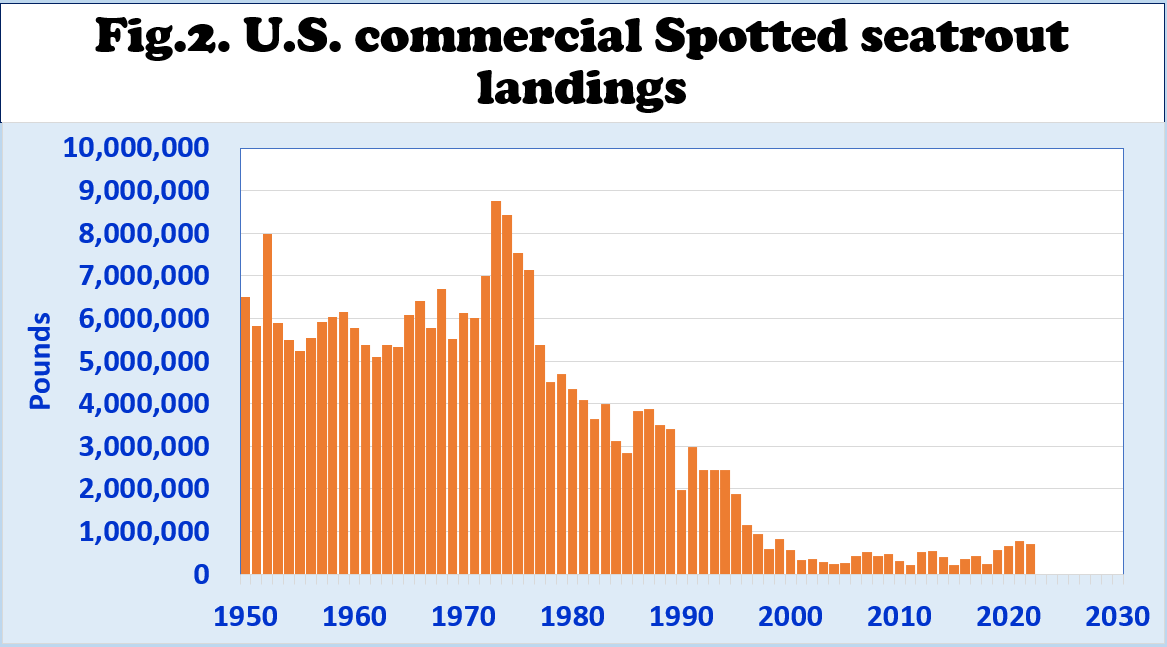
- Fig. 2 shows NOAA Fisheries data on commercial landings of Spotted seatrout in the U.S. since 1950.
- Commercial landings peaked in 1973 at more than 8.7 million pounds and fell after that.
- Commercial landings contributed an average of 3% of total landings since 2010.
- Since 2010, commercial landings have averaged below 500,000 pounds per year.
U.S. COMMERCIAL SPOTTED SEATROUT LANDING VALUES
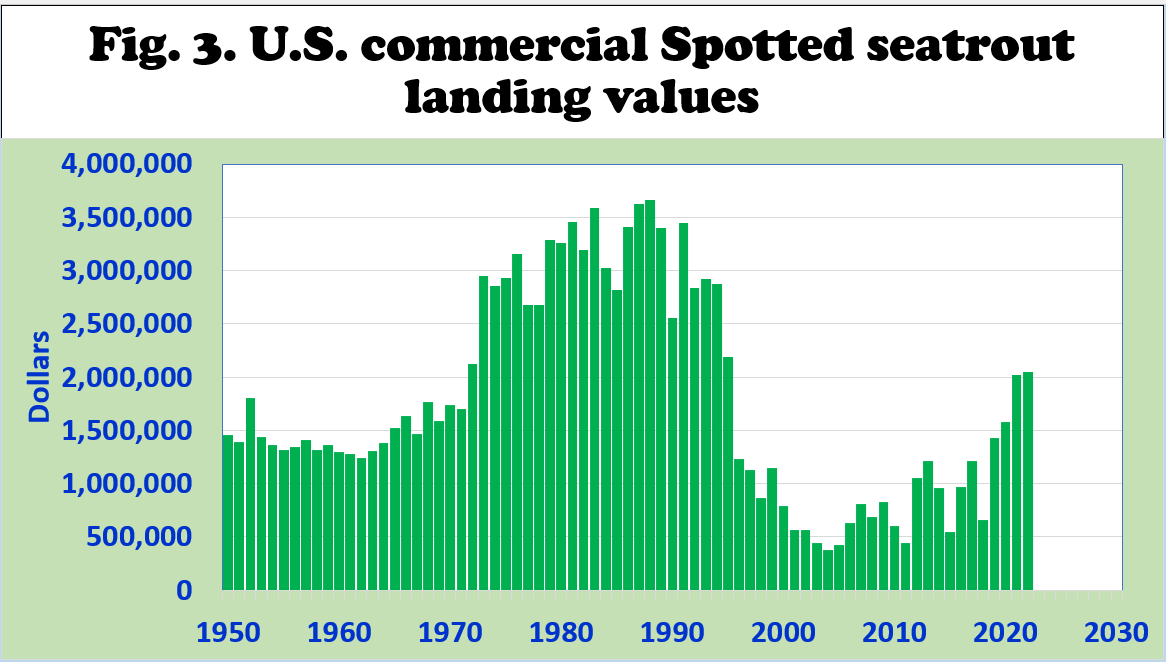
- Fig. 3 shows NOAA Fisheries data on commercial landing values of Spotted seatrouts in the U.S. since 1950.
- Commercial landing values peaked in 1987 at more than 3.6 million dollars and went downhill until 2010.
- Commercial landing values have averaged more than 1.1 million dollars since 2010.
MAJOR U.S. COMMERCIAL SPOTTED SEATROUT PRODUCING STATES
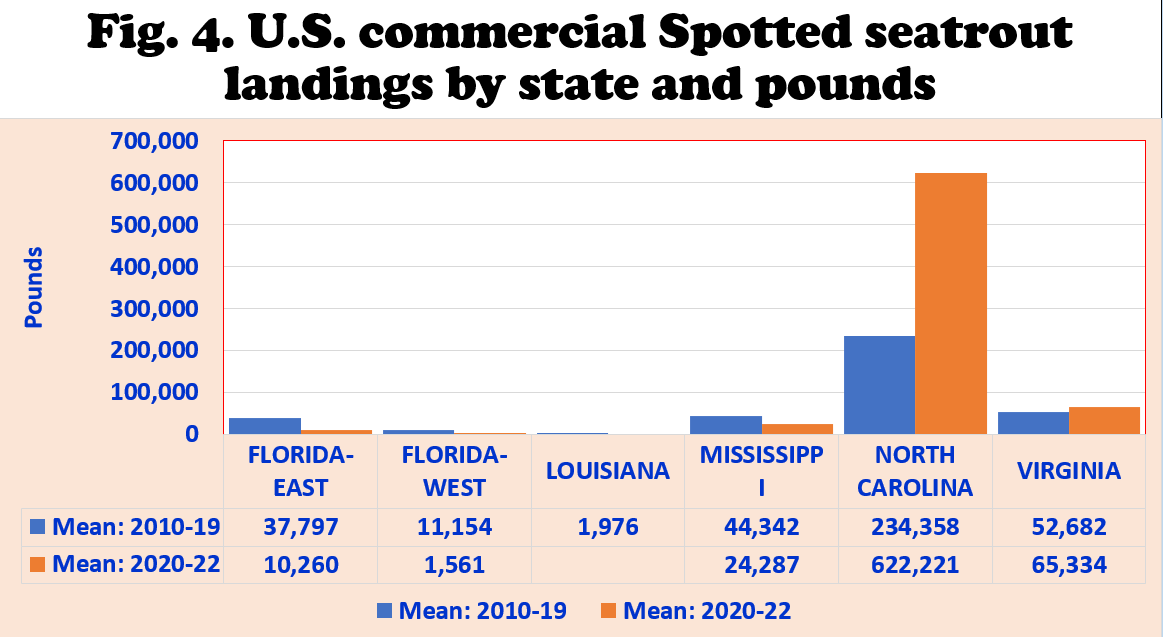
- Fig. 4 shows the major producing states from 2010 to 2022, including North Carolina, Virginia, Mississippi, and Florida East Coast.
- Limited landings were reported in Louisiana, and Florida’s West Coast.
- No recent landings were reported in Louisiana.
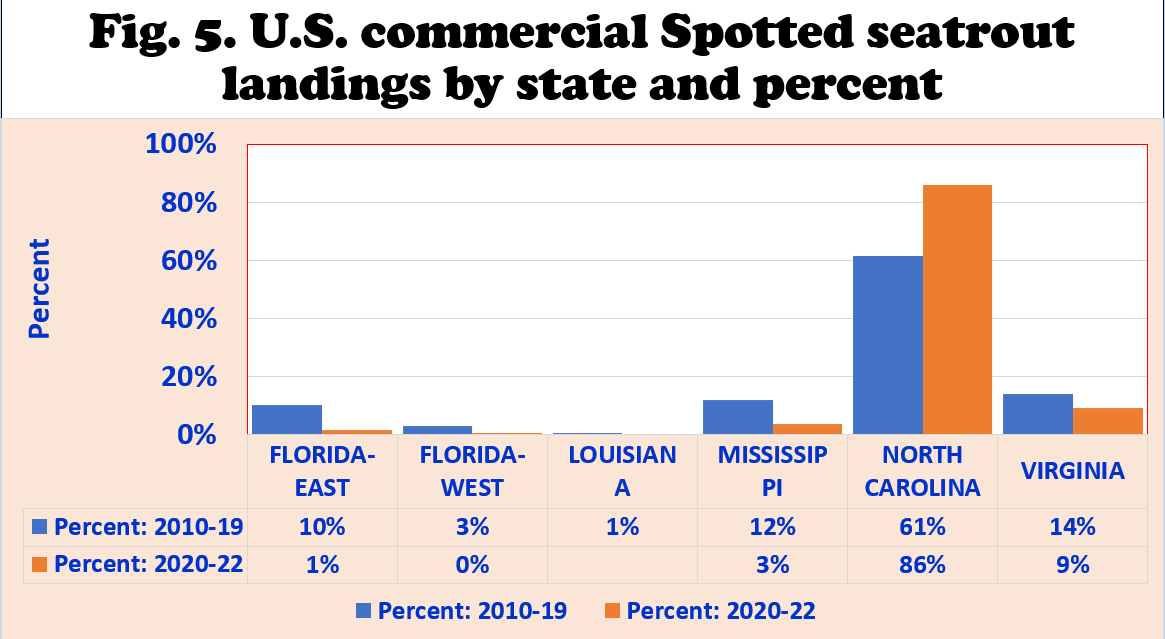
- As Fig. 4 and 5 show, North Carolina produced 234,000 lb/yr from 2010 to 2019. Its share of total U.S. commercial landings rose from 61% in 2010-19 to 86% in 2020-22.
- Virginia landed 52,000 lb/yr in 2010-19. Its share of total U.S. commercial landings fell from 14% in 2010-19 to 9% in 2020-22.
- Mississippi landed 44,000 lb/yr in 2010-19. Its share of total U.S. commercial landings fell from 12% in 2010-19 to 3% in 2020-22.
- Florida East Coast produced 37,000 lb/yr in 2010-19. Its share of total U.S. commercial landings fell from 10% in 2010-19 to 1% in 2020-22.
U.S. RECREATIONAL SPOTTED SEATROUT LANDINGS BY STATE
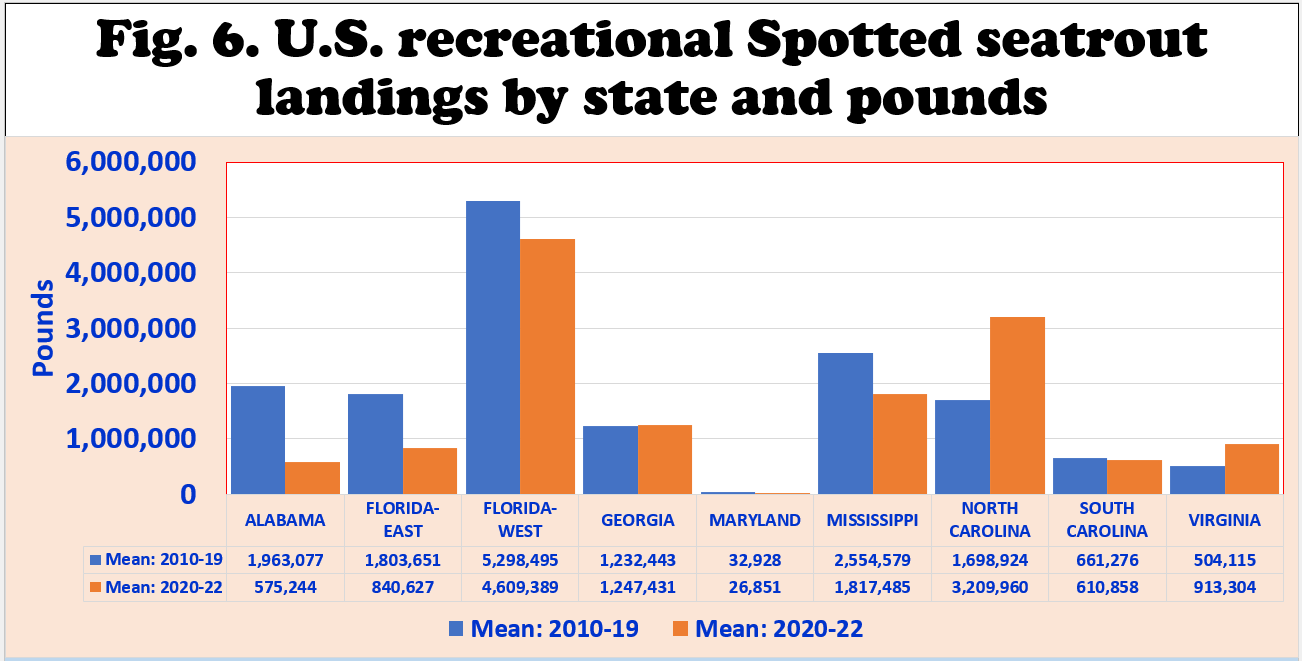
- Fig. 6 shows the major producing states from 2010 to 2022, including Florida’s West Coast, North Carolina, Mississippi, Alabama, and Florida's East Coast.
- No recreational landings were reported in Louisiana since 2014. From 2010 to 2013, however, landings averaged 17 million lb/yr.
- Limited recreational landings were reported in Georgia, Maryland, South Carolina, and Virginia.
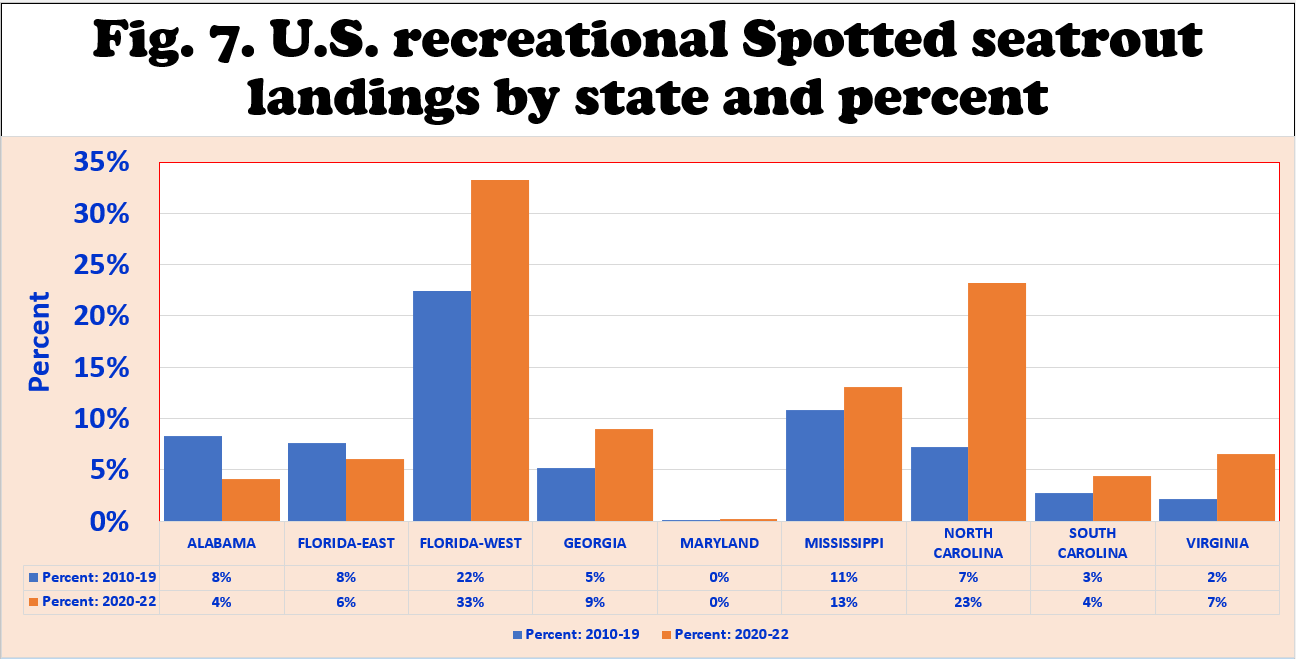
- As Fig. 6 and 7 show, Florida West Coast produced 5.3 million pounds from 2010 to 2019 but fell to 4.6 million lb/yr in 2020-22.
- Mississippi landed 2.5 million lb/yr in 2010-19 but fell to 1.8 million lb/yr in 2020-22.
- Alabama landed 1.9 million lb/yr in 2010-19. Its recreational landings fell to 0.5 million lb/yr in 2020-22.
- Florida East Coast landed 1.8 million lb/yr in 2010-19. Its share of total U.S. recreational landings fell from 8% in 2010-19 to 6% in 2020-22.
- North Carolina landed 1.7 million lb/yr in 2010-19. Its share of total U.S. recreational landings rose from 7% in 2010-19 to 23% in 2020-22.
IMPUTED U.S. COMMERCIAL SPOTTED SEATROUT DOCKSIDE PRICES
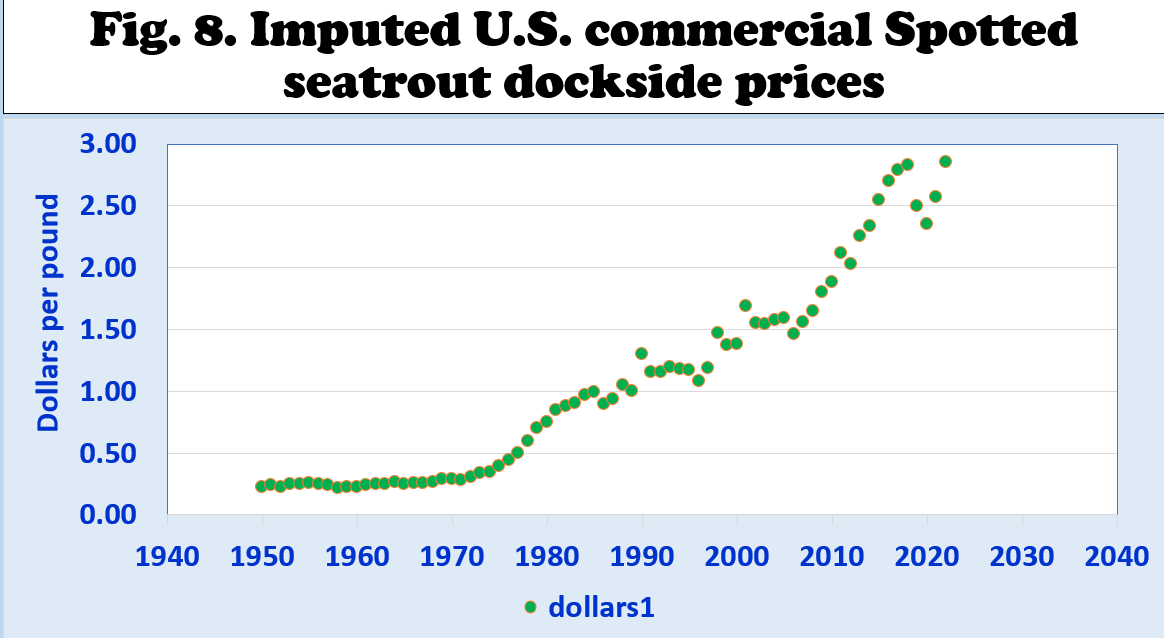
- The imputed dockside prices in the U.S. are shown in Fig. 8.
- U.S. dockside prices have continued to rise and peaked in 2022 at $2.65 per pound.
- Since 2010, the imputed dockside prices averaged $2.44 per lb (standard deviation = 0.31) or a coefficient of variation of 12%.
IMPUTED U.S. COMMERCIAL SPOTTED SEATROUT DOCKSIDE PRICES AND COMMERCIAL LANDINGS
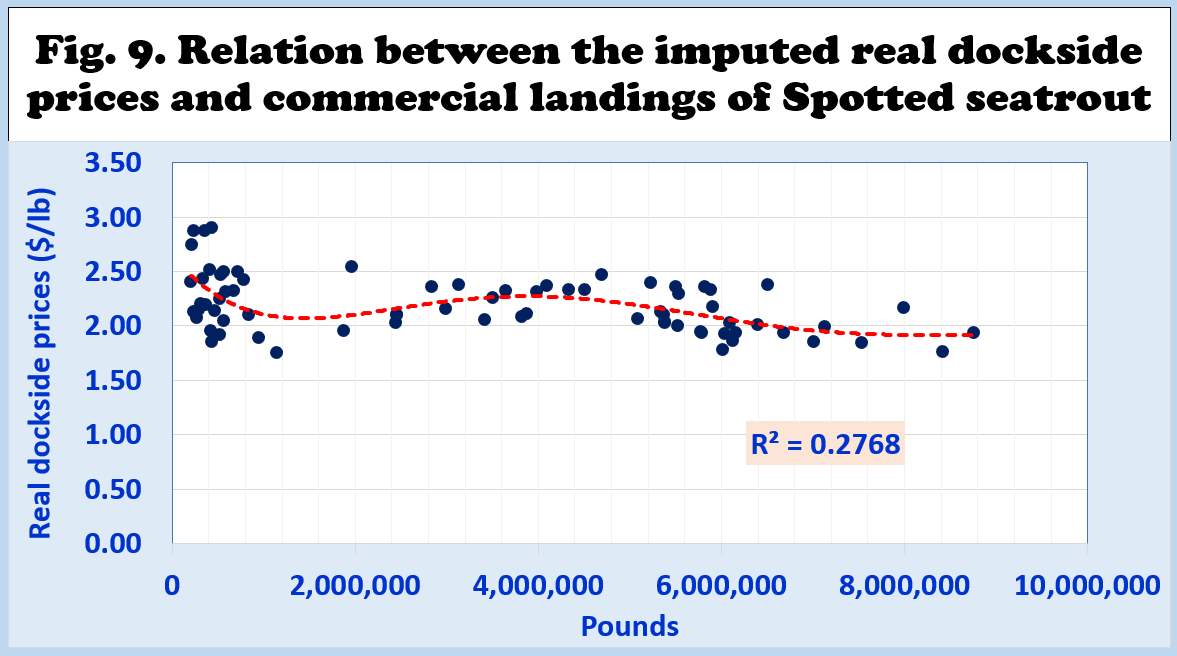
- Fig. 9 shows the empirical relationship between the imputed real dockside prices and commercial landings in the U.S.
- The imputed real dockside prices tended to fall at higher commercial landings.
- When annual commercial landings rose above six million pounds, the imputed real dockside prices tended to flatten out below $2.00 per pound.
U.S. RETAIL SNAPPER MARKET
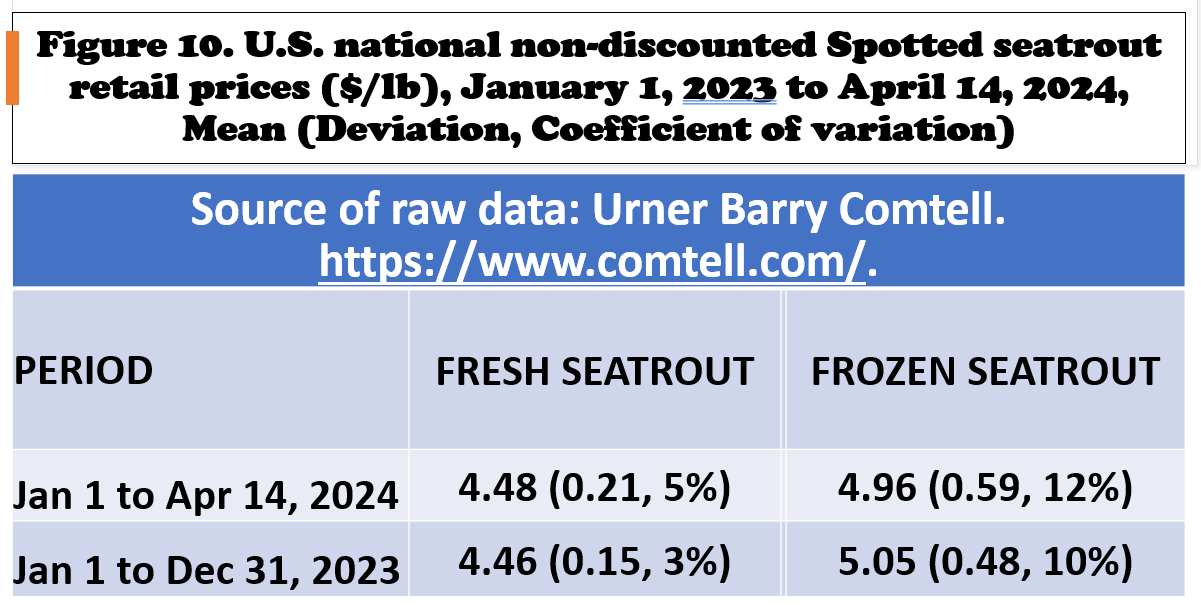
- Fig. 10 shows the average non-discounted retail prices of fresh and frozen Spotted seatrout in the 26 locations monitored by Urner Barry Comtell (UBC).
- The U.S. retail prices compiled from UBC covered the period starting on January 1, 2023, to April 14, 2024.
- There were very wide fluctuations in retail prices among the 26 locations and over time.
- The national average fresh retail prices were lower than the frozen retail prices.
- Frozen retail prices fluctuated more than fresh products.
MARGINAL EFFECTS ON U.S. SPOTTED SEATROUT COMMERCIAL LANDINGS
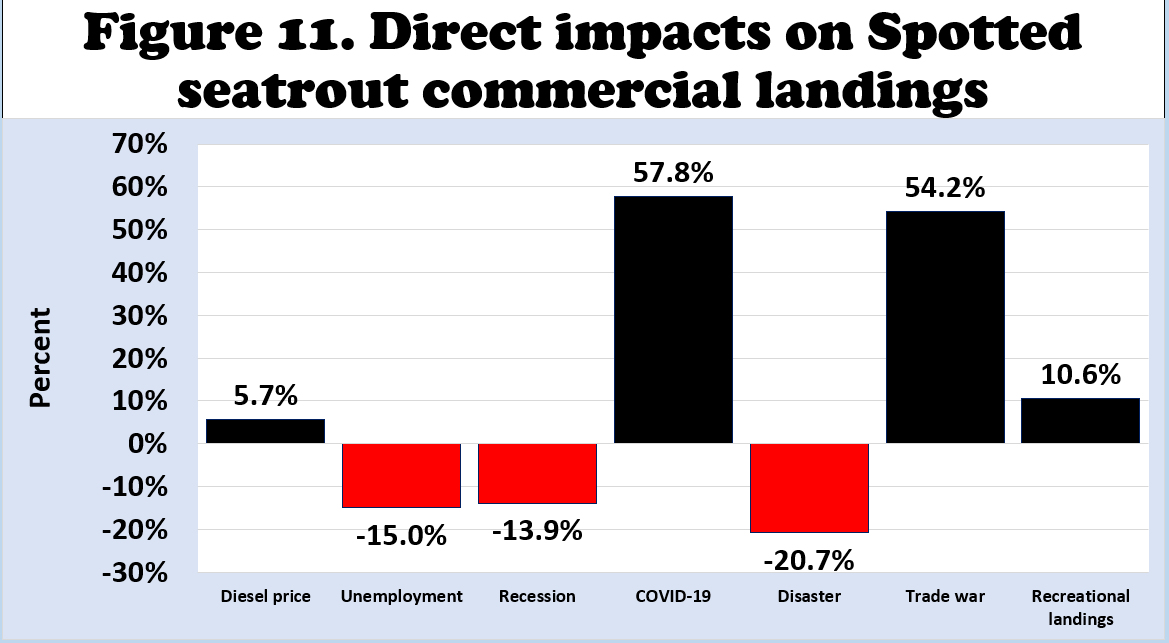
- A significant double-log regression equation was estimated with commercial landings as the dependent variable.
- The addition of diesel prices reduced the number of observations to 28, covering the years from 1995 to 2022.
- The estimated equation explained 42% of the variations in commercial landings.
- There were no independent variables that significantly influenced commercial landings (Fig. 11).
MARGINAL EFFECTS ON U.S. SPOTTED SEATROUT DOCKSIDE VALUES
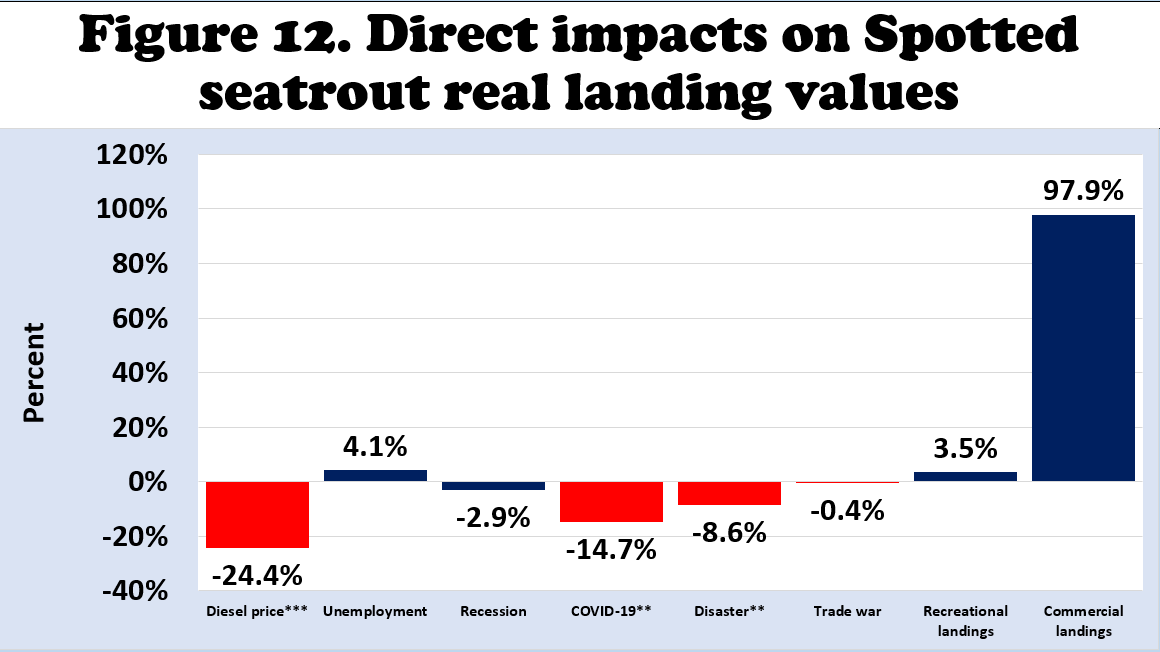
- A significant double-log regression equation was estimated with real landing values as the dependent variable.
- The addition of diesel prices reduced the number of observations to 28, covering the years from 1995 to 2022.
- The estimated equation explained 99% of the variations in commercial landing values.
- Four independent variables significantly influenced commercial landing values.
- Dockside values significantly fell during the following conditions:
- Higher diesel prices,
- occurrence of COVID-19, and
- during disasters.
- Dockside values significantly rose when commercial landings were higher.
MARGINAL EFFECTS ON U.S. SPOTTED SEATROUT REAL DOCKSIDE PRICES
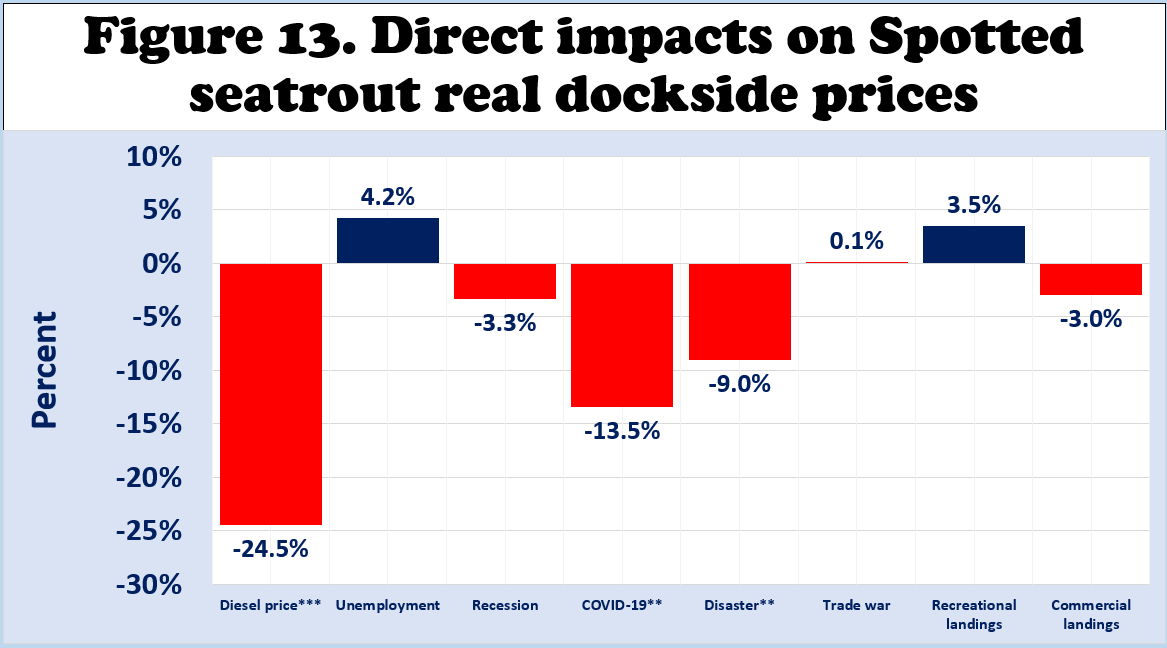
- A significant double-log regression equation was estimated with real dockside prices as the dependent variable.
- The addition of diesel prices reduced the number of observations to 28, covering the years from 1995 to 2022.
- The estimated equation explained 84% of the variations in dockside prices.
- Three independent variables significantly influenced dockside prices.
- Dockside prices significantly fell during the following conditions:
- Higher diesel prices,
- occurrence of COVID-19, and
- during disasters.
MISSISSIPPI SPOTTED SEATROUT COMMERCIAL AND RECREATIONAL LANDINGS
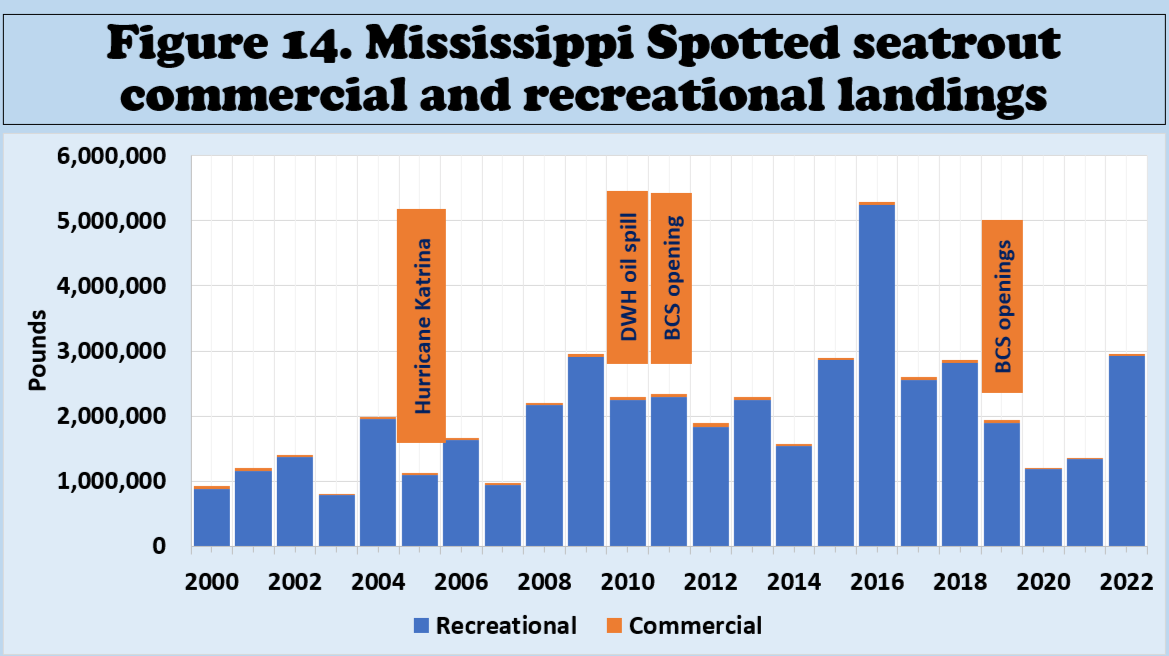
- Fig. 14 shows the annual commercial and recreational landings from 2000 to 2022.
- The occurrence of the disasters in 2005, 2010, 2011, and 2019 seemed to have negative effects on commercial and recreational landings.
- Hurricane Katrina devastated the coast in August 2005.
- The Deepwater Horizon oil spill caused massive fisheries closures in state waters in 2010 and federal waters in 2010 and 2011.
- The prolonged openings of the Bonnet Carre spillway in 2011 and 2019 caused massive freshwater intrusion into the Mississippi Sound and triggered harmful algal blooms.
MISSISSIPPI SPOTTED SEATROUT RECREATIONAL LANDINGS
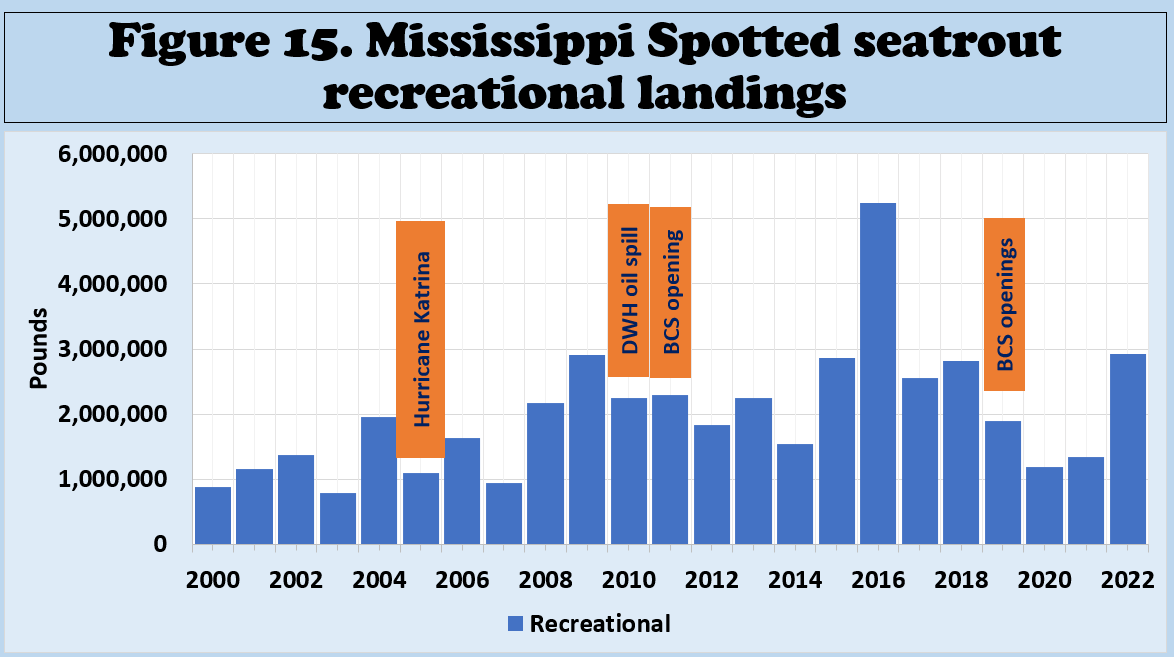
- The disasters in 2005, 2010, 2011, and 2019 seemed to have devastated recreational landings.
- Fig. 15 shows a considerable decline during those disaster years and in the succeeding years after these disasters.
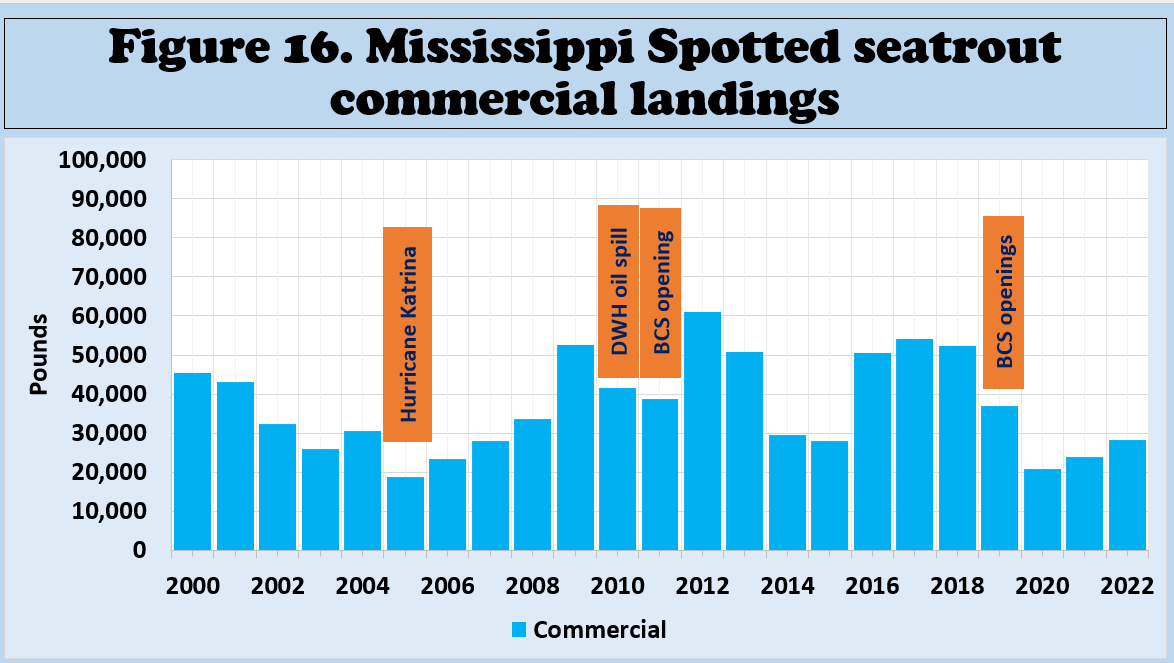
MISSISSIPPI SPOTTED SEATROUT COMMERCIAL LANDINGS
- The disasters in 2005, 2010, 2011, and 2019 seemed to have been devastating to commercial landings.
- Fig. 16 shows a considerable decline during those disaster years and in the succeeding years after the 2019 disaster.
SUMMARY, LIMITATIONS, AND IMPLICATIONS
- Since 2010, U.S. Spotted seatrout commercial landings have averaged less than 500,000 pounds per year, contributing 3% of total landings.
- The major commercial-producing states of Spotted seatrout are North Carolina, Virginia, and Mississippi.
- Since 2010, U.S. Spotted seatrout recreational landings have averaged 21.4 million pounds per year, with recreational landings contributing 97% of total landings.
- Florida West Coast, North Carolina, Mississippi, Alabama, Florida East Coast, and Georgia are the major recreational-producing states of Spotted seatrout.
- U.S. nominal dockside prices have continued to rise and peaked in 2022 at $2.85 per pound.
- The national average fresh retail prices were lower than the frozen retail prices. Frozen retail prices fluctuated more than fresh products.
SUGGESTED CITATION
Posadas, B.C. 2024. Potential U.S. Markets for Spotted Seatrout Aquaculture. Mississippi MarkeMaker Newsletter, Vol. 14, No. 5. Mississippi State University Extension and Mississippi-Alabama Sea Grant Publication number MASGP-24-057-05. (19 pages). May 21, 2024. https://extension.msstate.edu/newsletters/mississippi-marketmaker.
For accessibility assistance please contact Ben Posadas at ben.posadas@msstate.edu


