Vol. 13, No. 6 / The U.S. Trout Aquaculture Industry: Where is it going?
Authors
Your Extension Experts
Related News
June 27, 2014
May 23, 2014
April 4, 2014

Rainbow trout are the most popular and easily reared trout species. They are fast-growing and crowding-tolerant fish, making them well-suited to captive breeding. These trout are widely used worldwide for fish farming and restocking for recreational angling. In the wild, they feed on invertebrates and other fish, but cultured strains do very well on various artificial diets. https://www.agmrc.org/commodities-products/aquaculture/aquaculture-fin-fish-species/trout.
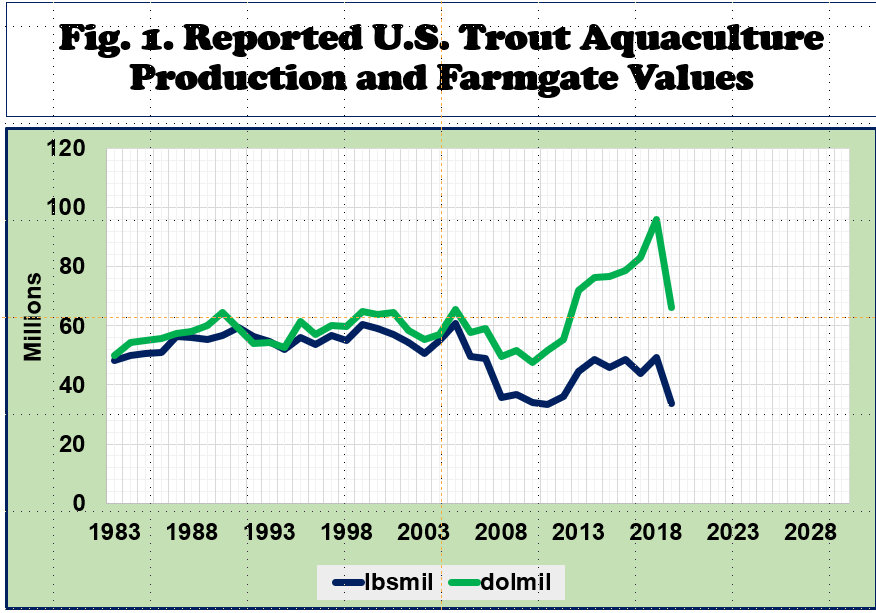
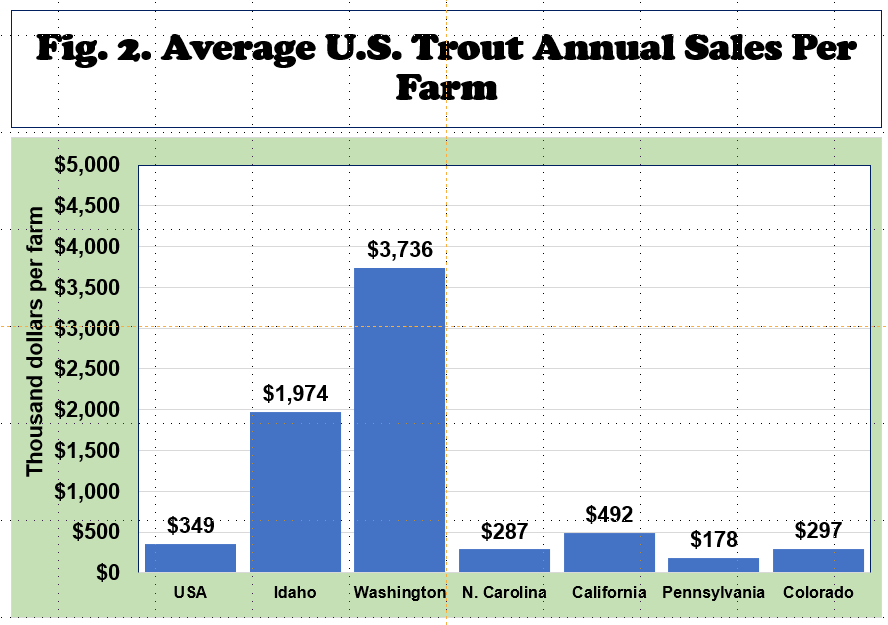

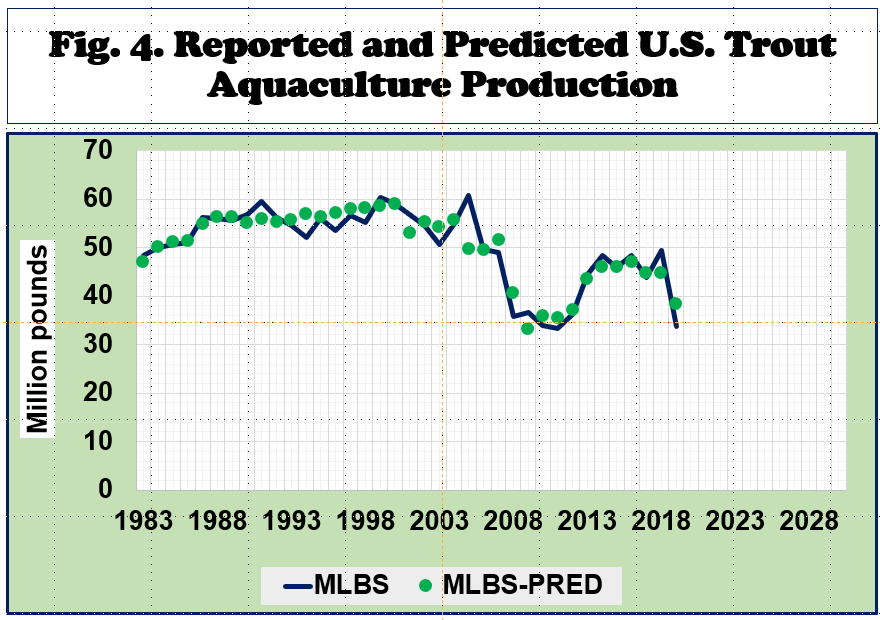
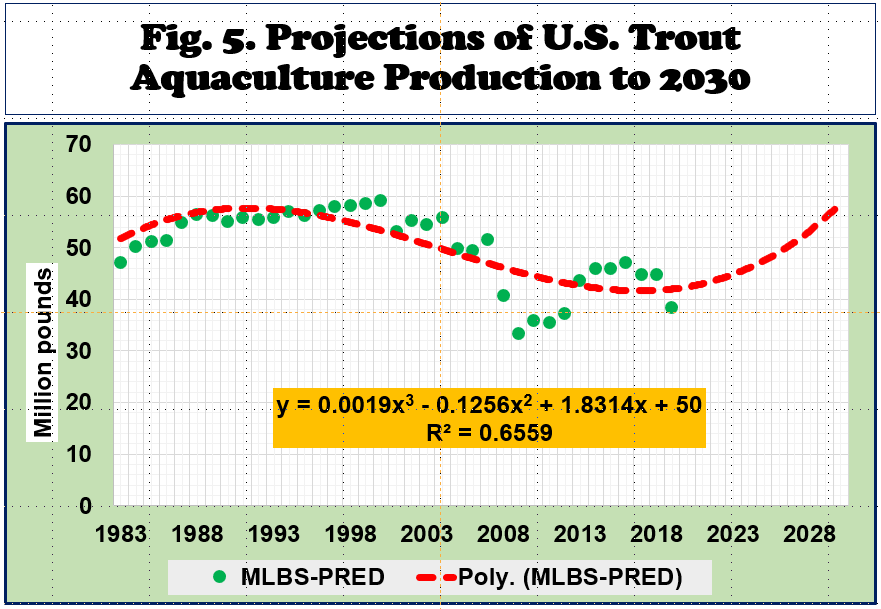
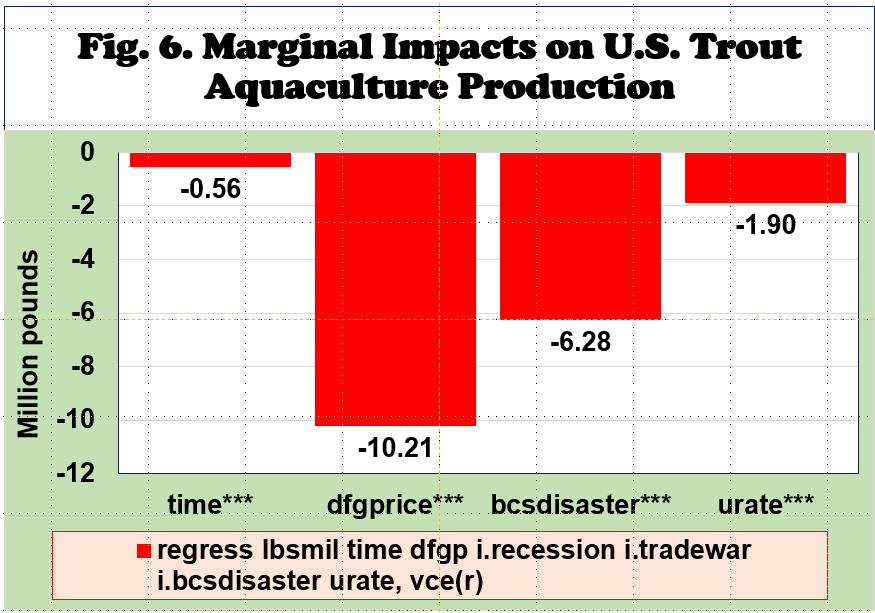
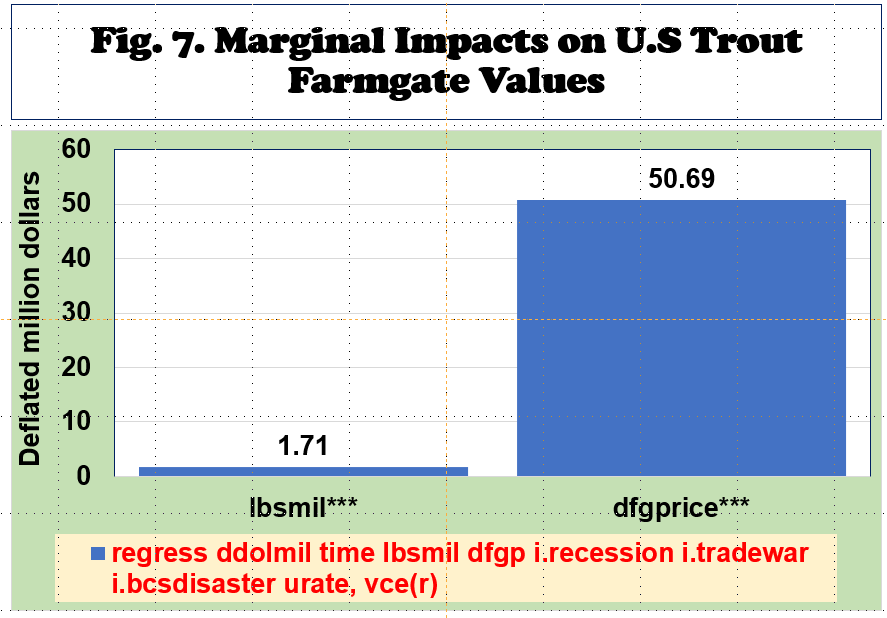
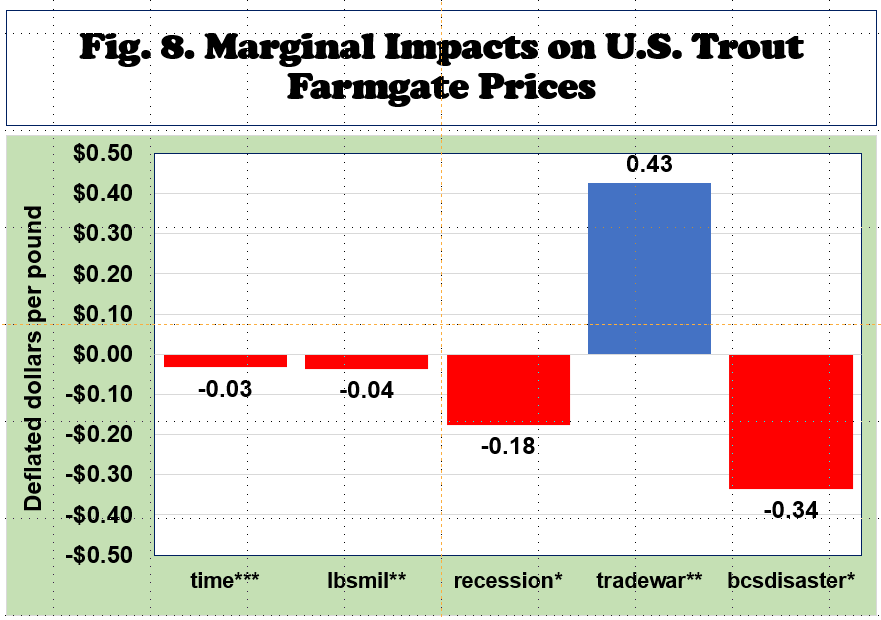
These variables have been shown to exert significant impacts on trout aquaculture production and farmgate values:
However, the magnitude and direction of impacts are still subject to further model development and testing. Compared to three other trout aquaculture data sources, some significant differences are observed.
Data from the Food and Agriculture Organization (FAO-STAT) website are not very different from the data compiled from NOAA Fisheries website. FAO-STAT data on U.S. trout aquaculture started in 1960 while farmgate values started in 1984. While both trout aquaculture production and farmgate value data released by NOAA Fisheries started in 1983 to 2019. I await the updated annual aquaculture production and farmgate values for recent years.
U.S. trout aquaculture data from the U.S. Department of Agriculture (NASS-Quick-Stats) started in 2010 to 2022. Large differences are observed between food-fish-trout sales reported by USDA-NASS and NOAA-Fisheries. The same observations can be made on the trout aquaculture production data.
When compared to the USDA-Aquaculture Census data, the 2013 and 2018 trout aquaculture sales data compiled from the NOAA Fisheries data are significantly lower. The 2013 USDA aquaculture census data on total trout sales are 53% higher than the 2013 NOAA Fisheries data on trout farmgate value. The 2018 USDA aquaculture census data on total trout sales are 22% higher than the 2018 NOAA Fisheries data on trout farmgate value.
In the meantime, I decided to use the NOAA Fisheries trout aquaculture data since the period covered started in 1983 to 2019. Similar graphical trends are noticeable despite the size differences since 2010.
Posadas, B.C. 2023. The U.S. Trout Aquaculture Industry: Where is it Going? Mississippi MarketMaker Newsletter, Vol. 13, No. 6. Mississippi State University Extension Service. June 8. https://extension.msstate.edu/newsletters/mississippi-marketmaker.
For accessibility assistance please contact Ben Posadas at ben.posadas@msstate.edu