Vol. 13, No. 4 / The U.S. Hybrid Striped Aquaculture Industry Slowed During The Past Decade
Abstract
- This newsletter shows the overall trends in U.S. hybrid striped bass aquaculture production and farmgate values.
- U.S. hybrid striped bass aquaculture data are available from 1987 to 2019. The 2019 values are the same as in 2018.
- A scatter diagram shows the relationship between U.S. hybrid striped bass aquaculture production and deflated farmgate prices.
- Econometric models are estimated to determine significant determinants of production, and farmgate values and prices.
Acknowledgement
- This virtual presentation is a contribution of the Mississippi Agricultural and Forestry Experiment Station and the Mississippi State University Extension Service.
- This material is based upon work that is supported in part by the National Institute of Food and Agriculture, U.S. Department of Agriculture, Hatch project under accession number 081730 and
- NOAA (Office of Sea Grant, U.S. Dept. of Commerce, under Grant NA22OAR4170090, Mississippi Alabama Sea Grant Consortium).
Keywords
- Aquaculture production
- Deflated farmgate value
- Deflated farmgate prices
Let Us Start Our Modeling Effort!
- The NOAA Fisheries data on hybrid striped bass (HSB) aquaculture production are reported in pounds and dollars per year, respectively.
- U.S. HSB aquaculture data are available from 1987 to 2019. The 2019 values are the same as in 2018.
- Dockside prices (IDSP) are imputed from dockside values and commercial landings.
- Farmgate prices (IFGP) are imputed from farmgate values and annual production.
- A scatter diagram shows the relationship between U.S. HSB aquaculture production and deflated farmgate prices (DIFGP).
- Econometric models are estimated to determine significant determinants of production, and farmgate values and prices.
U.S. Aquaculture Economic Models
- The Ordinary Least Squares (OLS) models of U.S. aquaculture consisted of the following dependent variables:
- Aquaculture production (lb/yr)
- Deflated farmgate value ($/yr)
- Deflated farmgate prices ($/lb)
- The OLS models of U.S. aquaculture were estimated using the robust variance procedure of STATA-16.
- The variation inflation factor was calculated to detect the possible presence of multicollinearity.
- The marginal impacts of disaster events were computed using the margins procedure.
U.S. Aquaculture Production Economic Model
- The OLS model of U.S aquaculture production (lb/yr) assumed that annual production could be explained by the following:
- year
- deflated farmgate and dockside prices ($/lb)
- recession, trade war, pandemic, and Gulf natural disasters (1 or 0)
- unemployment rate and growth in per capita disposable income (%)
- other variables
U.S. Aquaculture Farmgate Values Economic Model
- The OLS model of U.S. aquaculture farmgate values ($/yr) assumed that annual production could be explained by the following:
- year
- aquaculture production (lb/yr)
- deflated farmgate price and dockside prices ($/lb)
- unemployment rate and growth in per capita disposable income (%)
- recession, trade war, pandemic, and Gulf natural disasters (1 or 0)
- other variables
U.S. Aquaculture Farmgate Price Model
- The OLS model of U.S. aquaculture farmgate prices ($/lb) assumed that annual production could be explained by the following:
- year
- aquaculture production (lb/yr)
- deflated dockside prices ($/lb)
- unemployment rate and growth in per capita disposable income (%)
- recession, trade war, pandemic, and Gulf natural disasters (1 or 0)
- other variables
U.S. Hybrid Striped Bass Aquaculure Producers
- The U.S. Aquaculture Census estimated that HSB farms numbered 68 farms in 2013 and 62 farms in 2018.
- Total sales reached $50.8 M in 2013 and $34.9 M in 2018.
- In number of farms, the top three HSB farming states in 2018 are North Carolina (14 farms), Illinois (7 farms), and Ohio (6 farms).
- Annual sales reported during aquaculture census were 1.06 times more than the reported annual sales by NOAA Fisheries in 2018 and 1.45 times more in 2013.
U.S. Hybrid Striped Bass Aquaculture Production
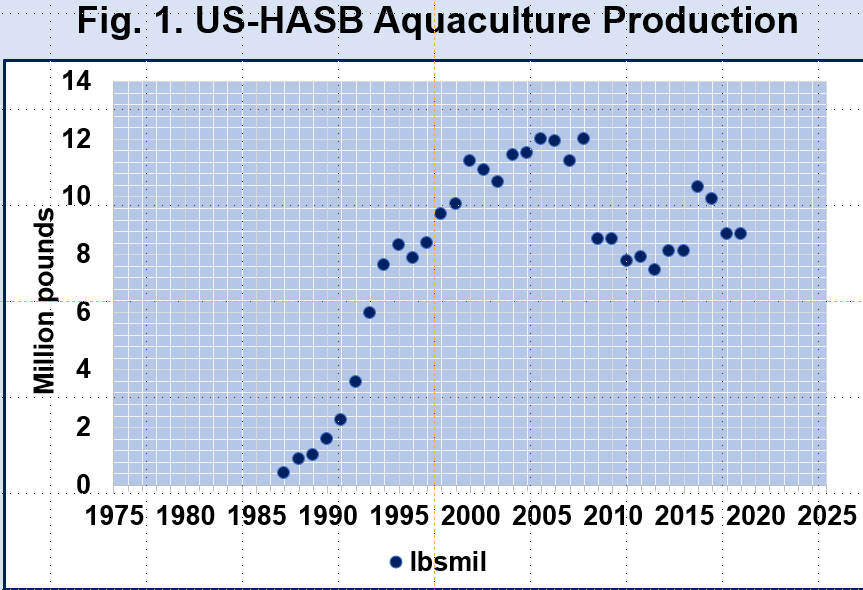
- The annual HSB aquaculture production since 1987 are shown in Fig. 1.
- The blue dots show the annual HSB aquaculture production reported from 1987 to 2019.
- The 2019 values, however, are the same as in 2018.
- Annual HSB production seems to have declined during the past decade as compared to the previous decade.
U.S. Hybrid Striped Bass Aquaculture Farmgate Values
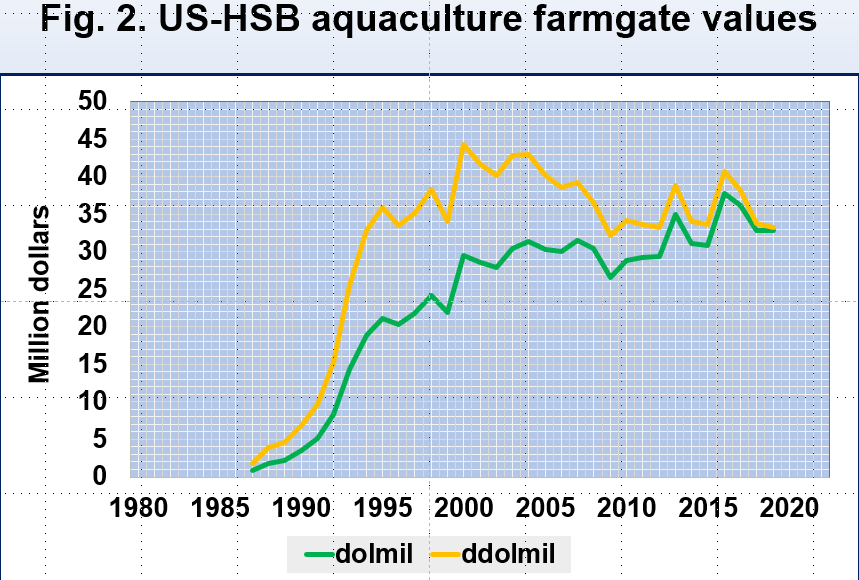
- Annual HSB aquaculture farmgate values since 1987 are shown in Fig. 2.
- The green curve shows annual HSB farmgate values reported from 1987 to 2019.
- The yellow curve shows annual HSB deflated farmgate values reported from 1987 to 2019.
U.S. Hybrid Striped Bass Aquaculture Farmgate Prices
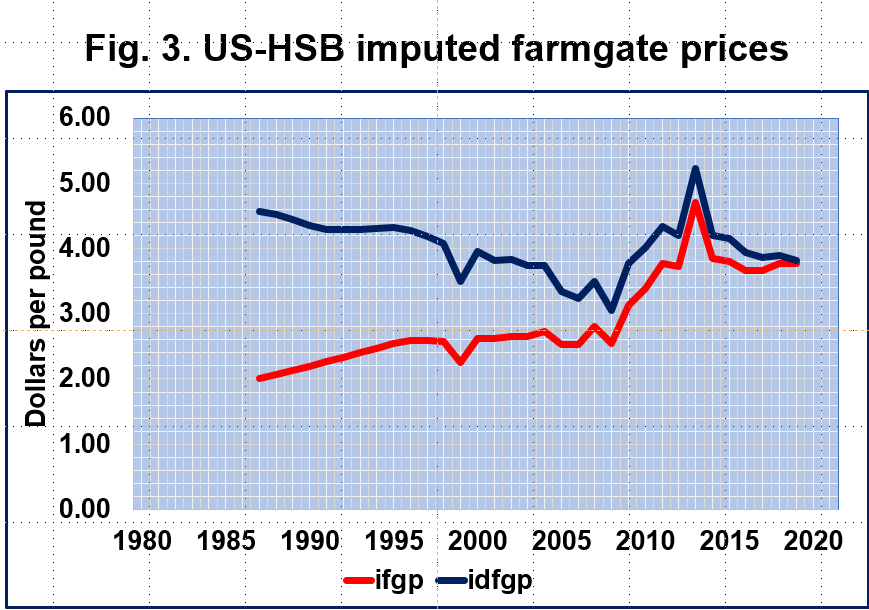
- The annual HSB imputed farmgate prices (IFGP) from 1987 to 2019 are shown in Fig. 3.
- The red curve (IFGP) shows the annual HSB imputed farmgate prices.
- The blue curve (DIFGP) shows the annual HSB deflated imputed farmgate prices.
U.S. Hybrid Striped Bass Aquaculture Production and Farmgate Prices
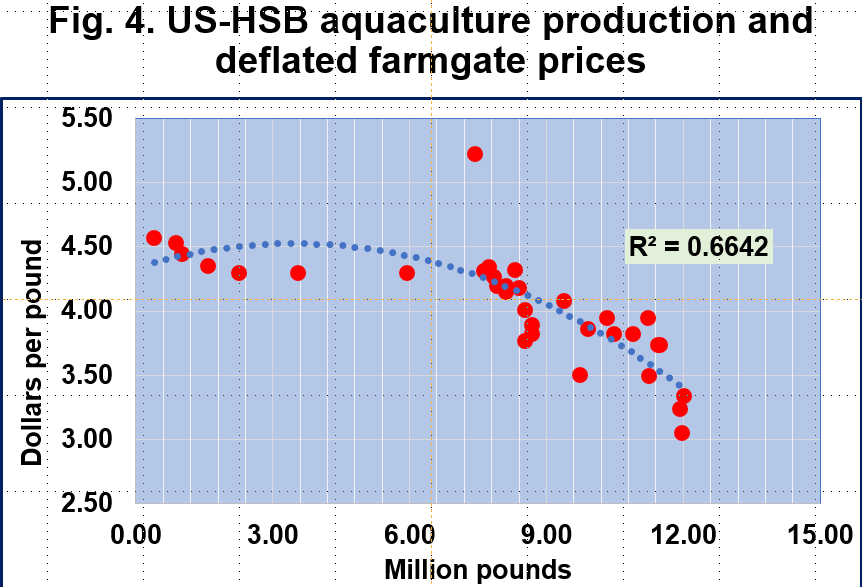
- The scatter diagram between the annual HSB production and deflated HSB farmgate prices is shown in Fig. 4 with an R-squared = 0.66.
- The red dots are the deflated HSB farmgate prices at various levels of HSB production from 1987 to 2019.
- The blue dotted curve is the Excel-generated polynomial equation of deflated HSB farmgate prices at various levels of HSB production.
- It seemed that lower deflated farmgate prices were observed at higher levels of production during the past four decades.
U.S. Hybrid Striped Bass Imputed Farmgate Prices and Striped Bass Dockside Prices
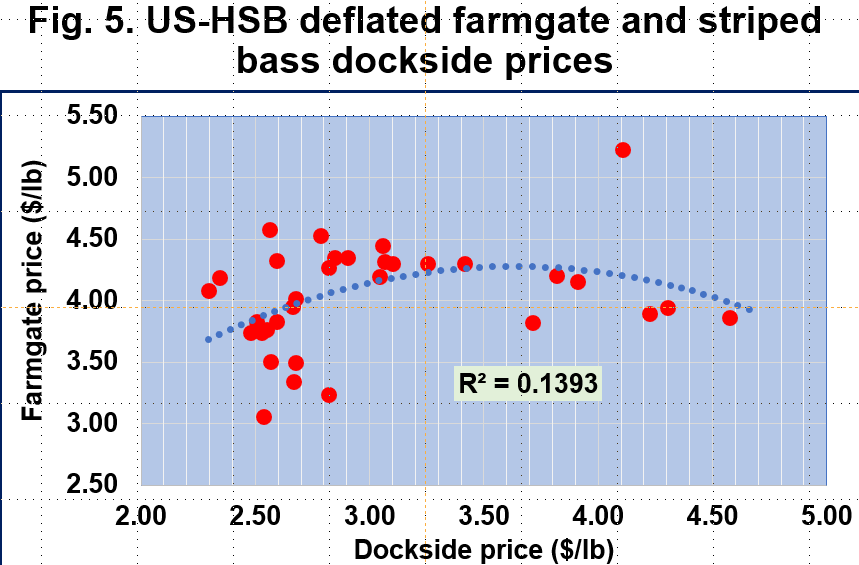
- The scatter diagram between the HSB farmgate prices and striped bass (SB) commercial landing dockside prices is shown in Fig. 5 with an R-squared = 0.13.
- The red dots are the deflated farmgate prices at various dockside prices of SB commercial landings from 1987 to 2019.
- The blue dotted curve is the Excel-generated polynomial equation of deflated farmgate prices at various dockside prices.
- It seems that was no significant relationship between the imputed aquaculture farmgate and commercial landings dockside prices.
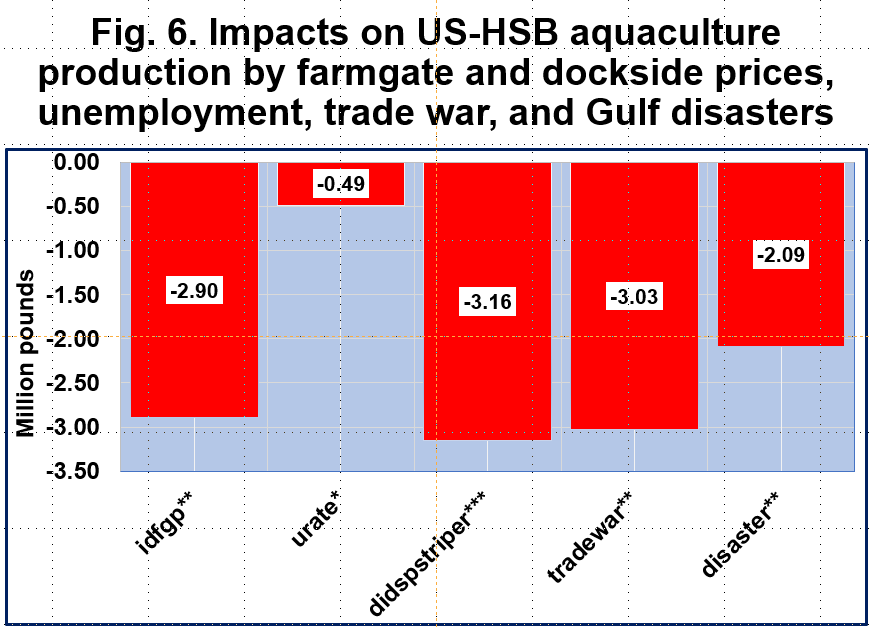
Impacts on U.S. Hybrid Striped Bass Aquaculture Production by Imputed Farmgate and Dockside Prices, Unemployment, Trade War, and Gulf Disasters
- The estimated OLS equation for HSB aquaculture production is statistically significant and have an R-squared = 0.84 (Fig. 5).
- There is a significant inverse relationship between HSB deflated farmgate price and HSB production (-2.90).
- There is also a strong indirect relationship between deflated dockside prices of striped bass (SB) and HSB production (-3.16).
- Higher unemployment rates tend to reduce HSB aquaculture production (-0.49).
- The US-China trade war tends to adversely affect HSB aquaculture production (-3.03).
- Gulf natural disasters seem to discourage HSB aquaculture production (-2.09).
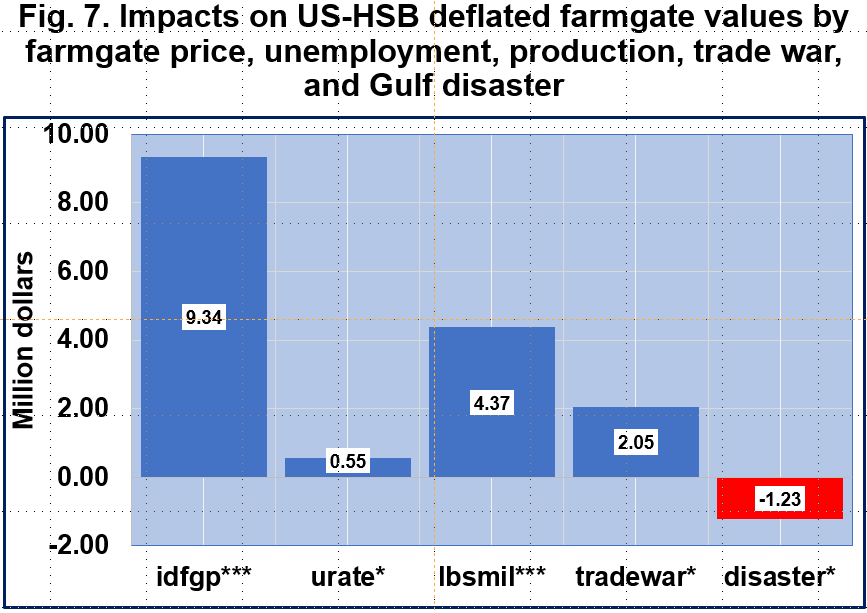
Impacts on US-HSB Deflated Farmgate Values Imputed Farmgate Prices, Unemployment, Production, Trade War, and Gulf Disasters
- The estimated OLS equation for HSB deflated farmgate values is statistically significant and have an R-squared = 0.99.
- Higher HSB deflated farmgate prices (+9.34) seem to have significantly improved deflated HSB farmgate values (Fig. 7).
- Higher unemployment rates seem to have slightly enhanced HSB deflated farmgate values (+0.55).
- More domestic HSB aquaculture production (+4.37) tends to have strongly improved deflated HSB farmgate values.
- The occurrence of trade war seems to have enhanced HSB farmgate values (+2.05).
- Gulf disasters appear to have diminished HSB deflated farmgate values (-1.23).
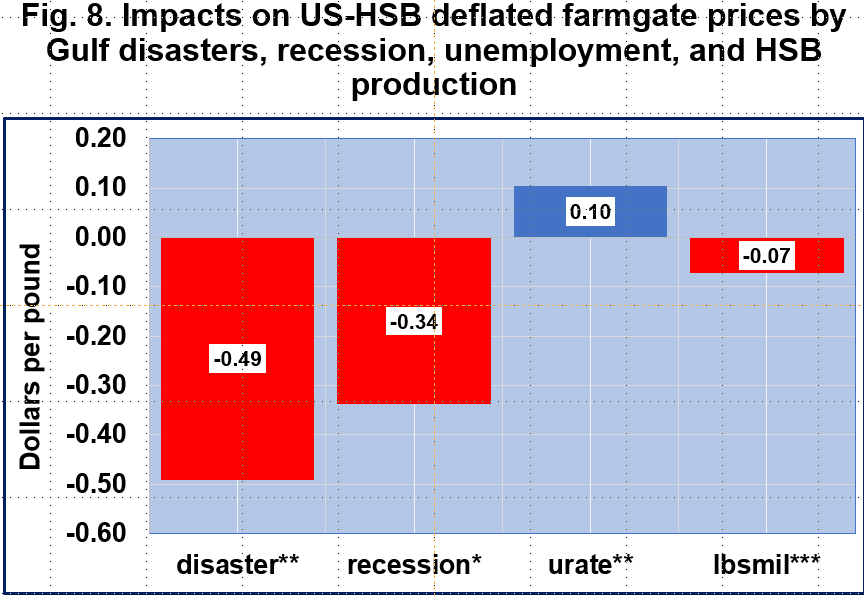
Impacts on U.S. Hybrid Striped Bass Deflated Farmgate Prices By Recession, Unemployment, and HSB Production
- The estimated OLS equation for HSB deflated farmgate prices is statistically significant and have an R-squared = 0.74 (Fig. 8).
- Gulf disasters dampen HSB deflated farmgate prices (-0.49).
- Recessions diminish HSB deflated farmgate prices (-0.34).
- Higher unemployment rates enhance HSB deflated farmgate prices (+0.10).
- Higher HSB production dampens HSB deflated farmgate prices (-0.07).
Summary
- Higher HSB production dampened HSB deflated farmgate prices.
- Higher deflated dockside prices of striped bass commercial landings discouraged HSB production.
- Higher HSB deflated farmgate prices significantly improved deflated HSB farmgate values.
- The US-China trade war adversely affected HSB aquaculture production but enhanced HSB deflated farmgate values.
- Gulf disasters discouraged HSB aquaculture production, and diminished deflated farmgate values and prices.
- Higher unemployment rates slightly enhanced HSB deflated farmgate values and prices.
- Recessions diminished HSB deflated farmgate prices.
My Catfish Economics Outreach
Posadas, B.C. 2023b. The U.S Hybrid Striped Aquaculture Industry Slowed during the past Decade. Mississippi MarketMaker Newsletter, Vol. 13, No. 4. April 13, 2023. http://extension.msstate.edu/newsletters/mississippimarketmaker.
Posadas, B.C. 2023a. U.S Hybrid Striped Aquaculture Industry. HME Outreach. MSU-CREC, Virtual presentation. (April 4). https://youtu.be/ZDxRckJlu98
Posadas, B.C. 2020. U.S. Striped Bass Dockside and Aquaculture Farmgate Values. Mississippi MarketMaker Newsletter, Vol. 10, No. 10. http://extension.msstate.edu/newsletters/mississippi-marketmaker/2020/vol-10-no-10-us-striped-bass-dockside-and-aquaculture-farm.
Suggested Citation
Posadas, B.C. 2023. The U.S Hybrid Striped Aquaculture Industry Slowed during the past Decade. Mississippi MarketMaker Newsletter, Vol. 13, No. 4. Mississippi State University Extension Service. (April 13). https://extension.msstate.edu/newsletters/mississippi-marketmaker.


