
Using Online Surveys to Collect Data for Farmers Markets
Click here for a video tutorial on how to create a survey using Google Forms.
Why Is It Important for Farmers Markets to Collect Data?
Data collected from the operations of a farmers market can provide valuable information for both vendors and customers. Insight from this information is essential to improve vendor communication with customers, streamline communication with community partners, improve market operations, apply for grants, and show the economic impact of the market to foster support from the community.
In this publication, we will focus on customer surveys. Customer surveys are important to gauge customer satisfaction and gather suggestions for improvement. In addition, managers can gain insight about customer motivation for visiting the market, products desired by customers, and how to reach and communicate with customers. We will discuss an easy way to develop and distribute online surveys using free, user-friendly tools. Online surveys and quick response (QR) codes can facilitate collecting point-in-time feedback from farmers market customers and increase response rates.
There are different types of surveys that can be used to collect consumer feedback, depending on the type of information needed. Two of the most common type of surveys are a recent visit survey and a general survey. A recent visit survey is geared toward understanding customers’ experience and evaluating customer satisfaction. Recent visit surveys could cover:
- Rating of the shopping experience
- Rating of the overall visit
- How much money was spent at the market during the visit
- What products were purchased during the visit (fresh produce, flowers, herbs, homemade baked or processed food, etc.)
- Likelihood to visit and shop at the farmers market again
- Consumer demographics
A general survey may cover a wider range of questions, but the focus is to learn why or how consumers use the farmers market. General surveys could include questions covering the following:
- Most convenient time for consumers to visit the farmers market
- How often they shop at farmers markets
- What products they would like to be available at the farmers market (fresh produce, flowers, herbs, artisan baked or processed food, eggs, meats, etc.)
- Other services they would like to be provided (parking, benches, live music, etc.)
- How they learned about the farmers market or specific vendors
- Consumer demographics.
Regardless of the survey type that is used, there are a few basic guidelines to follow when collecting survey data:
- Keep it short. Be concise and avoid unnecessary questions. Only ask for information needed for the project, and not information that would be nice to have.
- Ask straightforward questions. Try to avoid questions requiring respondents to type in answers (open-ended questions) when possible. Closed-ended questions, such as multiple choice or check boxes, are preferable.
- Do not use loaded or misleading questions.
Developing an Online Survey Using Google Forms
Create the Survey
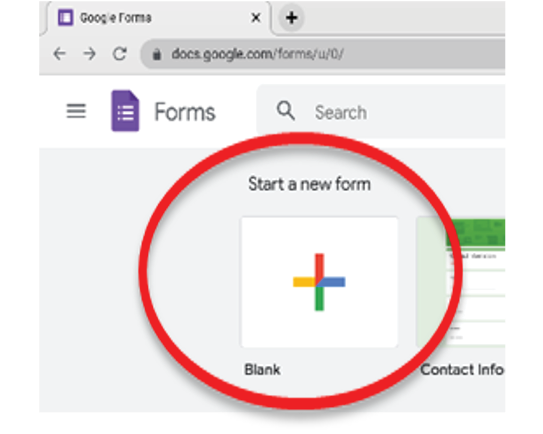
Google Forms is an easy way to survey customers. However, note that this free option requires surveyors to have an active Google account. As shown in Figure 1, select the option to create a new form.
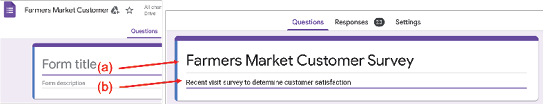
The next step is to title your survey (Figure 2a) and add a short description (Figure 2b) of what the survey is about. While a description is optional, it is the first thing respondents notice when they open the survey, and will give them an overview of what the survey is about.
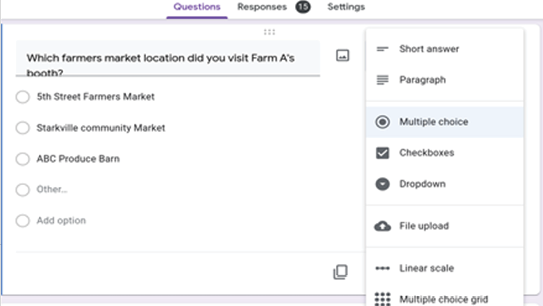
After titling and describing your Google Forms survey, you can enter the questions. To the right of each new question, Google shares a recommended response type, which can be changed by clicking on the response type option. This tool provides the option to include open-ended responses or a list of different closed-ended response options such as multiple choice, checkboxes, linear scale, date/time, etc. (Figure 3).
Examples
Some examples of closed-ended questions include:
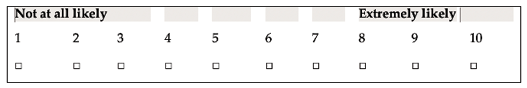
- Linear scale:
Would you recommend this market to a friend or colleague?

- Checkboxes:
What did you buy at the market today? (Select all that apply.)
Fruit
Vegetables
Flowers
Baked goods
Processed foods (jams, jellies, pickled produce, etc.)
Arts and crafts
Other_______________________________
An example of an open-ended question where respondents type out their response could be:
What amenities would you like to see added to the farmers market operations in your community?
Try to put the open-ended questions at the end of the survey. You can always add, edit, or remove questions or responses as you further develop the survey for distribution.
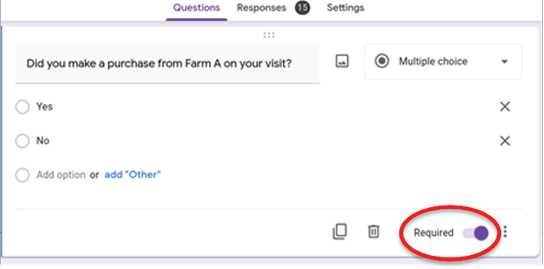
Google Forms has the option to make questions required. This option means that the respondents must answer the required question before the survey can be submitted (Figure 4). While you can make all questions required, a good rule of thumb is to apply it to questions where you are sure the responses will apply to all potential respondents.
Otherwise, add an option for respondents to say that it is not applicable. This option can be added to all question types, whether they are open-ended, checkbox, multiple-choice, or other. Keep in mind that a drawback to employing this feature is that some customers may not want to answer a required question, and will opt out from the entire survey.
Distribute the Survey
Different strategies can be used to distribute a survey created in Google Forms. Digital distribution of the survey can be done by emailing a link or QR code, leaving a link on the official website, or sharing the link via social media (Figure 5). Creating a QR code for a survey makes it easy to be scanned from anywhere—market stall signs, business contact cards, or even other phone screens. To distribute an online survey created in Google Forms:
-
Step 1: Select the send option from the upper-most right corner.
- Step 2: Select the distribution method from the available options, which include email, shareable link, or embedded HTML.
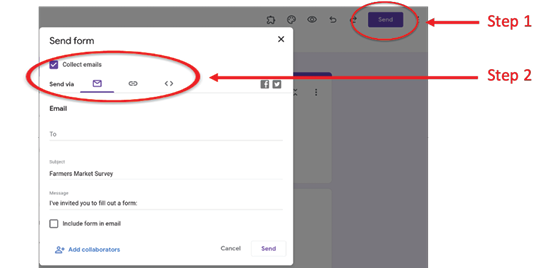
If you select the email option, you can directly distribute the survey to a list of email addresses. You can also choose to create a sharable link, which could be included in an email to customers (or potential customers in the community) or shared in social media posts. One advantage of the shareable link is that it would come from the organization’s email account rather than a mass email list. The recipient may be more likely to respond to an email from the farmers market account. An embedded HTML link will allow you to insert the actual survey on a webpage or social media page as opposed to a link that directs you to the survey.
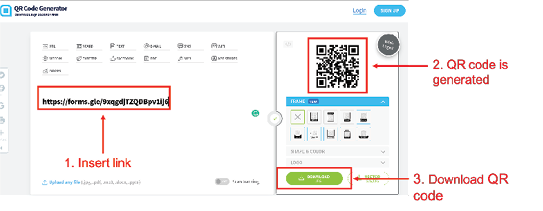
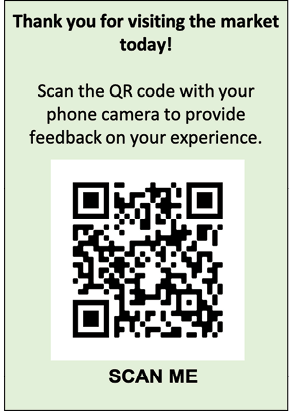
- Step 3: Creating a QR code (optional step, but easy for you to generate and for your customers to access the survey). You can use several free online tools to create a QR code that customers can easily scan. Simply insert the shareable link generated in Step 2. You can download the QR code as an image that you can share from device to device, on social media platforms, or via email or text message (Figures 6 and 7).
Analyze Survey Responses
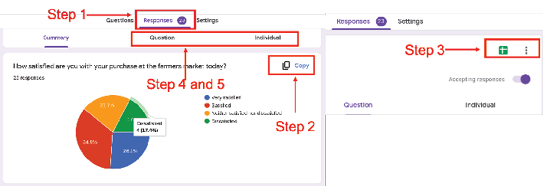
- Step 1: Select the responses tab (next to the questions tab; Figure 8).
The Google Forms platform provides very basic analysis (results tabulation and graphs) for the survey responses that we can copy and use to analyze the sale, customer preferences, or the need for operational improvements.
- Step 2: Copy tables and charts.
Google Forms automatically generates tables and/or graphs, and these can be copied and pasted to a word processing document by clicking the copy icon. It is always recommended to keep a comprehensive file of responses to track how responses (e.g., customer satisfaction) change as operations are improved based on feedback.
- Step 3: View responses in Google Sheets.
This option allows you to access a spreadsheet with the survey response data, making it easy to see all individual responses, and perform more detailed analyses such as cross-tabulations.
Other options include assessing the responses by the question category or by the individual responses for the entire survey.
Create a Contact List
One of the valuable results of collecting data via online surveys in Google Forms is being able to create a contact list of survey respondents. This process is optional but is excellent for mass email advertising and promotion.
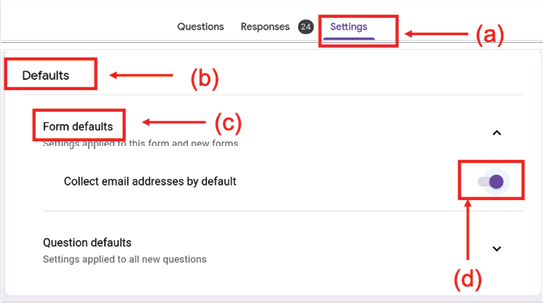
- Step 1: Before distributing the survey:
- Go to the settings tab next to the responses tab (Figure 9).
- Scroll to the default option and select it for a list of dropdown options.
- Select the form defaults tab.
- Turn on the option to collect email by default. This option allows respondents to input their email as a required question.
A drawback to this is that respondents may not want to include their contact information, and they may stop doing the survey altogether. Alternatively, you can leave this setting unchanged and, instead, include an optional question for an email address. Responses from this question may still be used to generate a contact list using the Excel spreadsheet. Having the contact list in Excel will also make it possible to generate contact lists for other emailing platforms such as Outlook and Yahoo.
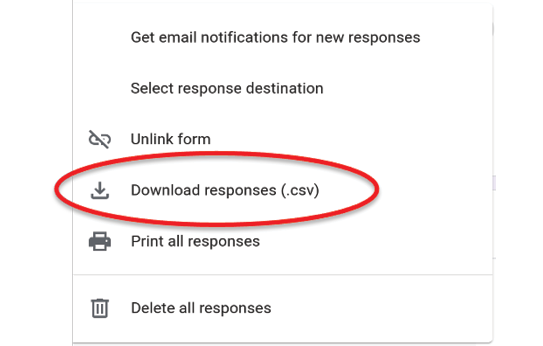
- Step 2: After distributing the survey and collecting responses, go to responses and click the kebab menu icon (three stacked dots) and choose the option to download responses as a CSV (comma separated value) file, as shown in Figure 10. This allows you to open the contact list in a spreadsheet or import it into an email app such as Outlook.
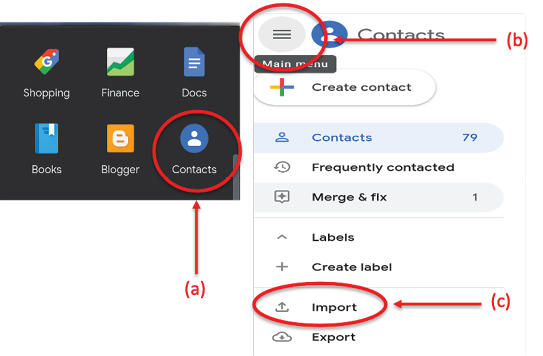
- Step 3: This step requires you to go to your Google Forms home page and select the candy box icon (three rows of three dots) that shows a drop down of all Google apps (Figure 11).
- Scroll to the Google Contacts icon in the dropdown menu.
- After the Google Contacts page is loaded, select the hamburger menu (three stacked lines).
- Select the import option from the dropdown menu in the left corner.
An alternative option is to go to your Google contact list, then follow through steps 2 and 3 above.
- Step 4: Select the recently downloaded CSV file to import (Figure 12). This will import the emails of the respondents that were collected from the survey.

- Step 5: Rename the new label (contact list) as “Farmers Market Survey” or another fitting title. A label is a list of contacts that you have grouped together. This makes it easy to email groups without having to select each individual email address.
- Step 6: Select the labels section to see the contact list that is now renamed to fit the survey just taken (Figure 13). After selecting the contacts within the list, you can send an email to that group. This will send your email to all the respondents who participated. You can always add or remove recipients from this mass email list.

References
Romberger, H. 2018. FMC farmers market metric data collection.
National Sustainable Agriculture Coalition. 2011. USDA blogs about farmers market data.
Farmers Market Federation of New York. 2009. Guide to developing a community farmers market. NYS Department of Agriculture & Markets.
Tropp, D. 2017. Location, location, location: Identifying crucial business factors for farmers markets. U.S. Department of Agriculture.
Abbamonte, K. Customer satisfaction surveys: A comprehensive guide. Help Scout.
The information given here is for educational purposes only. References to commercial products, trade names, or suppliers are made with the understanding that no endorsement is implied and that no discrimination against other products or suppliers is intended.
Publication 3767 (POD-06-22)
By Shannon Giscombe, Graduate Research Assistant, and Elizabeth Canales, PhD, Assistant Professor, Agricultural Economics.

The Mississippi State University Extension Service is working to ensure all web content is accessible to all users. If you need assistance accessing any of our content, please email the webteam or call 662-325-2262.