
Mississippi Certified Waterworks Operator Age and Tenure Report (2023)
One of the major initiatives of the U.S. Environmental Protection Agency (EPA) and the Mississippi State Department of Health Bureau of Public Water Supply (MSDH–BPWS) focuses on managing the assets of the public waterworks utility. Most of this initiative is focused on infrastructure assets such as treatment plants, distribution lines, and meters and precludes the human assets that are just as critical to the success and sustainability of the public waterworks utility.
Through several discussions of this topic, the issue of the age and tenure of certified waterworks operators has arisen, primarily in the context of the age and longevity of the workforce by both water system officials (including public works directors and system governing officials) and the general population of certified waterworks operators. To examine this topic, data were obtained from MSDH–BPWS through a Freedom of Information Act request. These data (for each certified waterworks operator) included:
- License classification (A, B, C, D, and E)1
- Date of birth
- Date of original certification
- County of residence
- Whether the certified operator is the designated operator for any system
No individual identifiers (name, license number, etc.) were obtained for this analysis.
Number of Operators by County
MSDH–BPWS records show that 1,230 individuals hold a current (as of June 30, 2023) Mississippi license, and 1,146 of these individuals reside in the state.2 (There is one certified operator who holds a class E license, but this individual was not included in this analysis.) Table 1 presents the total numbers of operators by class and whether those operators are designated operators, while Figures 1 through 4 provide spatial analyses of the number of operators residing3 in each county.
|
Operator Class |
All Operators |
Designated Operators |
Non-Designated Operators |
|
Class A |
67 |
24 |
43 |
|
Class B |
250 |
125 |
125 |
|
Class C |
259 |
145 |
114 |
|
Class D |
570 |
597 |
273 |
|
Total |
1,146 |
591 |
555 |
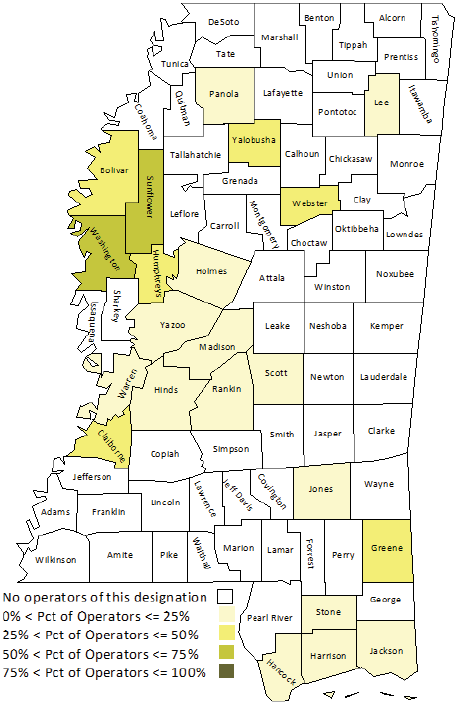
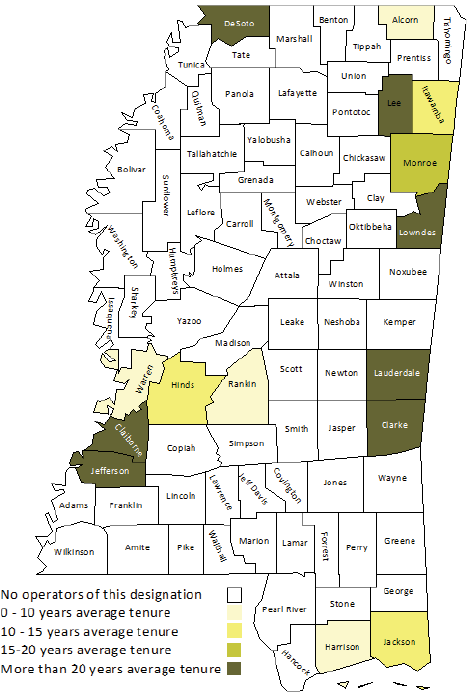
Figure 1 provides an analysis of the number of certified waterworks operators holding a class A license by county of residence. The largest number of class A operators (19) reside in Hinds County, followed by Alcorn County (9) and Lee County (7). The average tenure of class A operators who reside within the state is 10.2 years.
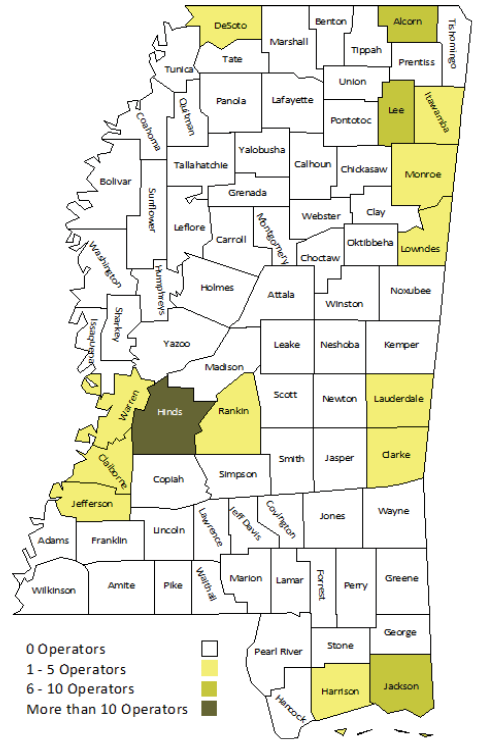
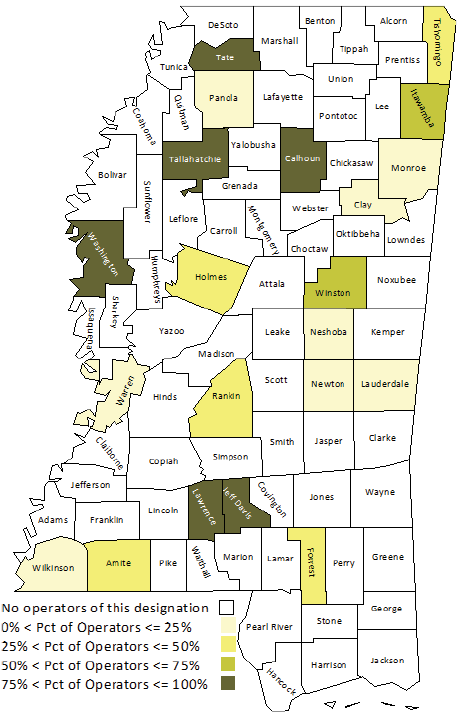
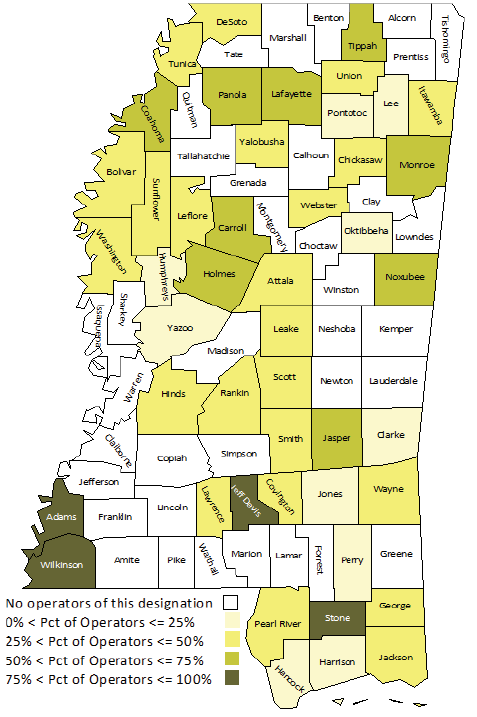
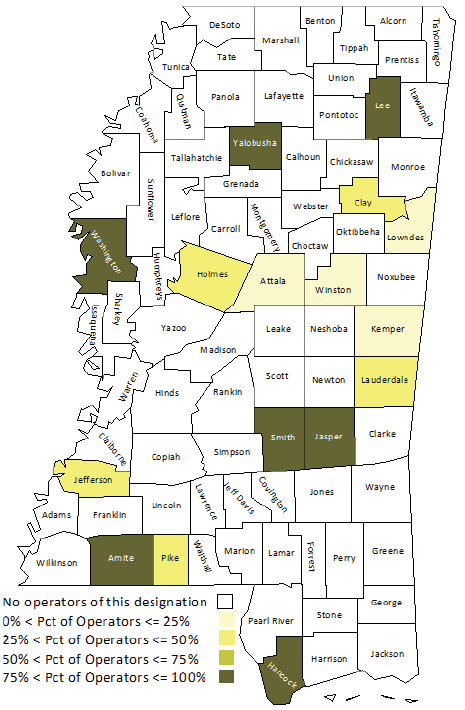
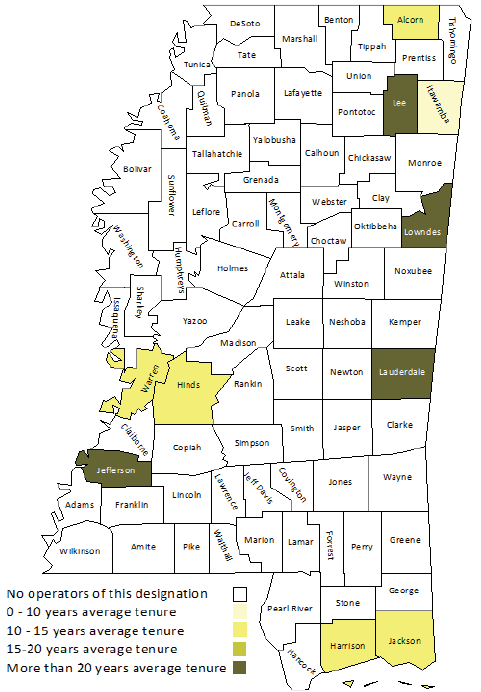
Figure 2 presents the number of class B certified waterworks operators by county of residence. The largest number of class B operators reside in Lauderdale County (21), followed by Lowndes County (17) and Neshoba County (14). The average tenure of class B operators who reside within the state is 15.5 years.
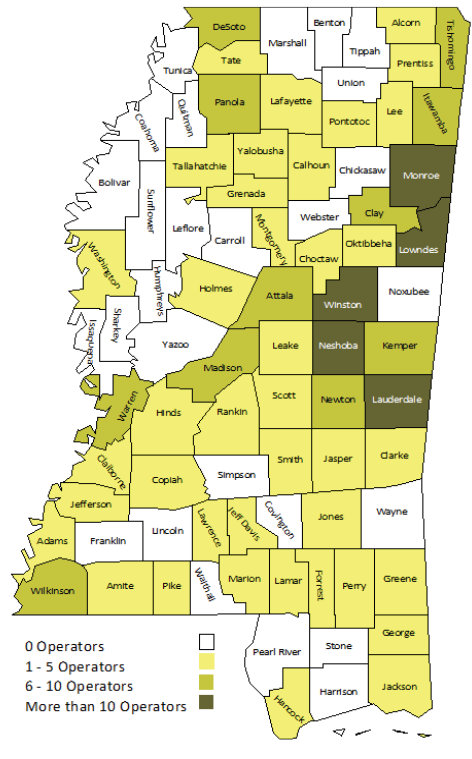
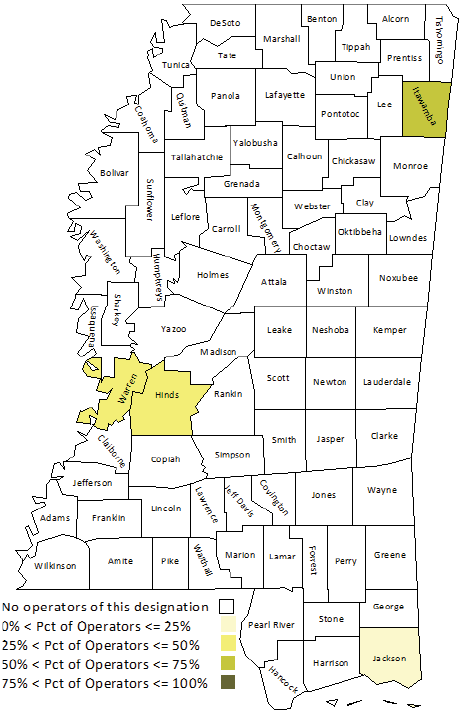
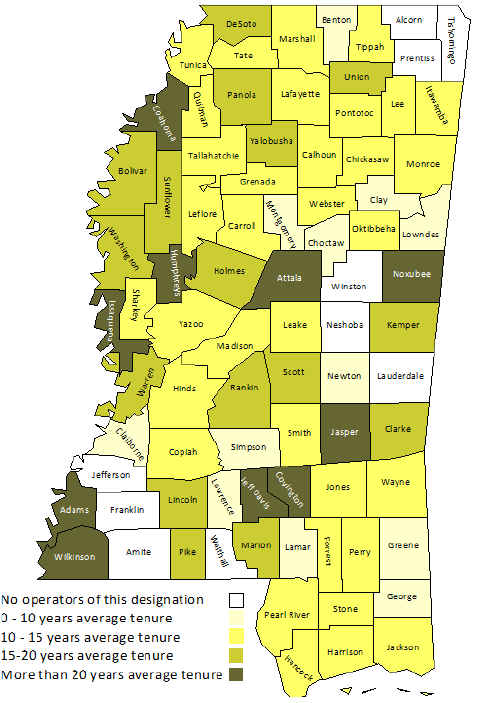
Figure 3 presents the number of class C waterworks operators residing in Mississippi by county of residence. (There are 259 operators with a class C license who reside within the state.) Jones County has the largest concentration of these operators, with 20 operators residing in the county, followed by DeSoto, Pike, and Yalobusha Counties (11 class C operators in each county). The average tenure of class C operators who reside within the state is 14.7 years.
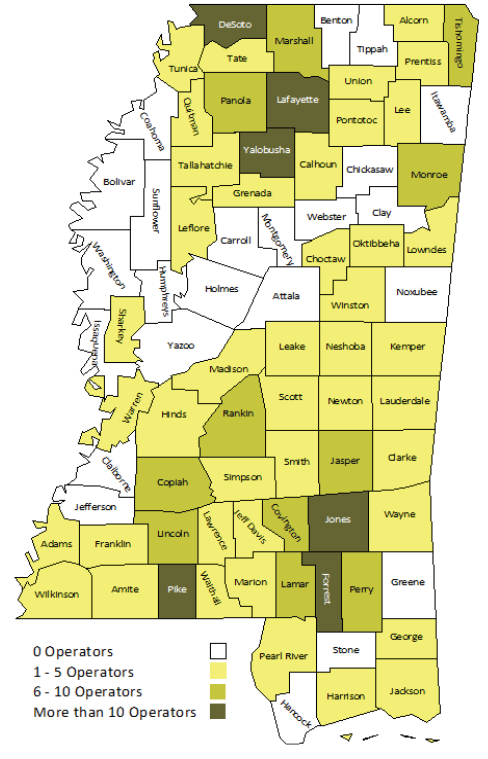
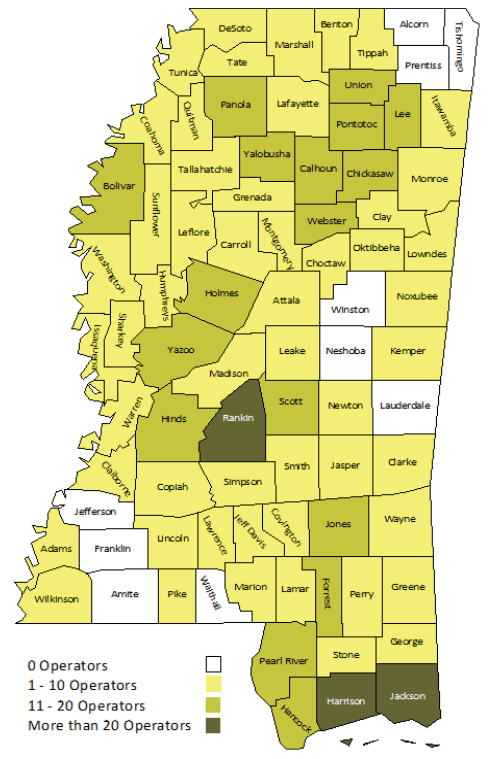
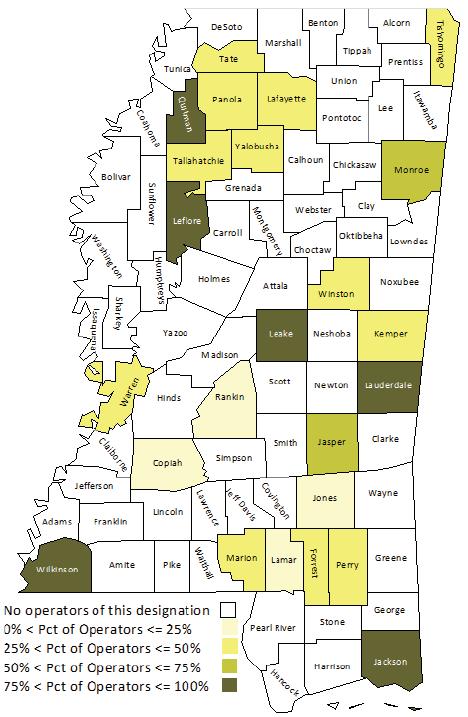
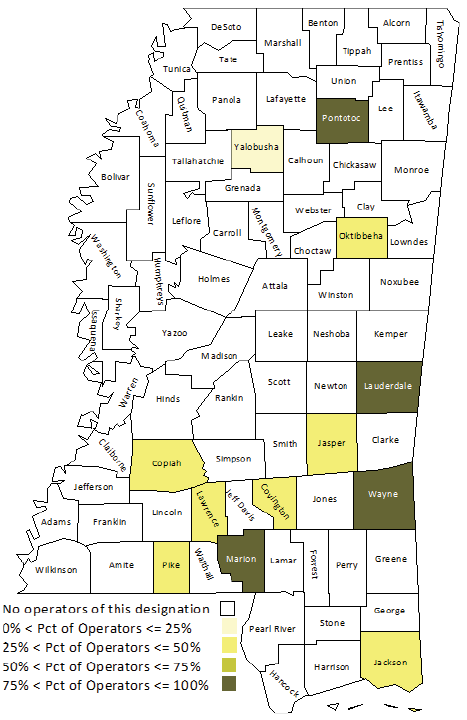
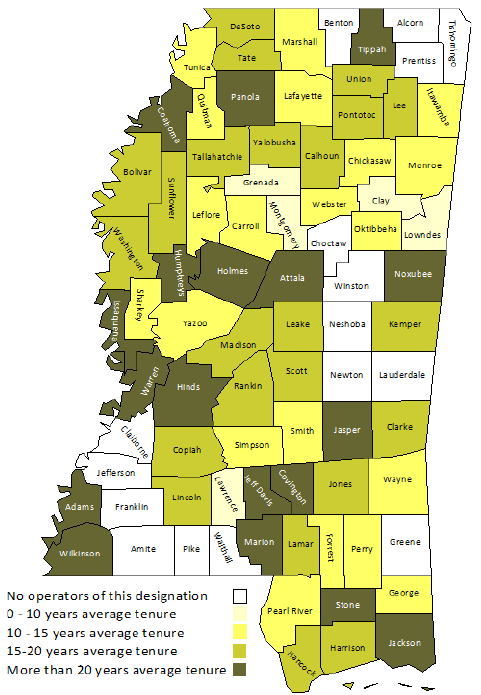
Figure 4 shows the number of class D waterworks operators residing in the state. Due to the much larger number of these operators (570 operators) residing in Mississippi, the reporting scale for Figure 4 is changed to more clearly distinguish between the numbers of operators residing in each county. The largest number of class D waterworks operators reside in Harrison County (57 operators), followed by Rankin County (36 operators) and Jackson County (31 operators). The average tenure of class D operators who reside within the state is 14.3 years.
Average Operator Age by License Classification and County
As mentioned in the introduction, a primary impetus for this study is to examine the age of operators residing in the state. Table 2 presents age information.
However, the information in the above table does not reveal the potential issues that may arise when the average age of operators of specific license classifications is examined for various areas of the state. Figures 5 through 9 present the average age of all operators (both designated operators and non-designated operators) by license classification and county.
|
License Classification |
Average Overall Operator Age |
Average Operator Tenure |
|
All Classes |
54.4 years |
14.6 years |
|
A |
53.8 years |
13.5 years |
|
B |
54.4 years |
15.4 years |
|
C |
53.6 years |
14.7 years |
|
D |
54.9 years |
14.3 years |
Figure 5 presents the average age of all certified waterworks operators residing in the state by county. Two counties have an average operator age over 65 years; the average age of certified waterworks operators in Jasper County is 66.3 years of age, and the average age in Washington County is 65.2 years. There are no counties with an average certified waterworks operator under age 35; however, there are two counties with an average operator age between 35 and 45 years. The average age for all certified waterworks operators residing in Prentiss County is 38.2 years, and the average age for operators residing in Benton County is 38.3 years. Forty-one counties have an average age of certified waterworks operators residing in the county between 45 and 55 years, and 37 counties have an average age of operators residing in the county between 55 and 65 years of age.
The average tenure of operators by county for all certification classes varies widely. Winston County has the highest average operator tenure at 24.8 years, followed by Issaquena County (24.2 years), and Coahoma County (23.5 years). Benton County has the shortest average operator tenure at 6.9 years, followed by Franklin County (7.6 years) and George County (7.9 years).
Five counties have an average tenure of 10 or fewer years, and nine counties have an average tenure of over 20 years. This could suggest that a small number of certified waterworks operators have been in the industry for a relatively short time, but examination of the data indicates that this is not the case. Of the 1,146 certified waterworks operators residing in the state, 484 of these operators (42.2 percent) have been in the workforce for 10 or fewer years. The mid-tenure ranges (10–15 years and 15–20 years) contain 170 operators (14.8 percent) and 153 operators (13.4 percent), respectively. This does suggest that there is a relatively low number of certified waterworks operators who have a substantial level of experience that would prove valuable in moving into management positions within the industry.
Of some concern, however, is the number of certified waterworks operators who have been in the workforce longer than 20 years; these individuals are likely to retire in a relatively short time. Of the 1,146 certified waterworks operators residing in the state, 339 operators (20.6 percent) have held a license for more than 20 years and 194 (16.9 percent) have held a license for more than 25 years.
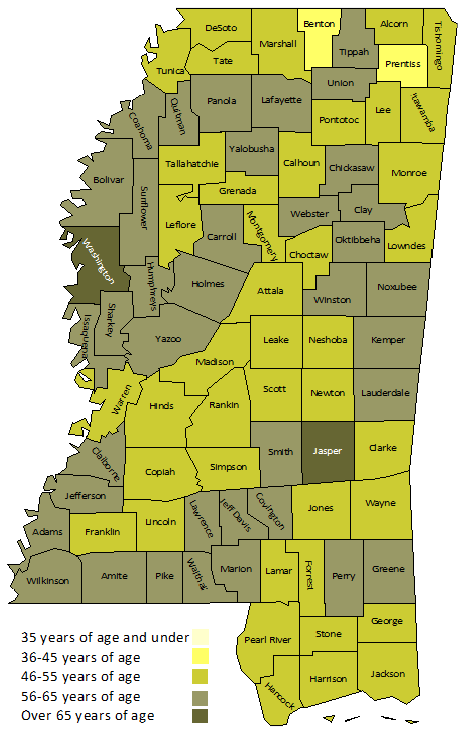
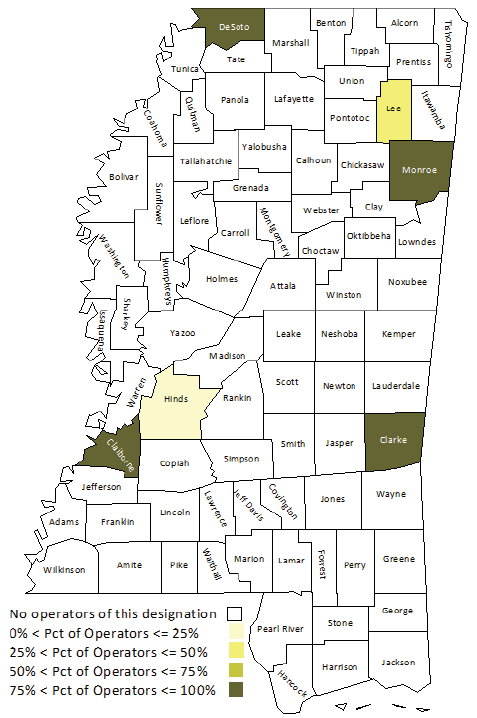
Figure 6 shows the average age of certified waterworks operators who reside in Mississippi and possess a class A license for each county in the state. The graphic reveals that five counties (Claiborne, Clarke, DeSoto, Lowndes, and Monroe) have an average age of over 65 years for class A operators, with Claiborne and Clarke Counties each having an average age of over 70 years.4 Furthermore, three of the 15 counties where class operators reside (DeSoto, Jefferson, and Lee) have an average age between 56 and 65 years of age. Of the 67 class A waterworks operators residing in the state, 25.4 percent (17 operators) are between 55 and 65 years of age and 20.9 percent (14 operators) are over 65 years of age.
Clarke County has the longest average tenure of class A certified waterworks operators at 36.1 years, followed by Jefferson County (34.8 years) and Claiborne County (29.8 years). Rankin County has the shortest average tenure of class A certified waterworks operators at 6.5 years, followed by Warren County (6.8 years) and Alcorn County (8.9 years).
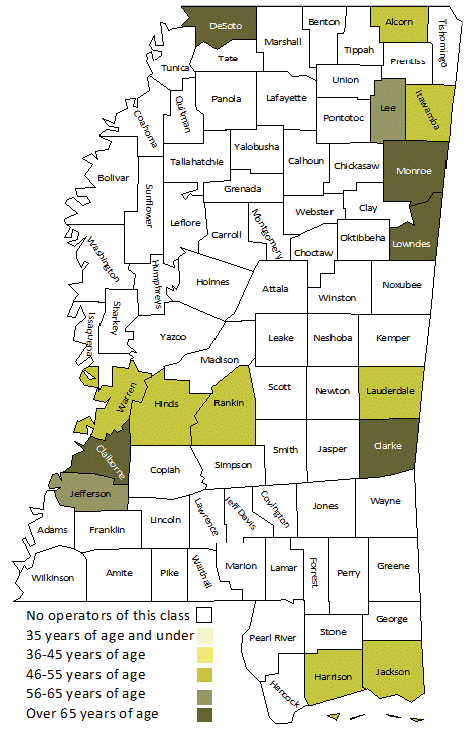
Figure 7 depicts the average age of certified waterworks operators who have a class B license by county. The graphic reveals that in 11 counties, the average age of these operators is over 65 years, and in 17 counties, the average age is between 55 and 65 years. Six counties have an average age of over 70 years, and two counties (Hancock and Jasper) have an average age of over 80 years. Of the 250 class B certified waterworks operators in the state, 33.6 percent (84 operators) are between 55 and 65 years of age, and 18 percent (45 operators) are 65 years of age and over. Prentiss County is the only county to have an average age of class B certified operators residing in the county under 35 years (33.7 years).
Calhoun County has the longest average tenure of class B certified waterworks operators at 34.8 years, followed by Jasper County (33.9 years) and Greene County (32.7 years). Prentiss County has the shortest average tenure of these operators at 1.7 years, followed by Jones County at 3.2 years and Jackson County at 4.9 years. Of the 296 class B certified waterworks operators residing in the state, 94 (31.8 percent) have held a license for 10 or fewer years, 84 (28.4 percent) have held a license for more than 20 years, and 46 (15.5 percent) have held a license for more than 25 years.
It is not known whether these operators continue to be (or ever have been) associated with a system other than their “apprenticeship” that they could have undertaken as part of the certification process, unless they serve as the designated operators of a system (discussed in the next section).
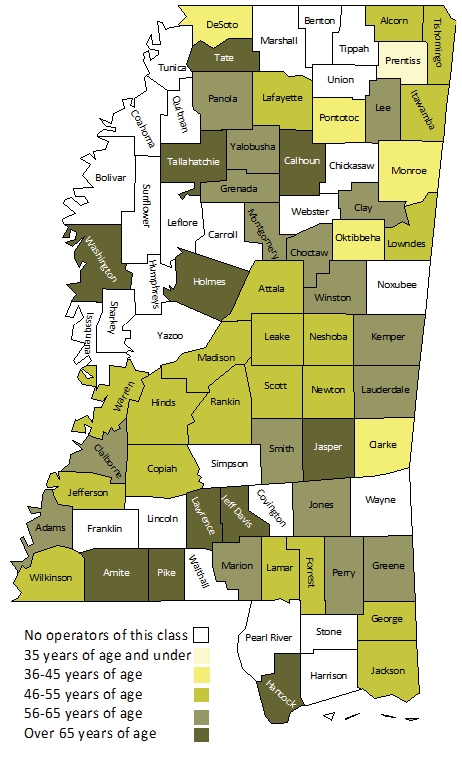
Figure 8 depicts the average age of class C certified waterworks operators residing in Mississippi by county. Six counties have an average age of 65 years and over for this operator classification, and 17 counties have an average age between 55 and 65 years. Lauderdale and Pontotoc Counties have an average age of class C operators over 70 years of age (77.2 and 72.3, respectively). Of the 259 class C operators, 24.7 percent (64 operators) are between 55 and 65 years of age, and 18.9 percent (49 operators) are 65 years of age and over. Grenada County is the only county to have an average age of class C operators under 35 years (30 years).
Lauderdale County has the longest average tenure of class C certified waterworks operators at 36.1 years, followed by Wilkinson County (31.9 years) and Quitman County (31.4 years). Calhoun County has the shortest average tenure of these operators at 1.3 years, followed by Lowndes County at 1.4 years and Grenada County at 3.2 years. Of the 301 class C certified waterworks operators residing in the state, 112 (37.2 percent) have held a license for 10 or fewer years, 78 (25.9 percent) for more than 20 years, and 42 (14.0 percent) for more than 25 years.
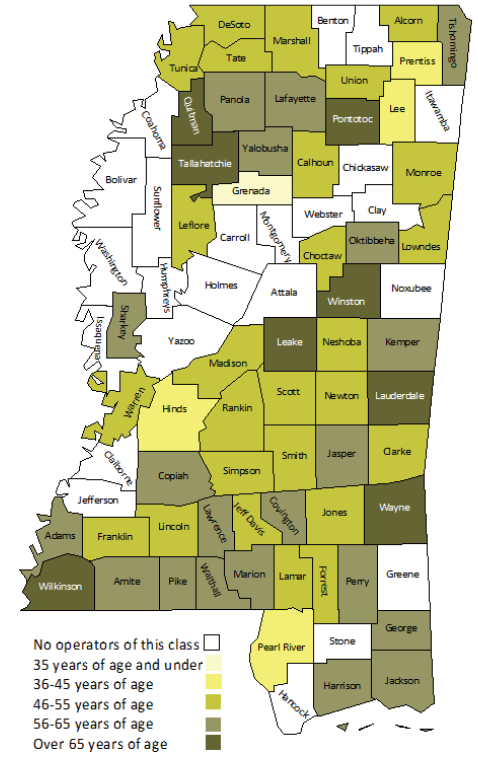
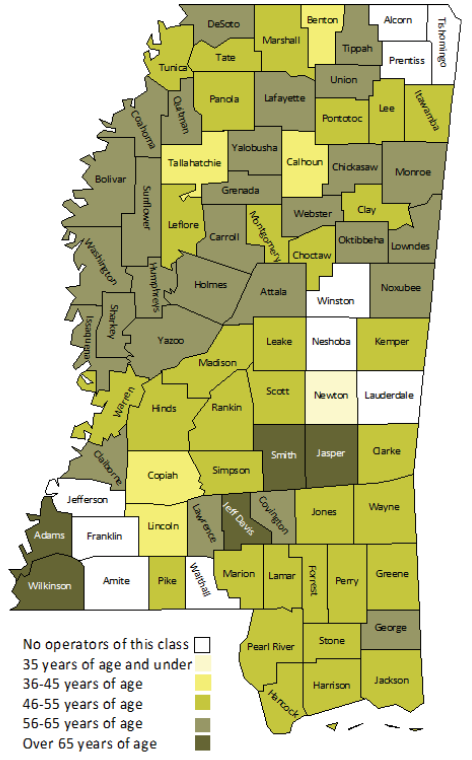
Figure 9 presents the average age of class D certified operators residing in Mississippi by county. While only five counties in the state have an average age of over 65 years (Adams, Jasper, Jefferson Davis, Smith, and Wilkinson), 28 counties have an average age between 55 years and 65 years. Of the 570 class D operators residing in the state, 29.8 percent (170 operators) are between the ages of 55 years and 65 years and 22.6 percent (129 operators) are over 65 years of age. Newton County is the only county with an average age of class D operators under 35 years (27.7 years).
Adams County has the longest average tenure of class D certified waterworks operators at 36.3 years, followed by Jefferson Davis County (36.1 years) and Wilkinson County (26.3 years). Choctaw County has the shortest average tenure of these operators at 1.9 years, followed by Newton County at 3.5 years and Claiborne County at 5.1 years. Of the 667 class D certified waterworks operators residing in the state, 244 (36.6 percent) have held a license for 10 or fewer years, 158 (23.7 percent) for more than 20 years, and 97 (14.5 percent) for more than 25 years.
Average Designated Operator Age by License Classification and County
By statute, every public waterworks system must have a designated operator. While it is not known whether other operators included in this study are associated with a system, these operators are officially tied to one or more systems. The authors feel that the analysis of this subpopulation is extremely important as it is the primary workforce responsible for managing public waterworks systems.
Figure 10 presents the percentage of designated class A operators who are over 55 years of age but not older than 65 years. All of the designated operators in Jefferson County who hold a class A certification are in this age range, and two-thirds of the class A designated operators in Lee County are in this age range.
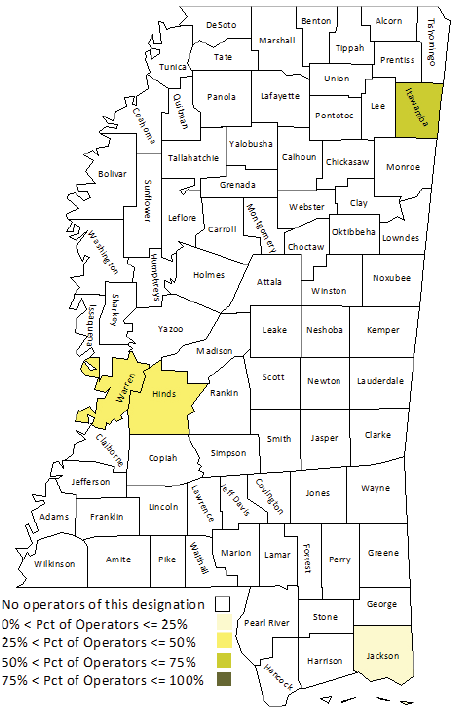
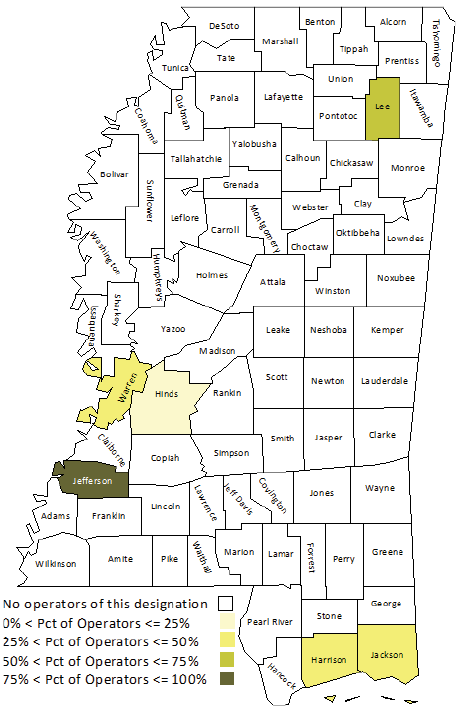
Figure 11 presents the percentages of class A designated operators who are over 65 years of age. All of the class A designated operators in Lowndes County are over 65 years old; 50 percent of the class A designated operators in Alcorn County are over 65 years old; and one-third in Hinds and Lee Counties are over 65 years of age.
Figures 12 and 13 present the same information for designated operators who hold a class B certification. Figure 12 shows that in 10 counties, over 75 percent of the class B designated operators are over 55 but less than 65 years. Interestingly, in seven counties, 25 percent or less of class B designated operators are in this age range.
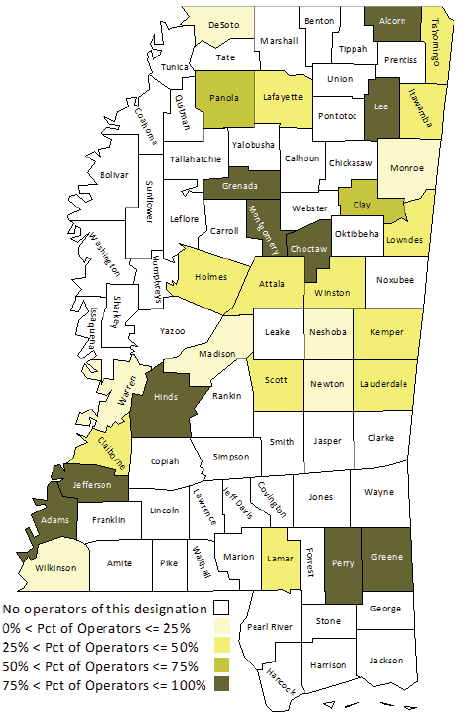
Figure 13 depicts the percentages of class B designated operators who are over 65 years of age. In six counties, over 75 percent of class B designated operators are in this age range. In eight counties, 25 percent or fewer are over 65 years.
Figures 14 and 15 present this information for designated operators who hold a class C certification. Figure 14 shows that over 75 percent of class C operators are in the 55–65 age range in eight counties. In 20 counties, the percentage is 50 or below.
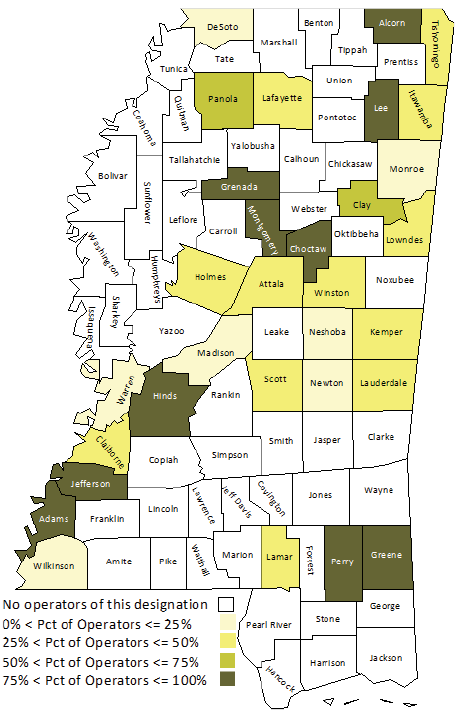
Figure 15 depicts the percentages of class C designated operators who are over 65 years of age. In six counties, over 75 percent of operators fall into this category. In four counties, 25 percent or fewer fall into this category.
Figures 16 and 17 present this information for designated operators who hold a class D certification. Figure 16 shows that in seven counties, over 75 percent of the class D designated operators are in the 55–65 age range. In 12 counties, the number is 25 percent or below; in 26 counties, it is 26–50 percent; and in three counties, it is 51–75 percent.
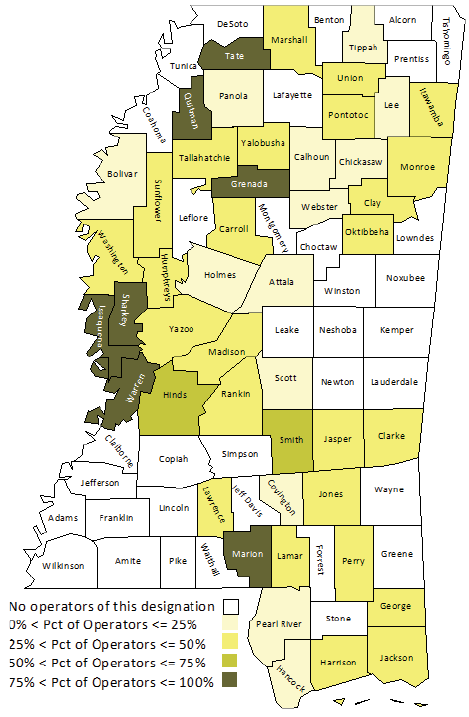
Figure 17 depicts the percentages of class D designated operators who are over 65 years of age. In four counties (Adams, Jefferson Davis, Stone, and Wilkinson Counties), all of the class D designated operators are in this age range. In nine counties, 25 percent or fewer of these operators are over 65 years old.
Average Other (Non-Designated) Operator Age by License Classification and County
While the population of designated operators discussed in the previous section can be thought of as the industry’s primary management team, the other operators in the state can be thought of as the future of the public water systems, in terms of both management and its skilled workforce. Figures 18 through 24 depict the percentages of non-designated certified waterworks operators who reside in Mississippi and are 55–65 years old or over 65.
Figures 18 and 19 depict the percentages of non-designated waterworks operators who hold class A certification. Figure 18 implies that class A operators who are not the designated operator for the system are relatively young. Only four counties have class A non-designated operators who are 55–65 years of age. Figure 19 shares a similar story. In four counties, more than 75 percent of these operators are over 65 years of age. Only two other counties have this type of operator in this age range.
Figures 20 and 21 share a similar story for certified waterworks operators who are not the designated operator for a system and are above 55 years of age, particularly given that there are many more B-licensed operators in the state than there are A-licensed operators.
Figure 20 shows that in six counties, the population of class B non-designated operators 55–65 years of age is greater than 75 percent. Also note that 15 additional counties have a presence of class B non-designated operators in this age group, but these operators comprise 50 percent or less of this population in these counties.
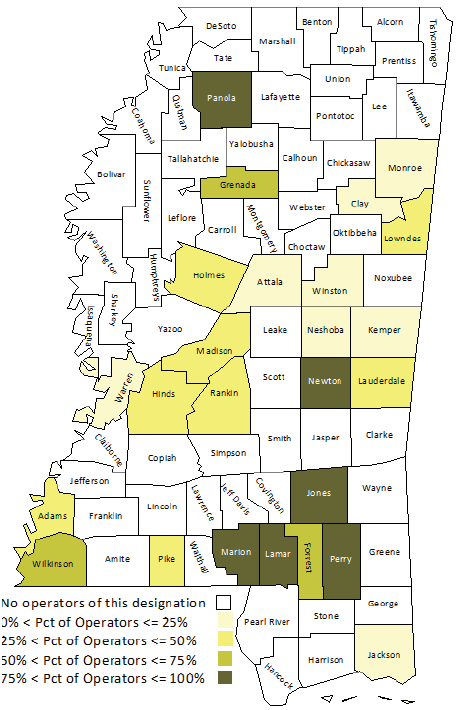
Figure 21 reveals that seven counties have a greater than 75 percent population of class B non-designated operators who are over 65 years of age; in each of these counties, the entire population of operators in this classification is over 65 years of age. Eight additional counties have a presence of this type of operator, but in none of these cases is the population of these operators over 50 percent of the entire population of class B non-designated operators in the state.
Figures 22 and 23 tell a similar story for non-designated operators who hold a class C license and reside within the state. Figure 22 depicts the percentages of operators who hold a class C waterworks license, are not listed as the designated operator for any system, and are 55–65 years old. In four counties, all operators are in this category. In eight additional counties, less than 50 percent of operators are in this category.
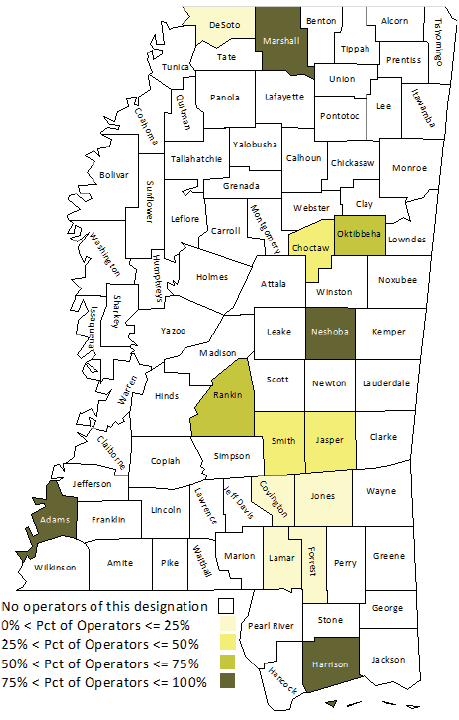
Figure 23 shows the percentages of class C non-designated operators who are over 65 years old. In four counties, all operators are in this category. In seven other counties, 50 percent of operators are 65 or older.
Figures 24 and 25 depict the percentages of class D non-designated operators in the state. Figure 24 depicts the percentages of operators who hold a class D waterworks license, are not listed as the designated operator for any system, and are 55–65 years old. In five counties, all operators are in this category. In two counties, 50–75 percent of operators are in this age group. In 29 counties, less than 50 percent are in this category.
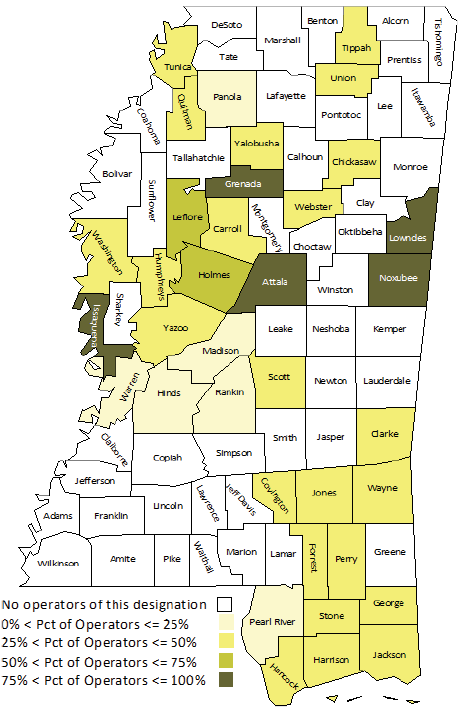
Figure 25 shows the percentages of class D non-designated operators who are over 65 years old. In two counties (Sunflower and Washington), 50–75 percent of the operators are over 65. In six counties, 25–50 percent are over 65 years old. In 14 counties, 25 percent are over 65.
Certified Waterworks Operator Tenures
While the age of certified waterworks operators is of concern to utilities and governing boards across the state, another concern is losing the experience of these operators in managing the day-to-day activities of the current system, as well as future systems.
Figure 26 presents the average tenure of all certified waterworks operators by county of residence. Nine counties have an average tenure of currently certified operators over 20 years; the highest average tenure is in Winston County (24.8 years), followed closely by Issaquena County (24.2 years). Twenty-seven counties have average tenures of 15–20 years, while 41 counties have an average tenure of 10–15 years. Five counties have an average tenure of less than 10 years. Of these, Benton County has the lowest average tenure (6.9 years), followed by Franklin County (7.6 years) and George County (7.9 years).
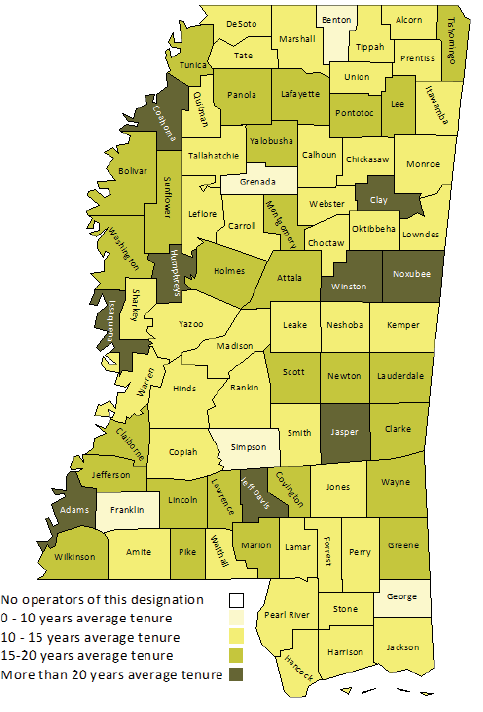
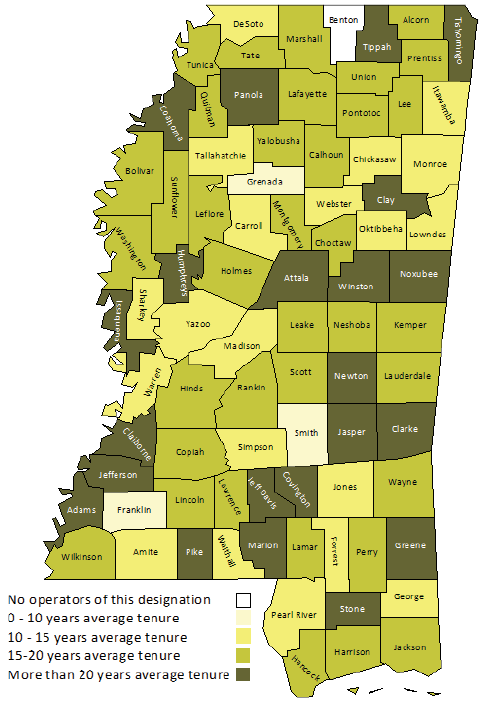
Figure 27 presents the average tenure by county for all operators who are classified as designated operators for a system. The differences between Figure 26 and Figure 27 are striking; where nine counties had an average operator tenure of over 20 years, 22 counties had an average designated operator tenure of more than 20 years. Furthermore, while 27 counties have an average operator tenure of 15–20 years, 36 counties have an average designated operator tenure of 15–20 years.
The information presented in the following table should be of some concern to water utilities and policymakers (including governing boards of utilities). The majority of the certified waterworks operators in the state fall into two main categories: those who have worked 10 or fewer years and those who have worked more than 20 years. Of those who have worked longer than 20 years, the majority have worked more than 25 years and could be approaching retirement. Table 3 suggests that, while a relatively large number of people enter the water operator profession, many leave the profession before they reach a level of substantial experience (i.e., 10 years).
|
Tenure Classification |
Number of Operators |
|
0–10 years |
484 (42.2%) |
|
10–15 years |
170 (14.8%) |
|
15–20 years |
153 (13.4%) |
|
over 20 years |
339 (29.6%) |
|
over 25 years |
194 (16.9%) |
Figures 28 through 35 show the average tenure of certified waterworks operators by license classification, county of residence, and designated operator status. A high average tenure of operators for any license classification indicates that the area has a relatively high level of experience for today’s operations, but experience could be lacking in the future if a relatively large number of these experienced operators retire in a short time frame.
Figure 28 depicts the average tenure of certified waterworks operators who have a class A license by county. This figure reveals that seven counties have class A operators residing in the county; it is assumed that class A operators who live in Clark County are likely working in Lauderdale County and that class A operators who live in Claiborne County are likely working in Jefferson County. Figure 29 shows that four counties have an average designated operator tenure of more than 20 years. There seems to be a wide range of operator tenure averages between the counties.
There are no designated class A operators in the 15- to 20-year tenure range, but there are several designated class A operators in this range who will be well situated to lead these utilities into the future. However, 25 class A non-designated operators have 10 or fewer years of experience. The average age of these operators is 46.9 years. Given the relatively low number of class A water utilities in the state, this suggests that there could be a relatively stable cohort of these operators who could lead the class A water utilities into the future.
Figure 30 shows the average tenure of class B operators by county, while Figure 31 presents the average tenure of class B operators who are designated operators by county. Several counties have operators and designated operators with average tenures of more than 20 years. The relatively long-range future of these operators concerning retirement should be of some concern to utility governing boards and policymakers.
To further illustrate this point, eight class B non-designated operators are between 36 and 45 years of age and have 10 years or more of experience. (Non-designated operators were used in this analysis because it was felt that they might be more willing to move to another system and also because they would be not be leaving a utility without a designated operator if they did move.) This suggests that there could be a significant shortage of experienced operators to lead these systems into the future. However, 60 class B operators are non-designated operators who have 10 or fewer years of experience. These operators have an average age of 46.2 years. This suggests that there could be a relatively steady stream of this class of operators to lead water utilities in the future.
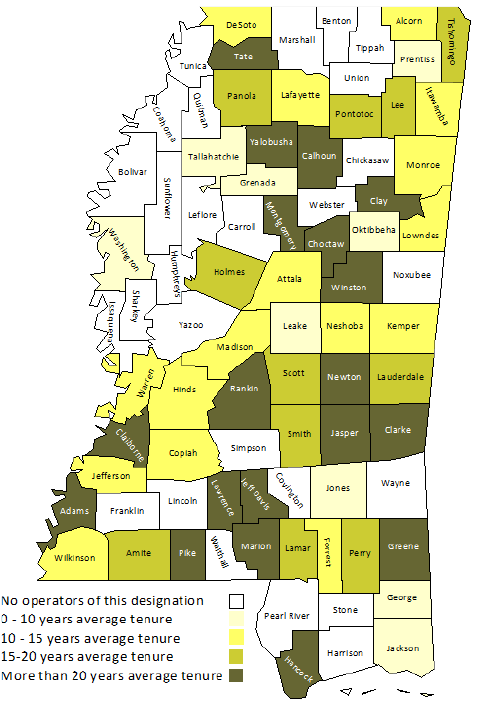
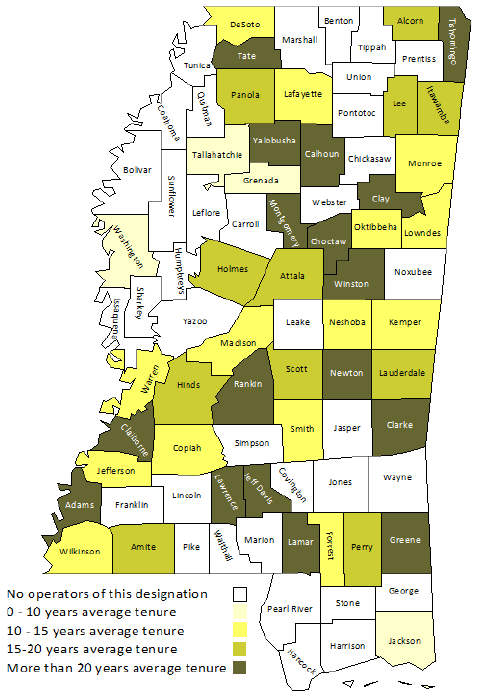
Figure 32 depicts the average tenure of class C certified waterworks operators by county, while Figure 33 presents the average tenure of class C operators who are the designated operators for a waterworks utility. Fifteen counties have average class C operator tenures over 20 years, with six having average operator tenures over 25 years. While it is encouraging to note that 26 counties have average class C operator tenures of 10–20 years, the average tenure of designated class C waterworks operators presents some results of concern. Twenty counties have average tenures of class C designated waterworks operators over 20 years, and in nine of these counties, the average tenure is over 25 years.
While 32 counties have an average tenure of all class C operators between 10 and 20 years, analysis of the data shows that four non-designated class C operators are between the ages of 36 and 45 and have 10 or more years of experience. However, 65 non-designated class C operators have 10 or fewer years of experience. The average age of these operators is 42.7 years. This suggests that there may be a steadier flow of this operator classification staying in the workforce.
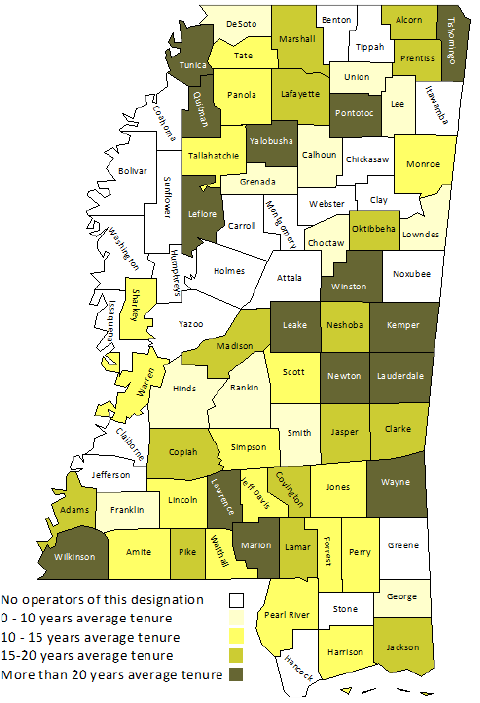
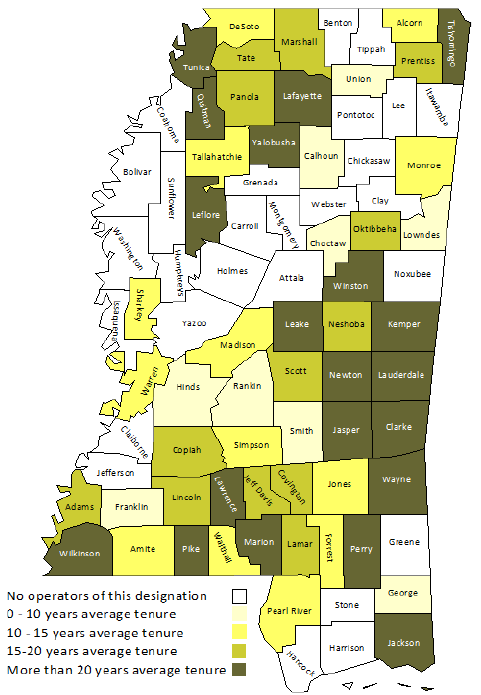
Figure 34 shows the average tenure of class D operators by county, while Figure 35 presents the average tenure of class D designated operators by county. This classification represents not only the largest cohort of certified waterworks operators in the state but also the largest number of water systems. Ten counties have an average tenure of class D operators of more than 20 years; in three of these counties, the average tenure is more than 25 years. Eighteen counties had an average tenure of more than 20 years and six had an average tenure of more than 25 years.
However, 11 non-designated class D operators are between the ages of 36 and 45 and have 10 or more years of experience; presumably, these operators would be available to assume designated operator roles in the case of retirements. However, 147 of the non-designated class D operators have fewer than 10 years of experience. The average age of these operators is 44.2 years; this suggests that there may be a relatively stable cohort of these operators who will be able to lead this class of waterworks utilities into the future.
Conclusions
The average age of certified waterworks operators who reside in Mississippi is increasing. The average age for class A, B, C, and D operators is 54.4 years. While the authors did not have a dataset from five years ago, if the operators who were certified within the last five years were eliminated from the dataset and the average age of the operators who are left was calculated as of five years ago, the average age of a Mississippi-certified waterworks operator would have been 51.9 years. While there have certainly been operators of all ages whose licenses have lapsed in this five-year period, it seems reasonable to the authors to assert that the average operator age is increasing.
Figure 36 shows the total number of currently certified waterworks operators (including those living outside the state) and the number of currently certified waterworks operators living in Mississippi. While most currently certified operators do reside in Mississippi, a relatively large number of operators who were originally certified from July 1, 2018, to July 1, 2023, now live outside the state (25.2 percent). While some of these operators may live in border states and continue to work in Mississippi, it is plausible to assume that many relatively young operators (in terms of experience) leave the water supply industry and enter another career path. It is also plausible to assume that, if an operator stays in the industry for some time (perhaps two years from a cursory examination of the data), that operator is more likely to remain in the water supply industry.
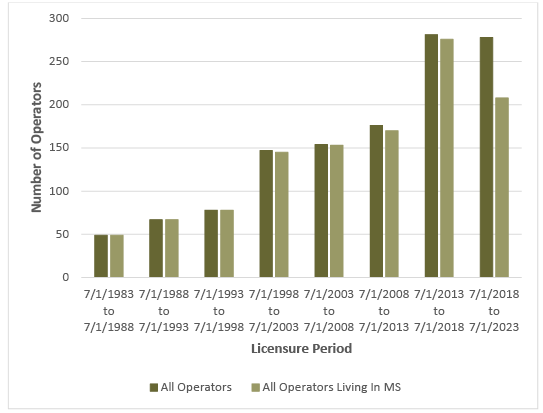
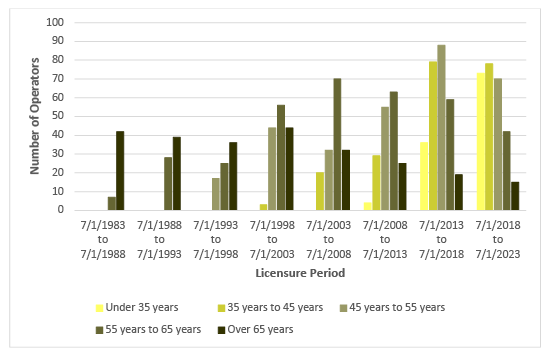
Figure 37 provides some additional information regarding the number of waterworks operators remaining in the industry. There is a continual decline of operators over 65 years of age with licensure dates from the 1998–2003 period to the 2018–2023 period and a steady decline of operators 55–65 years of age in the 2003–2008 to 2018–2023 licensure periods. While this might be expected given the increasing sophistication and success of available retirement plans, what is somewhat surprising is the decline in the number of 35- to 45-year-old and 45- to 55-year-old operators from the 2013–2018 to the 2018–2023 licensure period. This could suggest that the water supply industry is becoming a less attractive second career for people in their middle ages.
There could be several reasons why younger (in terms of experience) operators decide to leave the industry and middle-aged people do not enter the industry as a second career; two of the most likely seem to be compensation and working conditions. In a 2021 survey of water utilities in the state, we found that the average monthly salary/wage for an employee designated waterworks operator (DWO) was $2,801 and for a contract DWO was $1,318 (the majority of contract DWOs were retained by very small and small population utilities; it can be assumed that these utilities do not have the financial resources to compensate personnel at the same rate as larger population utilities).
The monthly compensation ($2,857) for contract employee operators who were not DWOs was, surprisingly, higher than for DWOs, but this could be because most of the non-DWOs were employed by larger utilities with more resources available for compensation. The average monthly compensation for contract operators who were not DWOs was much lower ($720) than for their DWO counterparts.
While working conditions can encompass many different factors, two of the most common may be benefits and the work environment. Our 2021 survey found that 65.2 percent of organizations that had an employee DWO provided those employees with primary benefits (health insurance, retirement plan(s), and/or disability insurance). All organizations that employed DWOs provided secondary benefits (company-owned vehicle, uniforms, and/or covering the cost of continuing education). That same study found that 77.7 percent of utilities that employed non-DWOs provided those employees primary benefits and 92.6 percent provided secondary benefits.
The work environment is a much harder concept to measure. Being a certified waterworks operator for a utility is often a difficult job, and people just entering the industry may not realize the type of work environment they may be subject to. In many cases, new operators will be working with (or under) personnel with a great deal of experience in the industry, and these experienced people may not be as patient or supportive as they possibly could. Establishing either a formal or informal mentoring system for new employees (in all job categories) could help to reduce the number of certified operators leaving the industry. Another strategy could be to establish accessible intensive training programs for potential waterworks operators like the ones that were once held at the state’s community colleges. While the Mississippi Rural Water Association (MRWA) does have a training program for future waterworks operators, this program is housed in the central part of the state, possibly making it inaccessible for some.
References
Barefield, A., Nathan, A. R., & Coatney, K. T. (2022). Water/wastewater utility compensation and employee/contractor retention study survey results 2021. Mississippi State University Extension Service Publication 3412.
1In accordance with Title 15, Part 20, Subpart 72, Chapter 2, Subchapter 2 of the Mississippi Annotated Code, these license classifications are tied to treatment processes used by the water utility. Class A systems have surface water treatment, groundwater under the direct influence of surface water, lime softening, or coagulation and filtration for the removal of constituents other than iron or manganese. Class B systems have two or more class C treatment facilities of different types with iron or manganese removal facilities breaking pressure or requiring flocculation and/or sedimentation, a system using membrane filtration, or ion exchange treatment. Class C systems have aeration, pH adjustment, corrosion control, or closed filtration treatment facilities including zeolite softening or iron removal. Class D systems have no treatment other than chlorination and/or fluoridation or direct chemical feed such as polyphosphate. Class E systems purchase water only and do not provide additional treatment.
2There are 84 individuals who hold a Mississippi certified waterworks operator license but do not reside in the state. These operators are not considered in this study.
3It should be noted that this study focuses on the county of residence for operators, not the county of work. In addition, it is also important for the reader to realize that this study focuses on the certification level of the operator, not the system classification. In no part of this study is an individual operator tied to a specific system.
Publication 3938 (POD-10-23)
By Alan Barefield, PhD, Extension Professor, Agricultural Economics; Romelle F. Britton, Mississippi State Department of Health, Bureau of Public Water Supply; and Abigail G. Lucas, Student Assistant, Agricultural Economics.

The Mississippi State University Extension Service is working to ensure all web content is accessible to all users. If you need assistance accessing any of our content, please email the webteam or call 662-325-2262.