Irrometer Watermark Series: Scientific Background
This publication series provides information and recommendations pertaining to the Irrometer Watermark 200SS, a granular matrix sensor commonly used in Mississippi for scheduling irrigation. Future publications will discuss other types of soil moisture sensors. Users should choose tools that best fit their needs.
Introduction
Ever wondered how a Watermark 200SS sensor works? In this publication, we will dissect this soil moisture sensor and explain its function.
Sensor Components
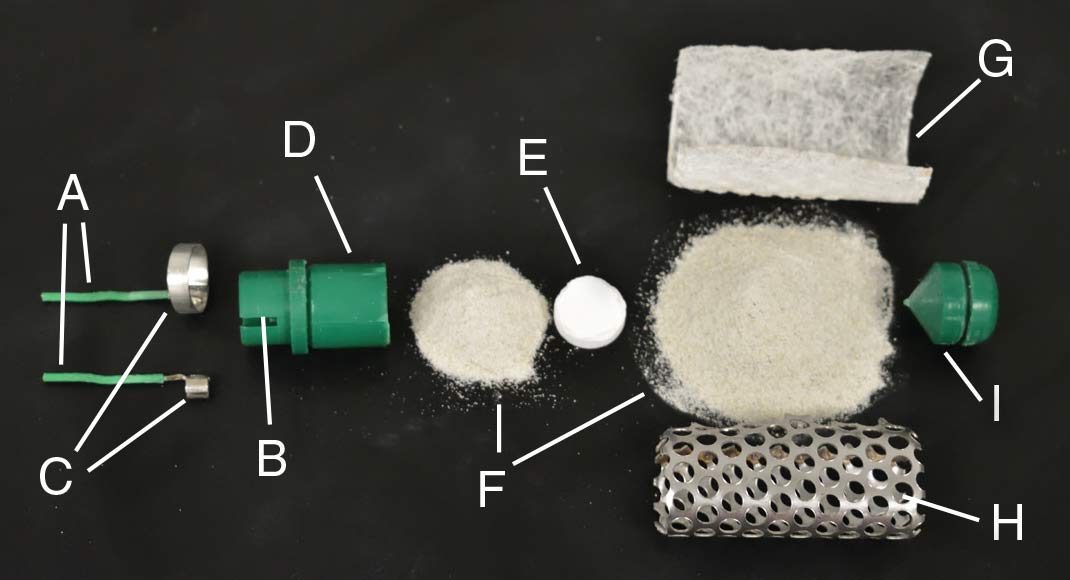
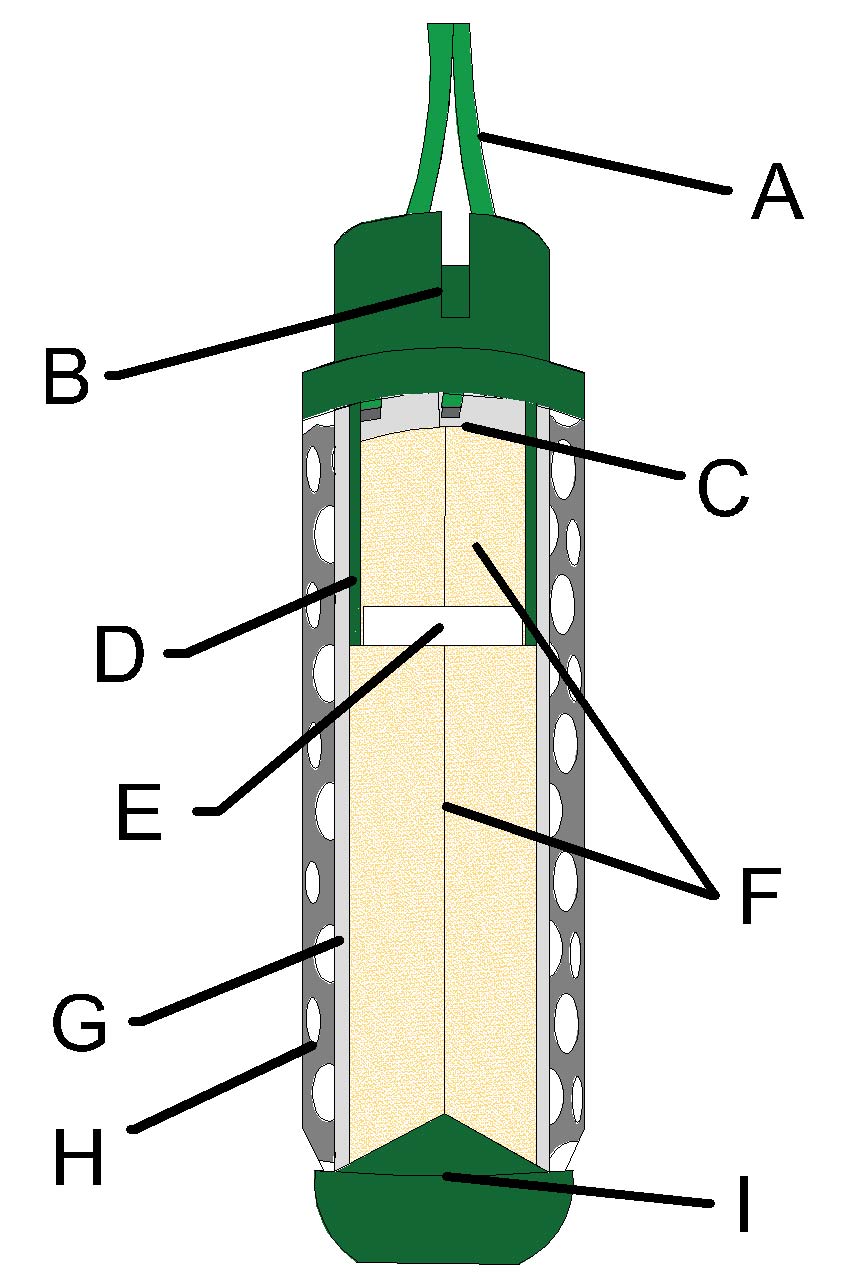
The following images show what a Watermark sensor looks like when it has been taken apart. Each component is labeled and described below.
Exploded View
Cutaway View
Legend
- Two 20 AWG wires: electrical connectors between the measurement device (e.g., datalogger) and the electrodes (C)
- Weep slot: drain for standing water above the sensor sleeve (D)
- Two electrodes: concentric, ring-shaped, stainless-steel bands; the measurement device reads the electrical resistance between these bands
- ABS sensor sleeve: compartment whose water content changes the electrical resistance between the electrodes (C)
- Gypsum wafer: source of salinity buffering for water inside the sensor sleeve (D)
- Loose, graded sand: material that water moves through between the outside soil and the electrodes (C)
- Mesh fabric: filter that allows water but not sand (F) to pass through
- Steel cage: protection for the mesh fabric (G)
- ABS plug: cap for the bottom of the sensor
Wetting and Drying
A porous material pulls water into its pores more strongly when it is dry than when it is wet. The strength of this pull can be referred to as tension, which is measured in centibars (cb). Just as a wet pool of water will soak into a dry sponge, water in the soil will flow from a point of lower tension to a point of higher tension.
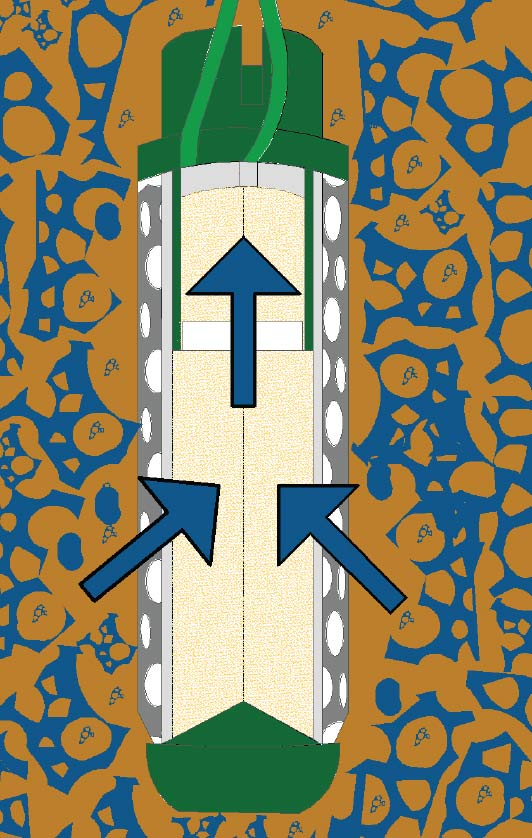
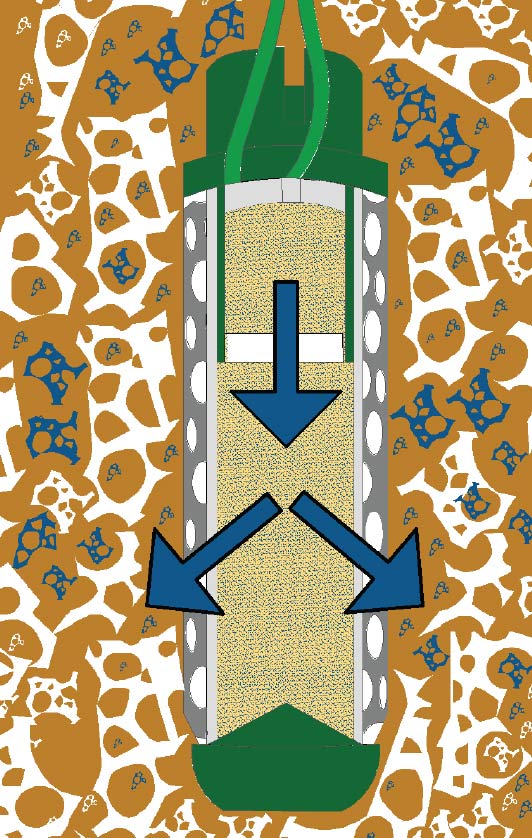
If a Watermark sensor has good contact with the soil, water can move freely between the outside soil and the sand inside the sensor until tension is equal at both places. When the soil outside is wetting and has a lower tension than the sand inside the sensor, water flows from the soil into the sensor as in diagram A. When the soil outside is drying and has a higher tension than the sand inside, water flows from the sensor into the soil as in diagram B.
A. Water Absorption When Wetting
B. Water Release When Drying
Determining Tension
Increasing the tension inside the sensor decreases the water content inside the sensor sleeve, which in turn increases the electrical resistance between the electrodes. The exact mathematical relationship that links the tension inside the sensor to the electrical resistance between the electrodes is called a calibration equation.
Using this calibration equation, the tension of the outside soil can be estimated from the electrical resistance between the electrodes by assuming that the tension of the outside soil equals the tension inside the sensor. Yet if the sensor has poor contact with the soil or no longer follows the calibration equation (e.g., as components degrade over time), the estimated tension of the outside soil could be inaccurate.
Temperature Effects
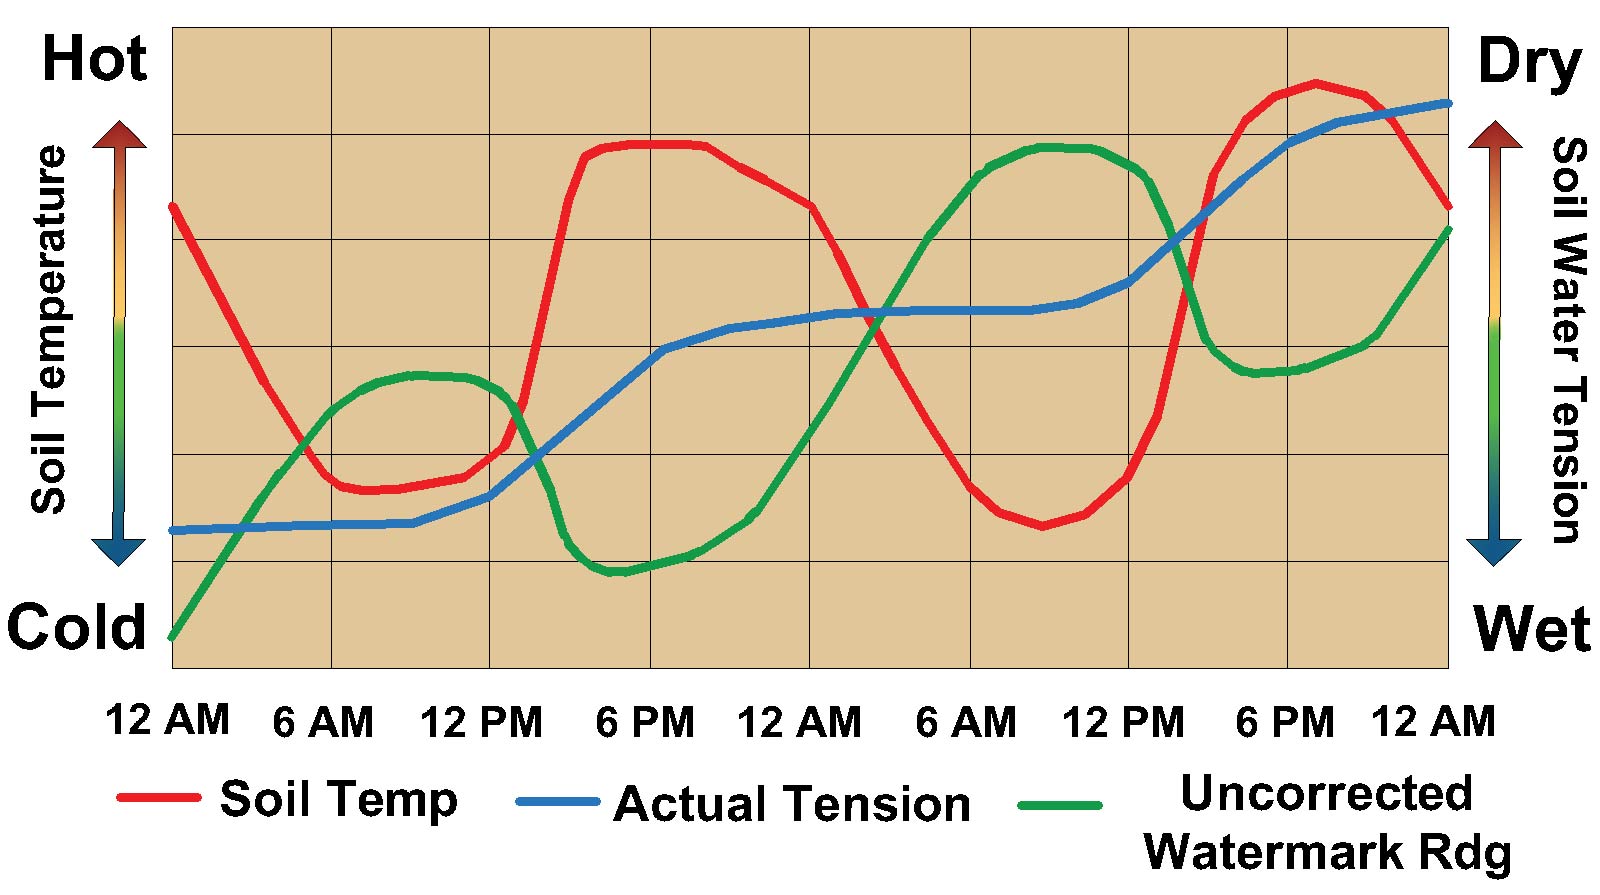
Watermark sensors are known to be affected by temperature. Given a constant actual tension of the outside soil, increasing the temperature inside the sensor sleeve decreases the electrical resistance between the electrodes. In turn, the estimated tension of the outside soil decreases.
For a 6-inch sensor early in the season, the graph below illustrates how soil temperature fluctuations can alter the day-night trend in Watermark readings. Nevertheless, temperature-based corrections have not been recommended for agronomic crops in Mississippi because uncorrected Watermark readings are averaged across multiple depths to schedule multi-day irrigation cycles when the crop canopy tends to be large.
For more information, please contact Extension Irrigation Specialist Drew Gholson at drew.gholson@msstate.edu or (662) 390-8505.
This publication is a contribution of the National Center for Alluvial Aquifer Research (NCAAR), the Mississippi State University Extension Service, and the Row-Crop Irrigation Science Extension and Research (RISER) initiative. NCAAR is supported by the Agricultural Research Service, United States Department of Agriculture (USDA), under Cooperative Agreement number 58-6001-7-001. RISER is supported jointly by Mississippi Soybean Promotion Board, Mississippi Corn Promotion Board, Mississippi Rice Promotion Board, Cotton Incorporated, Mississippi Peanut Promotion Board, and by USDA’s Natural Resources Conservation Service under Conservation Innovation Grant number NR203A750008G007.
The information given here is for educational purposes only. References to commercial products, trade names, or suppliers are made with the understanding that no endorsement is implied and that no discrimination against other products or suppliers is intended.
Publication 3536 (POD-09-24)
By Jacob Rix, former Extension/Research Associate; Himmy Lo, PhD, Assistant Extension/Research Professor; Drew Gholson, PhD, Assistant Professor and Coordinator, NCAAR, and Mark Henry, Extension Associate II, Delta Research and Extension Center.
The Mississippi State University Extension Service is working to ensure all web content is accessible to all users. If you need assistance accessing any of our content, please email the webteam or call 662-325-2262.


