Final Report: Survey of Overlooked Costs of the 2019 Backwater Flood in the Yazoo Mississippi Delta
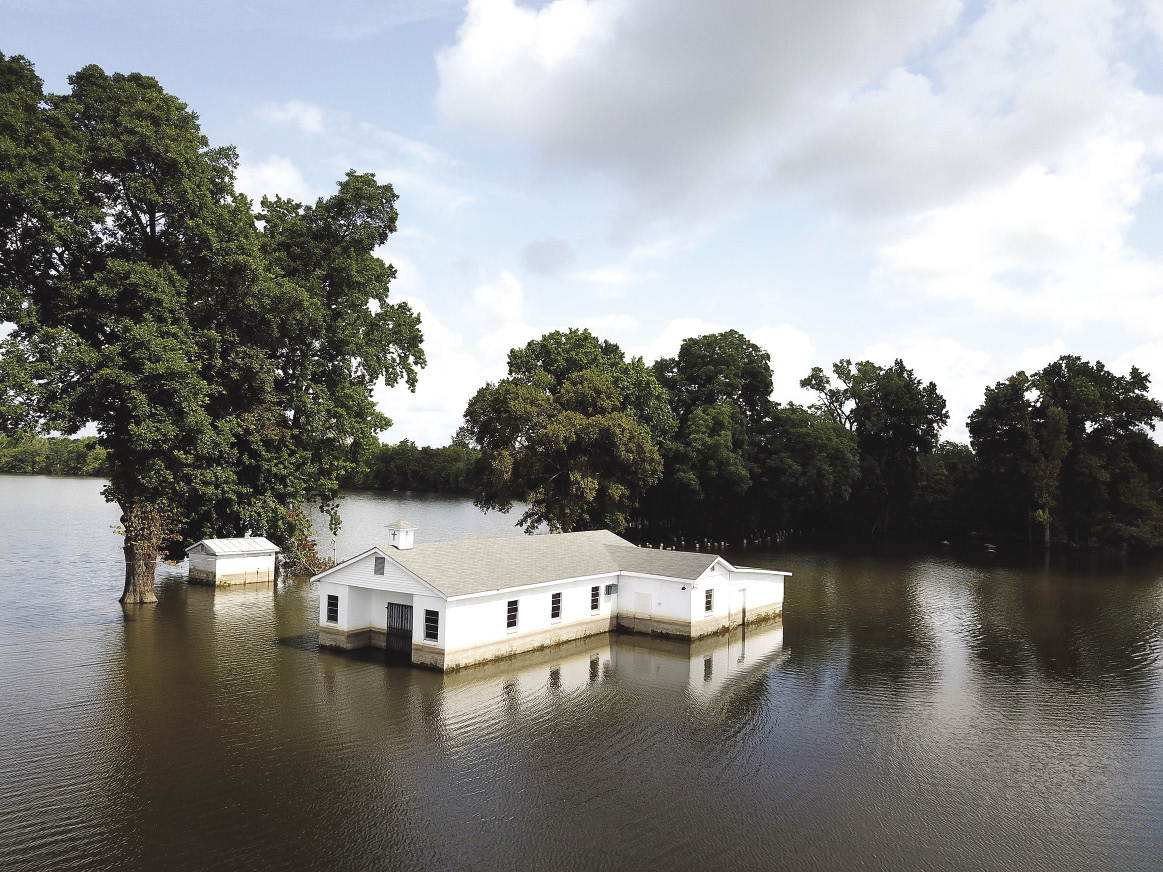
Near Redwood, Mississippi (July 29, 2019) — Aerial view of church and cemetery destroyed by backwater flooding. The images in this publication were taken by Mary Catherine Brooks as part of the “Forgotten Backwater Flood” social-media project to publicly document the historical event in real-time to raise awareness of the results of the backwater flooding and flood control efforts.
KEY RESULTS
-
$42,160 per affected household in self-assessed costs to deal with the flood that are not expected to be covered by insurance or assistance programs.
-
$3,217 per resident in average additional commuting distance and time.
-
$5,183 per worker on average missed days and hours of work.
-
69% of workers report a reduction in work productivity as result of stress and fatigue associated with the flood.
The Yazoo Backwater Area covers approximately 926,000 acres in the southern counties of the Mississippi Delta (Figure 1). At the southernmost location is the Steele Bayou Drainage Structure, which is the exit point of drained water from 4,093 square miles (2.62 million acres) of land in the Mississippi Delta. Due to the system of levees along the Mississippi River, the area becomes flooded when the elevation of the Mississippi River reaches a high enough level for it to backflow into the Yazoo River. This backflow impedes the Steele Bayou Structure from releasing the water from precipitation in the Delta into the Yazoo River.
Over 41 percent of the land area of the continental U.S. drains through the Mississippi River. Precipitation in this area was more than 20 inches above normal in 2018. At Greenville, Mississippi, the river surpassed the average stage (water level) in late August 2018 and remained near the record stage until mid-July 2019. It established new record stages eight times: September, October, and November 2018; and February, March, April, June, and July 2019 (Source: Chief Engineer Peter Nimrod, Mississippi Levee Board). These simultaneous high waters and record-setting precipitation throughout Mississippi caused the Backwater Flood of 2019, resulting in 548,000 acres flooded by May 2019, hundreds of damaged homes, and three highways closed.
The Yazoo Backwater Project lacks a pumping station that was part of the original design and would have prevented flooding on 194,000 acres. Chief Engineer Nimrod asserts that the pumps also would have prevented highway closures and all of the residential flooding. These pumps were not completed due to objections from the Environmental Protection Agency (EPA) on concerns about the impact of the project on wetlands in the backwater area. The U.S. Army Corps of Engineers officially issued the Yazoo Backwater Project Final Report on November 16, 2007. EPA executed a veto of the project on August 31, 2008. A series of lawsuits ensued.
Because farmland covers approximately one-half of the area, the issue is often framed as a trade-off between agricultural and environmental losses. However, the economic and social costs to the vulnerable population in the area, although important, have been largely overlooked. While federal and state disaster assistance only applies to homes, businesses, or land damaged by flooding, affected residents incur a number of additional costs associated with the loss of household income, protecting homes against rising water, increased commute distances, and the need for finding proper transportation in flooded areas. To address this gap in knowledge, the Mississippi State University Delta Region Extension office in conjunction with faculty at the Delta Research and Extension Center conducted an online survey of the overlooked costs incurred by residents of the backwater area. In addition to estimates of economic losses reported by U.S. Department of Agriculture Farm Service Agency (USDA-FSA), U.S. Army Corps of Engineers (USACE), and Mississippi Emergency Management Agency (MEMA), the results from this survey will contribute to better informing stakeholders and the general public about the impacts of the Backwater Flood of 2019.
The online survey received 408 complete responses between July and October 2019. The questions were formulated to estimate the cash outlays and lost household income associated with the Backwater Flood of 2019. No identifying information was collected.
Results
Property types and insurance coverage
Almost all of the respondents were materially affected by the backwater flood (89.52 percent). The types of properties owned, rented, or leased by respondents include homes (66.47 percent); recreational areas, such as hunting or fishing grounds (35.63 percent); and businesses (20.96 percent). Table 1 details the timeline in which respondents started to be affected by the backwater flood. More than two-thirds of them started being affected by the flood between February and March 2019.
Only 39 percent of respondents carried flood insurance coverage. Flood insurance was not required or previously warranted for these homes. The vast majority (75 percent) do not expect to collect any payments from their insurance, but 15.58 percent of respondents expect to collect more than $30,000 in claims. The average expected claim payout from insurance is $19,316.28; however, even those expecting to collect insurance payments anticipate their costs to exceed the claimed amounts.
Out-of-pocket expenses
In terms of out-of-pocket expenses, the average cash outlay amount is $42,160. However, 72.41 percent of respondents estimate their out-of-pocket expenses will be less than $40,000. Approximately 29.75 percent of respondents expect to spend between $1,000 and $5,000 out of pocket. Table 2 summarizes the reported estimates for overall out-of-pocket expenses. Table 3 provides detailed information about the categories and distribution of out-of-pocket expenses.
Contracted services account for an average of $13,307 in out-of-pocket expenses. This expenditure category describes payments to build protective structures, such as levees or barriers, to keep the rising waters away from the home as much as possible. Many residents resorted to building levees with sandbags, while others were able to contract sturdier structures. Most respondents took low-cost approaches; 27.34 percent spent $0 to $1,000, and 26.57 percent spent between $1,001 and $5,000 for these protective measures. About a third of respondents (32.03 percent) spent between $5,000 and $20,000. Approximately 14 percent spent more than $20,000 in contracted services.
In order to maintain the physical barriers and manage the added challenges of energy black-outs and lack of services, many residents of the backwater area needed to purchase additional equipment to deal with the flood. The average reported flood-related equipment expenditure was $4,375, with 51.85 percent of respondents spending less than $1,000 in this category. Only 19.44 percent of respondents indicated expenditures in excess of $5,000.
As the rising water started to affect the electric grid and the roadway network, residents of the backwater area resorted to the use of generators and alternative commuting routes that increased the amount of fuel they consumed. The survey indicates that respondents spent $2,440 in additional fuel due to the flooding. Approximately two-thirds of those reporting spent less than $1,000 and 31.61 percent report spending between $1,000 and $5,000. Only 3.87 percent of respondents claimed fuel expenditures in excess of $5,000.
Another major out-of-pocket expense category was “Materials and Supplies.” Respondents estimated an average of $12,214 in expenses on materials and supplies to deal with the flooding at their homes. Approximately two-thirds of respondents estimated this amount to be less than $5,000, but 15.76 percent estimated expenses would exceed $20,000.
Some people vacated their homes and found temporary housing as waters continued to rise and their precarious levees and barriers started to fail. The average estimated expenditure on relocation was $4,853. Presumably, many had access to low-cost options such as living with relatives. More than 16.5 percent of respondents indicated they had no relocation expense, while 6.61 percent claimed to have spent less than $1,000. The majority of respondents (57.03 percent) reported spending between $1,000 and $5,000. Only 7.44 percent of respondents claimed to have spent more than $10,000 in relocation.
The survey asked participants how much they may have spent on other unspecified categories. A relatively high average amount of $20,216 was reported. However, nearly 81 percent of respondents claimed expenses of less than $20,000 in other categories. In fact, nearly 70 percent of respondents indicated expenditures of no more than $10,000, and 27.18 percent indicated spending less than $1,000 in unspecified expenses. There are four responses that greatly influenced the overall average. These were from respondents who included items such as rebuilding of structures and roads related to businesses or lost farm income. Excluding those observations reduces the average expense on other categories to $11,335. Below is a list paraphrasing the descriptions of these categories offered by respondents:
- Tractor used for transportation from home to road needed clutch repairs due to operation under water.
- Raising appliances above water or replacing them.
- Food, water, and supplies for volunteers helping with defenses or recovery.
- Debris removal.
- Parts and repairs for boats used in commute.
- Stolen tools and equipment.
- Utility costs for unused facilities to reduce mold.
- Legal fees to file bankruptcy.
- Roll-off dumpster rentals.
- Lost storage sheds, shops, and auxiliary structures.
- Off-site pet care.
|
Month |
Number of respondents |
Percentage of responses |
Cumulative percentage |
|
October |
1 |
0.30 |
0.30 |
|
November |
5 |
1.50 |
1.80 |
|
December |
5 |
1.50 |
3.29 |
|
January |
44 |
13.17 |
16.47 |
|
February |
109 |
32.63 |
49.10 |
|
March |
114 |
34.13 |
83.23 |
|
April |
21 |
6.29 |
89.52 |
|
May |
30 |
8.98 |
98.50 |
|
June |
3 |
0.90 |
99.40 |
|
July |
2 |
0.60 |
100.00 |
|
Total |
334 |
- |
- |
|
Expected out-of-pocket ($) |
Number of respondents |
Percentage of responses |
Cumulative percentage |
|
0 to 1,000 |
10 |
4.31 |
4.31 |
|
1,001 to 5,000 |
65 |
28.02 |
32.33 |
|
5,001 to 10,000 |
37 |
15.95 |
48.28 |
|
10,001 to 20,000 |
34 |
14.65 |
62.93 |
|
20,001 to 40,000 |
22 |
9.48 |
72.41 |
|
40,001 to 100,000 |
46 |
19.83 |
92.24 |
|
100,001+ |
18 |
7.76 |
100.00 |
|
Total |
232 |
- |
- |
|
Average |
$42,160 |
||
|
Out-of-pocket ($) |
Contracted |
Equipment |
Material & supplies |
Extra fuel |
Relocation |
Other expenses |
||||||
|
|
Percent |
Cum. percent |
Percent |
Cum. percent |
Percent |
Cum. percent |
Percent |
Cum. percent |
Percent |
Cum. percent |
Percent |
Cum. percent |
|
0 to 1,000 |
27.34 |
27.34 |
51.85 |
51.85 |
30.91 |
30.91 |
64.52 |
64.52 |
23.14 |
23.14 |
27.18 |
27.18 |
|
1,001 to 5,000 |
26.57 |
53.91 |
28.71 |
80.56 |
33.94 |
64.85 |
31.61 |
96.13 |
57.03 |
80.17 |
33.01 |
60.19 |
|
5,001 to 10,000 |
15.62 |
69.53 |
11.11 |
91.67 |
9.69 |
74.55 |
1.93 |
98.06 |
12.39 |
92.56 |
9.71 |
69.90 |
|
10,001 to 20,000 |
16.41 |
85.94 |
3.70 |
95.37 |
9.69 |
84.24 |
0.00 |
98.06 |
4.13 |
96.69 |
10.68 |
80.58 |
|
20,001 to 50,000 |
8.59 |
94.53 |
3.70 |
99.07 |
10.31 |
94.55 |
1.29 |
99.35 |
2.48 |
99.17 |
8.74 |
89.32 |
|
50,001 to 100,000 |
4.69 |
99.22 |
0.93 |
100.00 |
3.63 |
98.18 |
0.65 |
100.00 |
0.83 |
100.00 |
6.80 |
96.12 |
|
100,001+ |
0.78 |
100.00 |
|
|
1.82 |
100.00 |
|
|
|
|
3.88 |
100.00 |
|
Number |
128 |
108 |
155 |
165 |
121 |
103 |
||||||
|
Average |
$13,307 |
$4,375 |
$2,440 |
$12,214 |
$4,853 |
$20,216 |
||||||
Employment and productivity
The backwater flood affected employment and worker productivity. Rising waters caused businesses to suspend operations. Some affected employees were fortunate enough to remain employed, but they needed to devote important amounts of time and effort to protect their possessions against the flood and navigate a roadway infrastructure challenged with closures and detours.
About a third of respondents are retired, while 63.18 percent reported being employed. Only 4.33 percent of participants indicated being unemployed. Among the unemployed, two-thirds were victims of business closures or flooded cropland in the backwater. Among those currently employed, a third were self-employed, more than a fourth were hourly workers, and more than 40 percent were salaried.
As of July 1, 2018, the U.S. Census Bureau estimated that the mean travel time to work, by county, was 22.7 minutes in Humphreys, 24.7 minutes in Issaquena, 21.4 minutes in Sharkey, 18.5 minutes in Warren, and 27.2 minutes in Yazoo. The Backwater Flood survey asked about total driving time, rather than “travel time to work.” Respondents indicated an average preflood normal total daily driving time of 33.75 minutes on weekdays and 34.38 minutes on weekends. The slight discrepancies between the census and survey estimates may be due to the difference between “total” and “to work” driving time, but it may also reflect a larger proportion of affected people living outside city limits with longer commutes.
|
Time cost |
Mileage cost |
||
|
Extra time (minutes/day) |
61.69 |
Extra miles/day |
49.23 |
|
Days/week |
3.99 |
Days/week |
3.99 |
|
Total weekly hours |
4.11 hours |
Total weekly miles |
196.43 |
|
Average wage rate1 |
$17.18/hour |
Mississippi mileage cost2 |
$0.58/mile |
|
Time opportunity cost |
$70.61 /week |
Mileage cost |
$113.93 /week |
|
Affected period (weeks) |
~17.43 |
Affected period (weeks) |
~17.43 |
|
Cost additional time |
$1,230.73 |
Cost additional miles |
$1,985.80 |
1Mississippi Department of Employment Security, all occupations, average for 3 years ending in May 2018.
2Mileage rate from Mississippi Department of Finance and Administration, accessible at http://www.dfa.ms.gov/media/7821/2019-mileage-reimbursement-rate.pdf.
|
Lateness1 |
Missed work |
||
|
Average delay (hours) |
6.59 |
Days missed |
1.34 |
|
Late days/week |
1.52 |
Hours/day |
8 |
|
Total late hours |
4.11 hours |
Hours/week |
10.72 |
|
Average wage rate2 |
$17.18/hour |
Average wage rate2 |
$17.18/hour |
|
Time opportunity cost |
$113.22 /week |
Missed days cost |
$184.17 /week |
|
Affected period (weeks) |
~17.43 |
Affected period (weeks) |
~17.43 |
|
Cost additional time |
$1,973.36 |
Cost missed work |
$3,210.08 |
1Lateness cost may be partially double counted in opportunity cost of extended commuting.
2Mississippi Department of Employment Security, all occupations, average for 3 years ending in May 2018.
In any case, the many road closures and detours that were necessary due to flooding caused people living in the outskirts of towns and cities to change their normal commutes. Average driving times increased by 61.69 minutes and 49.23 miles on weekdays and by 64.42 minutes and 51.91 miles on weekends. Table 4 describes a calculation of the opportunity cost of the additional time and mileage involved in flood-time commuting. The calculation was based on Mississippi Department of Employment Security information on average wages and the Mississippi Department of Finance and Administration established rates for mileage reimbursement for private vehicle use. It yielded an average of $3,216.53 per driver over an estimated 17.43 weeks of driving under flooding conditions. The Delta Council Review reported on October 2019 that 651 homes were affected by the flooding conditions. Considering a single driver per household, the opportunity cost of additional commute adds up to over $2 million aggregate. However, it is most likely that more than one driver lived in each household. With two drivers in the household, the estimate may exceed $4.1 million in opportunity costs.
|
Mode |
Yes |
Freq. |
No |
Freq. |
N |
|
Boat |
41.82% |
69 |
58.18% |
96 |
165 |
|
All-terrain vehicles |
24.81% |
33 |
75.19% |
100 |
133 |
|
Tractor |
14.50% |
19 |
85.50% |
112 |
131 |
|
Other |
13.27% |
15 |
86.73% |
98 |
113 |
With longer and more difficult commutes, it is expected that affected workers might have arrived late to work or missed it altogether. Participants reported being late on average 1.52 days per week with an average tardiness of 6.59 hours per week. This tardiness is at least partially captured in the increased commuting time. For hourly workers, the tardiness might have caused lower paychecks, placing the burden on the worker. For salaried workers, the burden of the tardiness might have been carried by the employer. The estimated cost per worker is approximately $1,973.36. Assuming two workers per household, the overall cost of tardiness may be valued at $2.5 million. Similarly, respondents indicated an average of 1.34 days of work missed altogether per week with an estimated cost of $3,210.08 per worker for the affected period. With two workers per household, the overall cost of missed work may be more than $4 million. Table 5 details the per-worker estimated cost of tardiness and missed work days.
In addition to added mileage and time to daily commutes, the flood created a need to use multiple modes of transportation for people whose homes were affected by flooding but who did not or could not relocate. Almost 42 percent of respondents had to resort to alternative means of transportation between their homes and open roadways (Figure 2). Table 6 summarizes the main alternative means of transportation employed, with boats being the most frequently used (41.8 percent), all-terrain vehicles (24.8 percent), tractors (14.5 percent), and other means (13.27 percent). Some of the “other” means used include walking in waders, driving trucks through the flood, and walking on dirt levees to the road.
While the flood had a notable impact in terms of work attendance, respondents indicated that their productivity at work was also affected (Figure 3). Almost 70 percent of respondents indicated their productivity worsened during the flood. A change in productivity is an important economic indicator, as it is closely associated with changes in employment and wage levels. The actual change in productivity and its estimated impacts will have to be measured later when more data on economic output and labor force for this period becomes available. Economic theory suggests that when worker productivity drops below a certain point, it is to be expected that employment will be in peril. Approximately 42 percent of respondents believe their employment is at risk due to the flooding. When asked what led them to that belief, they offered explanations that are in line with the following sample of paraphrased responses:
- Professionals providing services to agricultural sector.
- Low-wage employment requiring extended commute resulted in “losing proposition” for worker.
- Missing work without notice to deal with emerging issues in home flood defense.
- Business closures.
- Frequently late to work due to extended commute.
- Caregivers whose patients were relocated by family to areas outside the backwater area.
- Had to retire due to extended commute under tremendous stress.
- Inadequate sleep.
- Car accidents due to associated fatigue.
- Unable to focus on working with worries of flooding and cleanup.
In summary, estimates of economic losses produced by different agencies, including the USDA-FSA, USACE, and MEMA, often overlook out-of-pocket costs that residents incur as they try to prevent or remedy the flooding of their homes. This survey supplements those estimates by providing an overview of these overlooked expenses and some of the human costs caused by the Backwater Flood of 2019 in the southern Delta of Mississippi.
The out-of-pocket expenses reported in this open online survey involve small amounts compared to the large agricultural losses in the region. However, the amounts are relatively large for the most vulnerable people in the area. Furthermore, the actual costs of residential home repairs will not be known for months after the waters fully recede. Nonetheless, the estimates presented here can help construct a narrative of an event of such catastrophic magnitude as the Backwater Flood of 2019.
Appendix: Brief Narrative of the 2019 Backwater
Flood in the Yazoo Mississippi Delta
The 2019 Yazoo Backwater Area flood was one of epic proportion. This rural area, commonly referred to as the South Delta, includes five counties and makes up approximately 1,550 square miles of alluvial valley in the lower Yazoo Basin of Mississippi. It suffered record-setting rainfall from October 2018 through June 2019—the greatest amount since 1895. The Mississippi River at Vicksburg exceeded flood stage for 162 days, the longest flood stage since the Great Flood of 1927. The Yazoo Backwater Area flooded for 219 consecutive days with water above 87 feet elevation from January 4 until August 10, reaching a record crest of 98.2 feet on May 23.
Backwater inundated 548,000 acres, 231,000 acres of which were prime cropland. Media reports cite that agricultural damages and losses are expected to exceed $800 million. In an area where agriculture is the primary source of economic activity, prolonged backwater flooding placed direct hardship on farming operations and resulted in spiking unemployment rates.
Hundreds of residents, including minor children, were displaced. Many were left homeless due to the extent of the flooding; 686 residential homes and hundreds of recreational homes and properties were flooded or destroyed. Backwater overtopped three major highways, causing communities such as Eagle Lake to be completely isolated and inaccessible except by boat or the Yazoo Backwater Levee.
The wildlife population suffered greatly and lost nearly an entire generation. The flood degraded habitat quality and caused a significant amount of mortality as evidenced by the hundreds of corpses and piles of bones that were left spread across levees and small patches of high ground. Residents found remains of animals ranging from snakes to feral hogs in their homes as they returned to begin restoration efforts. Many private landowners and hunting clubs opted not to hunt during the 2019–20 seasons due to the devastation the wildlife faced, especially the white-tailed deer population.
The 2019 Yazoo Backwater Area flood tested the resilience of the community, citizens, farmers, landowners, business owners, and wildlife. Seven months of stagnant backwater filled with rotting animal corpses, agricultural chemicals, sewage, and garbage created years of future recovery work. Recovery efforts in the area are widespread and consistent toward building the region back after the overwhelming losses.
Delta Council and Delta Wildlife staff have compiled photographic and narrative records of the Backwater Flood of 2019. Part of the crowd-sourced compilation is accessible in the Facebook Community page “Forgotten Backwater Flood.”
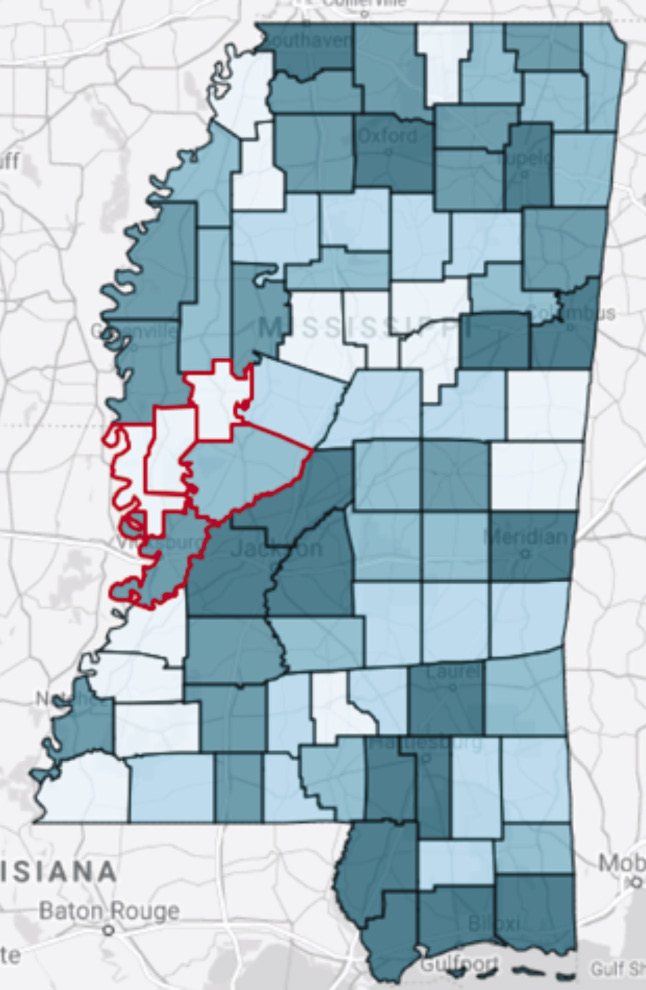
Figure 1. Map of Mississippi with backwater area counties in red outline.
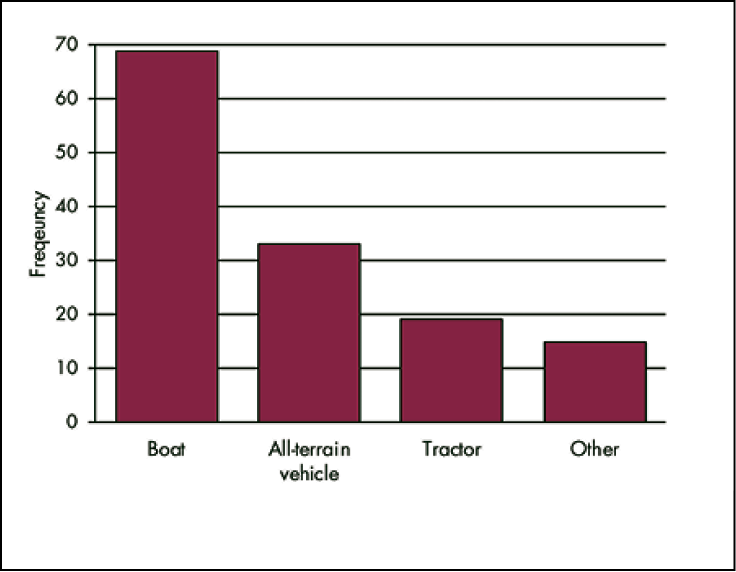
Figure 2. Number of respondents using alternative modes of transportation.
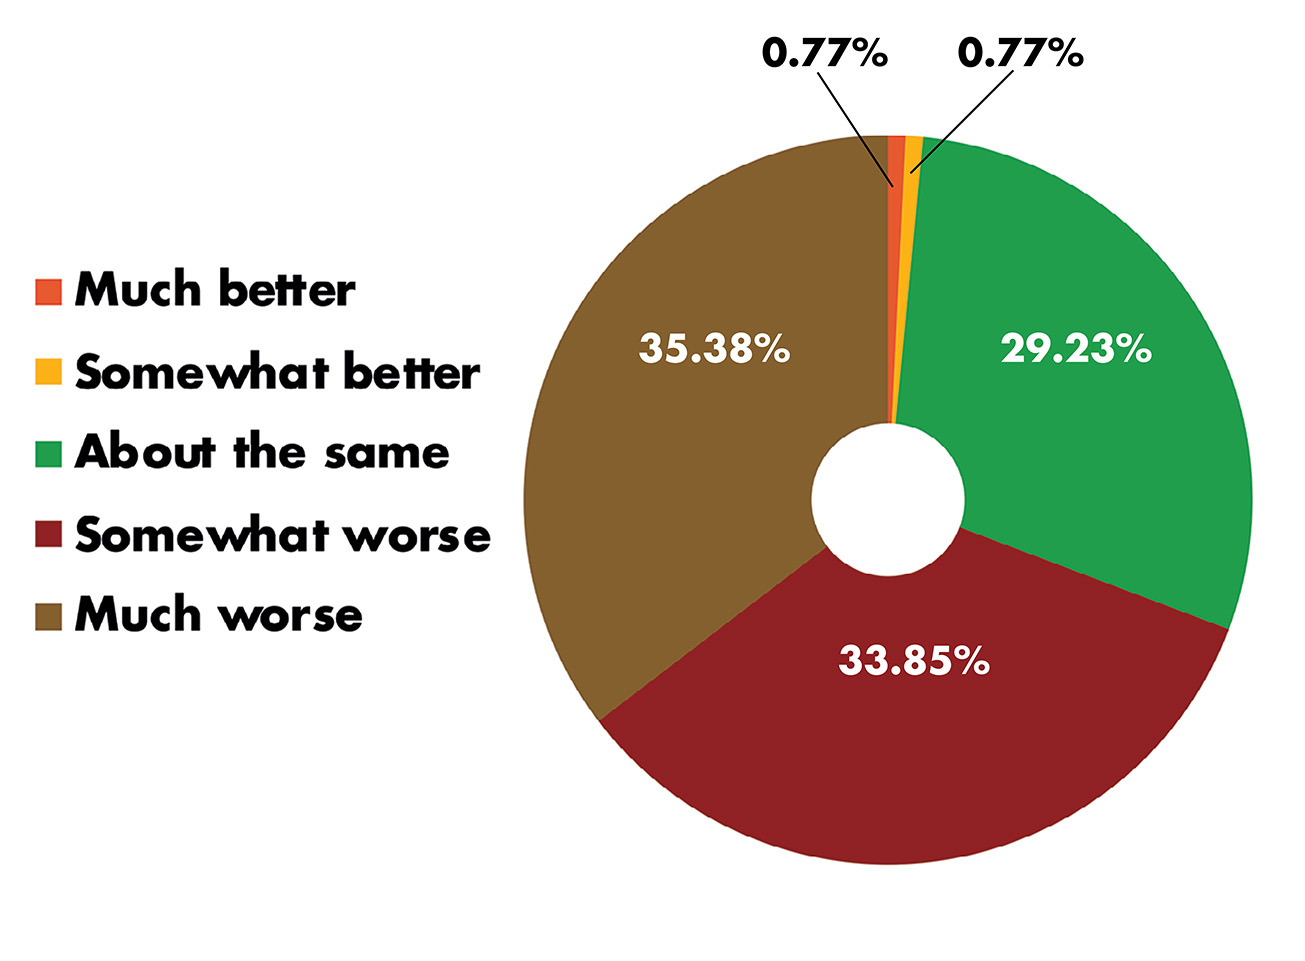
Figure 3. Self-assessed productivity impact of Backwater Flood.
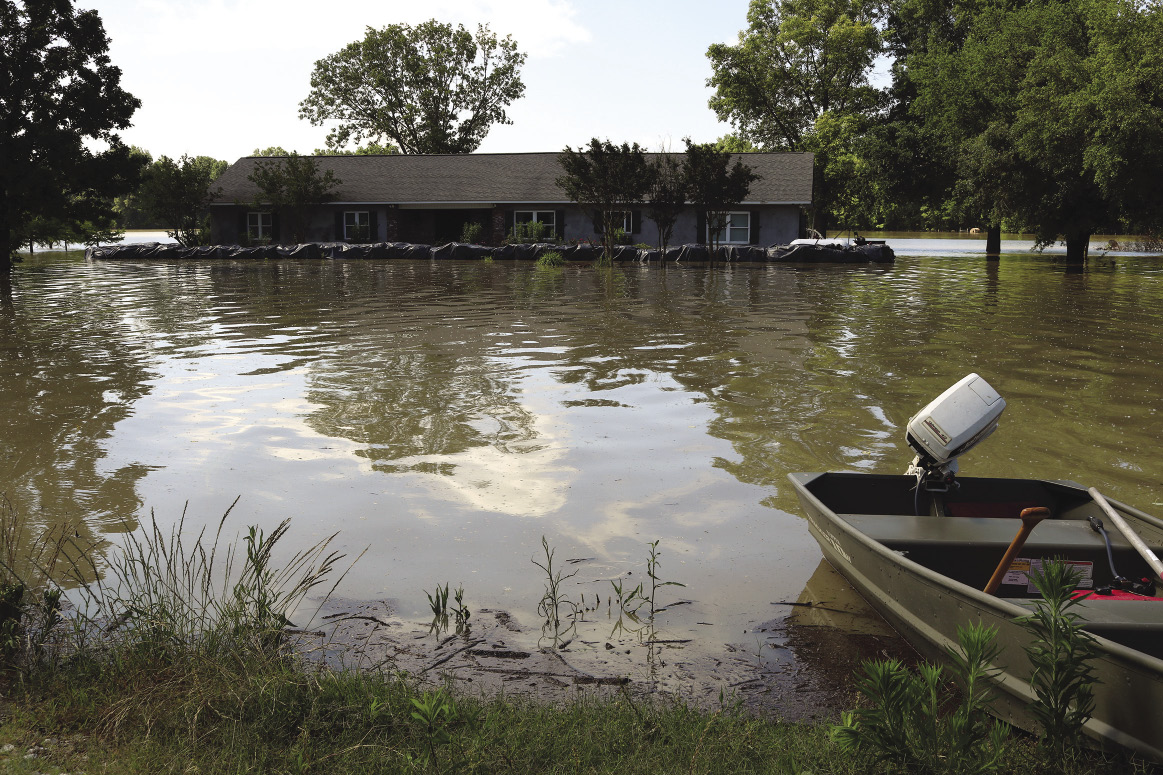
Rolling Fork, Mississippi (May 23, 2019) — Residential home with ring levee, pumps, and boat used to travel from house to road.
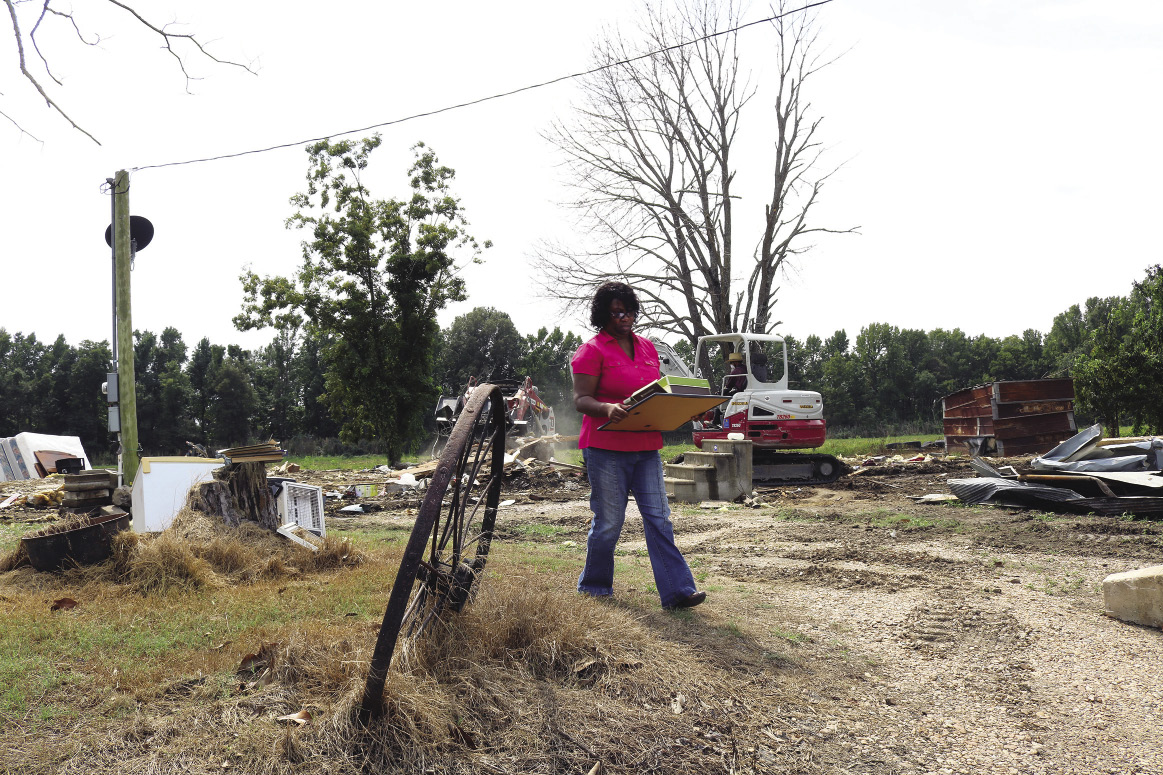
Fitler, Mississippi (September 20, 2019) — Homeowner collects items as Mennonite Disaster Service team demolishes flooded home.
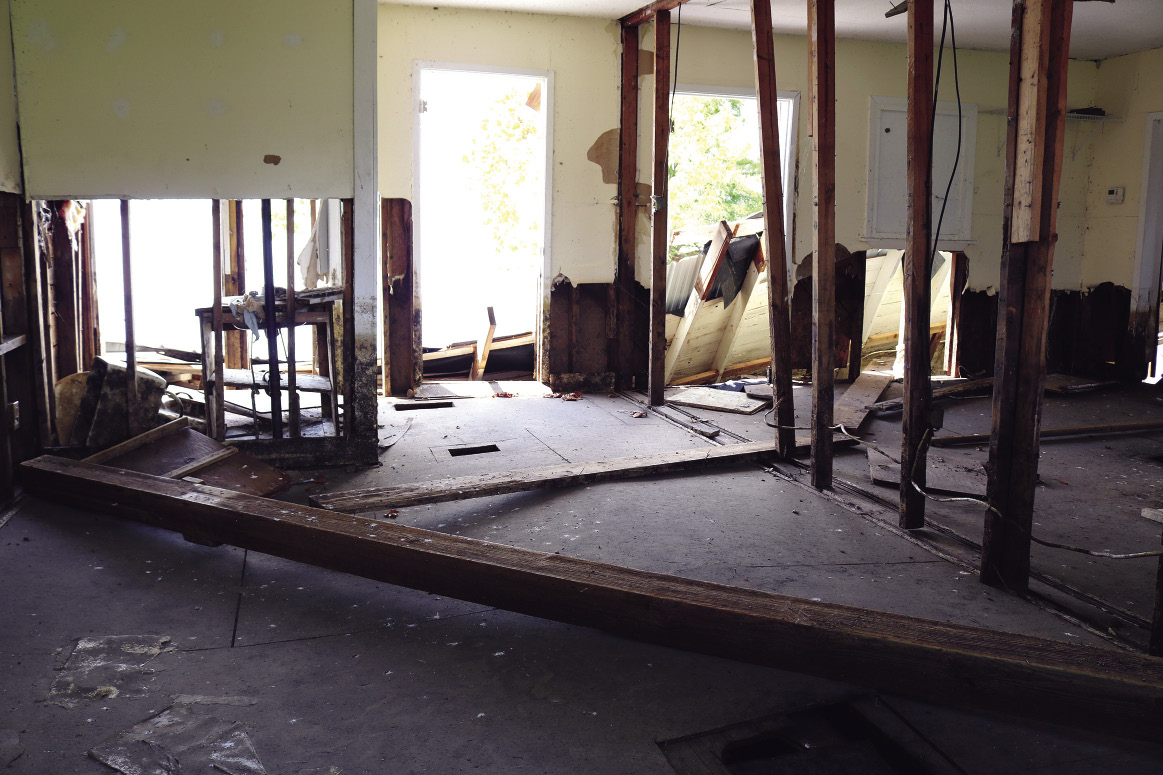
Eagle Lake, Mississippi (August 22, 2019) — Residence being gutted due to backwater flooding.

Yazoo Backwater Levee (July 27, 2019) — One of hundreds of emaciated deer pushed onto the levee in search of high ground and food.
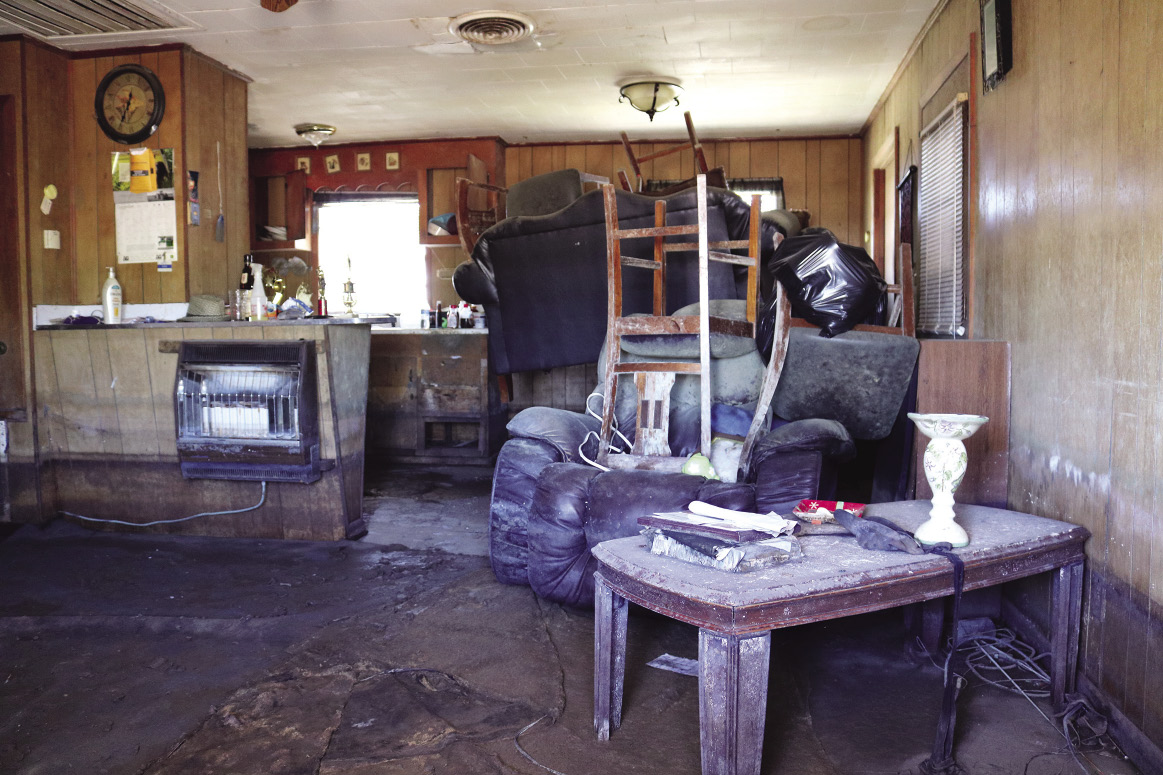
Goose Lake, Mississippi (August 15, 2019) — Residence after backwater receded, leaving the home uninhabitable.
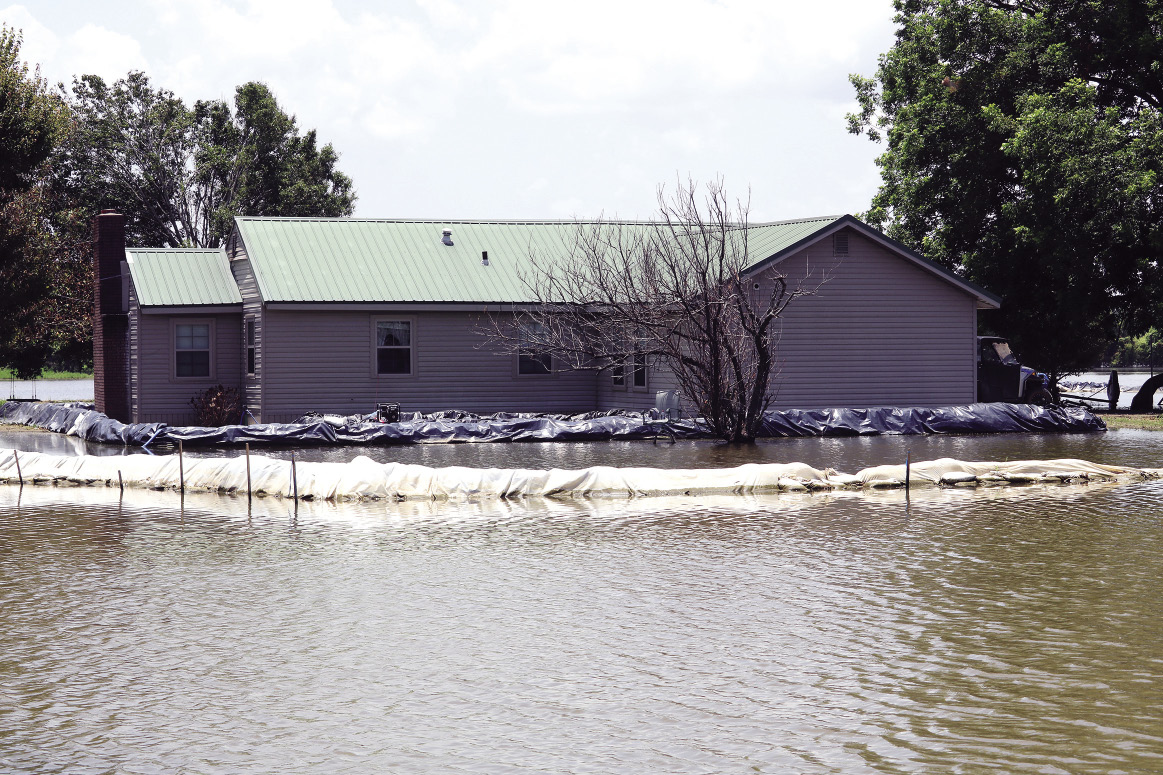
Valley Park, Mississippi (July 27, 2019) — Residence with multiple ring levees and pumps.
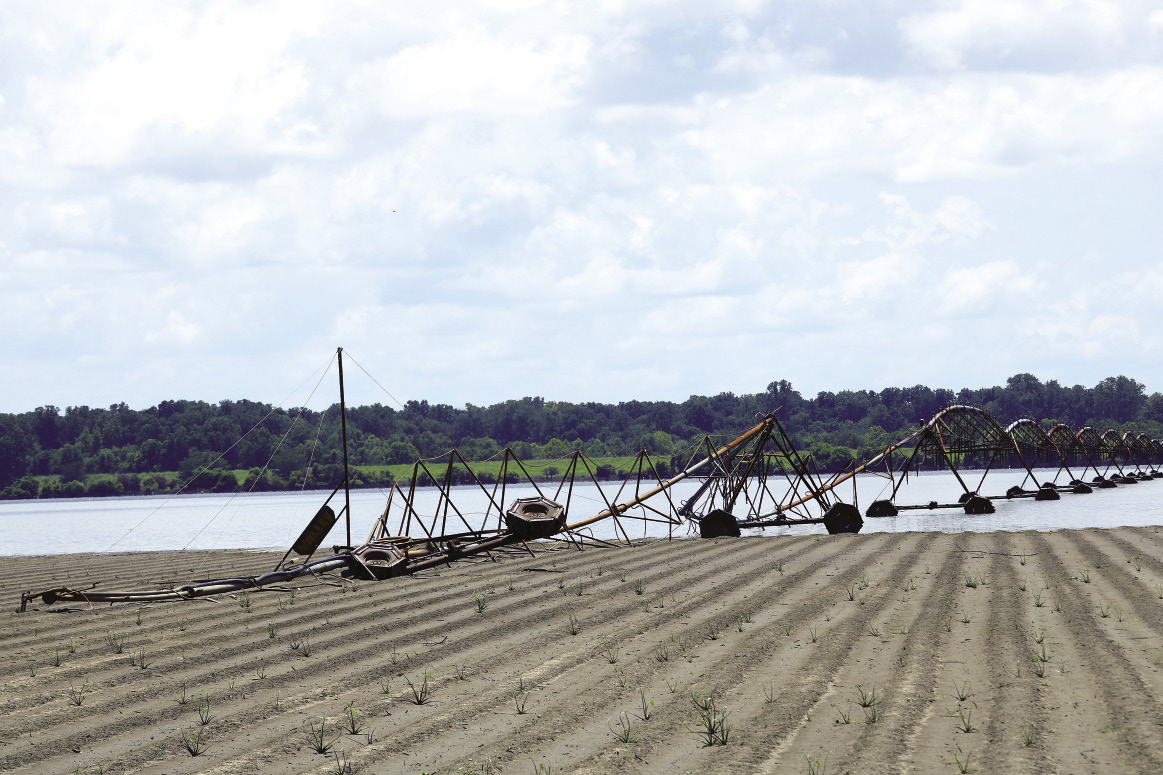
Eagle Lake, Mississippi (July 31, 2019) — Farm losses have a multiplying effect that reduce economic activity for businesses and workers that serve the farming community.
Publication 3418 (POD-2-20)
Prepared by Nicolas E. Quintana-Ashwell, PhD, Assistant Research Professor, Delta Research and Extension Center; Mary C. Brooks, Extension Associate, Delta Research and Extension Center; Richard C. Lacy, PhD, Extension Professor and Regional Extension Coordinator, Delta Research and Extension Center; Preston Aust IV, Extension Agent, Humphreys County; Emily Carter, Extension Agent, Sharkey County; Sandra Havard, Extension Agent, Warren County; and Phillip M. Vandevere, Extension Agent, Yazoo County.
Copyright 2020 by Mississippi State University. All rights reserved. This publication may be copied and distributed without alteration for nonprofit educational purposes provided that credit is given to the Mississippi State University Extension Service.
Produced by Agricultural Communications.
Mississippi State University is an equal opportunity institution. Discrimination in university employment, programs, or activities based on race, color, ethnicity, sex, pregnancy, religion, national origin, disability, age, sexual orientation, genetic information, status as a U.S. veteran, or any other status protected by applicable law is prohibited. Questions about equal opportunity programs or compliance should be directed to the Office of Compliance and Integrity, 56 Morgan Avenue, P.O. 6044, Mississippi State, MS 39762, (662) 325-5839.
Extension Service of Mississippi State University, cooperating with U.S. Department of Agriculture. Published in furtherance of Acts of Congress, May 8 and June 30, 1914. GARY B. JACKSON, Director
The Mississippi State University Extension Service is working to ensure all web content is accessible to all users. If you need assistance accessing any of our content, please email the webteam or call 662-325-2262.


