
Economic Impact of the Jasper County Calf Marketing Program
In today’s world of increasingly limited public funding, a growing amount of attention is placed on the value of public programs to specific audiences and to society. Policy makers, public leaders, and the public rightfully demand assurance that public investment into these programs and activities is beneficial.
This scrutiny includes Cooperative Extension, which draws its base resources from three distinct levels of public funding (federal, state, and local). In the case of many of its programs, Extension is examined by all three governmental levels to ensure that a positive return on public investment is being realized.
One of the more effective tools that can be used to evaluate the effectiveness of Extension programs is economic impact analysis. While a detailed description of this methodology is beyond the scope of this publication, economic impact analysis examines an economic event or “shock” to a local economy and estimates the economic spillover benefits or costs that occur in terms of spending, employment, employee wages, proprietor income, and additional value that is added to the economy. A demonstration of the evaluation of an Extension program using this type of analysis is applied to the Mississippi State University Extension Service’s Jasper County Calf Marketing Program (JCCMP).
History of the Sale
The JCCMP, which began more than 15 years ago, has a goal of producing more desirable feeder calves to increase local producer revenues, decrease costs, and, as a result, increase profits. The sale is coordinated by MSU Extension. Producers must follow these guidelines to participate in the sale:
- Calves must be born between November and January;
- Bulls are pulled from the pasture no later than May;
- Calves must be 90 to 95 percent solid color;
- Producers must follow a prescribed vaccine regimen that includes pre-wean vaccines, weaning vaccines, and 21-day post-wean vaccines (the vaccine regimen was developed using information from previous buyers and follows feedlot guidelines for the feedlots to which the calves will be shipped);
- Calves must be on feed or grazing between 60 and 90 days before the sale; and
- Producers must keep adequate documentation including vaccination records (vaccine lot numbers, dates when shots are administered, and vaccine expiration dates), separate steers and heifers with ear tags, and provide signed sales contracts.
While these guidelines could very well increase costs, these practices would likely be followed by quality-focused producers regardless of the sale venue. As such, the costs associated with these practices will not be considered in the economic impact analysis (although they likely should be considered in a budgeting or profitability analysis).
These guidelines provide a more consistent animal for purchase by buyers, and the hypothesis is that a more consistent group of animals will fetch higher prices for producers. Consistency in this context means that animals were produced with minimal cross breeding, are roughly the same size, have undergone the same vaccine regimen, and are weaned for a prescribed amount of time.
In addition, there are other benefits for the farmer. First, the JCCMP sale is local, and the nearest sale barn is an hour away, which suggests a substantial reduction in transportation costs. Second, cattle are weighed as soon as they are unloaded rather than several hours or as long as a day later as can be the case with a sale barn. This benefit reduces the amount of shrinkage in the animals’ base weights.
Also, the JCCMP does not charge yardage or insurance fees or commissions. Anecdotal evidence suggests that these costs run between 5 and 7 percent of the sale price of the animal. For a 600-pound steer that sells for $138.31 per hundredweight, this represents a cost to the producer between $41.50 and $58.09 per animal. These reduced costs, along with the unknown reduced transportation costs, are assumed to be captured in the price premium for this analysis.
Scope of the Analysis
The analysis has three goals: (1) to compare prices and revenues of animals marketed through the JCCMP sale with reported animals marketed through sale barns throughout the state in the same time period; (2) to utilize economic impact analysis to estimate economic spillover benefits that result from the change in revenue due to the producer participating in the sale; and (3) to provide an overview of the procedure used to evaluate the economic impact of an Extension program is presented.
It is important to recognize that this relatively simple analysis does not purport to account for or explain the differences in sale price between the JCCMP sale and the commercial sales used as a baseline. This would be an intensive exercise that would require detailed data for both the JCCMP sale and the baseline commercial sales (see Williams, et al., 2014a and Williams, et al., 2014b). These data do not exist for the time period under consideration. Neither do we suggest that calves marketed through the JCCMP sale could not achieve the same price levels if they were marketed through a commercial sale and if relevant documentation regarding the required JCCMP guidelines were provided at the commercial sale.
Data
Prices for individual animals marketed through the sale were obtained for each JCCMP auction from 2017 through 2021. The data were categorized by consignor and included each individual animal’s pre- and post-shrinkage weight, selling price per pound (post-shrinkage weight), and the total sale price.
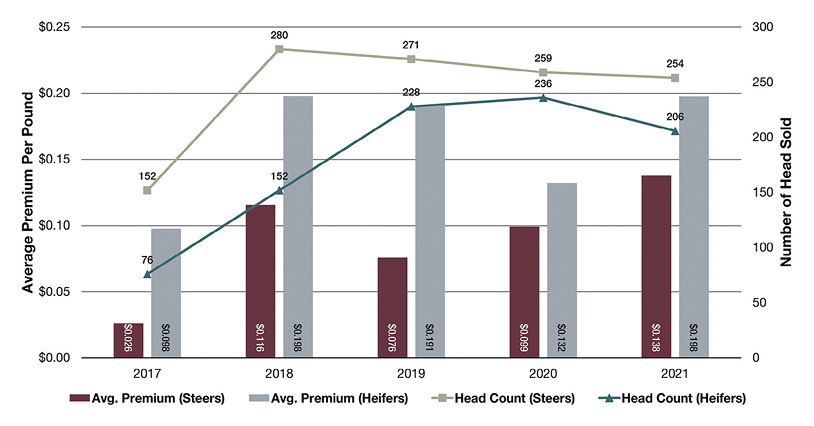
Figure 1 shows the number of head of steers and heifers sold through the JCCMP sale and the weighted average premium per head for each calf gender reported by participating in the sale. The total number of cattle entering the sale peaked at 499 head in 2019 but began to increase again in 2021. Steer and heifer prices both peaked in 2021 at $1.5120 per pound and $1.4432 per pound, respectively.
Baseline commercial market data was gathered from two separate timeframes in which the format of reported data changed significantly. Data from 2017 through 2019 consisted of weekly statewide statistics published by the Mississippi Department of Agriculture and Commerce (MDAC) and the USDA Agricultural Marketing Service (AMS) for steer and heifer calves. These data contained the weekly low, high, and average prices for steer and heifer calves by weight group. Since these data did not contain information regarding the number of head that were sold each week, the averages of all weekly sales for the entire state for each September through October of each year (2017, 2018, and 2019) were averaged to determine each year’s baseline (the September through October timeframe was chosen because that is the time of year when the JCCMP is held).
AMS changed the data collection and reporting system in 2020. This change resulted in a much richer data set in which steer and heifer calves were classified as distinct categories and sale data was reported by location; number of head in each lot; frame size; muscle grade; age; pregnancy status; minimum, maximum, and average weights of the lot; and the minimum, maximum, and average sale price per head for each lot. Sales were reported for 13 sale locations across the state in 2020 and 2021.
Sales locations reporting bred-animal prices for 2020 and 2021 included the Brookhaven Stockyard; Cattlemen’s Livestock (West Point, Mississippi); Grenada Stockyard; Lipscomb Brothers (Jackson, Mississippi); Lucedale Stockyard; Macon Stockyard; Meridian Stockyard; Peoples Livestock Auction (Houston, Mississippi); Philadelphia Stockyard; Southeast Livestock Exchange (Hattiesburg, Mississippi); Tadlock Stockyards (Jackson, Mississippi); Tylertown Stockyard; and Winona Stockyard.
Descriptive statistics for the JCCMP sale and commercial market sales baseline data for each year are provided in Table 1 (steers) and Table 2 (heifers). The estimated average premium for participating in the JCCMP was calculated by subtracting the Mean Commercial Sale Baseline Price/Animal from the Mean JCCMP Price/Animal and ranged from $0.0488 per pound in 2017 to $0.1831 per pound in 2018 for steers and from $0.441 per pound in 2020 to $0.1984 per pound in 2018 for heifers. Note that the JCCMP weighted average premiums are aggregate in nature and may not necessarily identify the true magnitude of the price difference if the same JCCMP cattle would have been sold at a commercial auction. Unfortunately, the data do not allow for a more extensive analysis. However, it is reasonable to assume that the cattle committed by producers to the JCCMP are of higher-than-average commercial quality and therefore garner an above-average commercial price as evidenced by the calculated premium. The JCCMP sale does provide a more consistent group of animals for buyers, and the guidelines followed by JCCMP farmers are expected to increase the feeding performance of the animal sold through the sale. In addition, JCCMP farmers are realizing cost savings in the form of yardage and insurance fees, commissions, and transportation costs, as well as increased revenue in the form of reduced shrinkage between delivery and weighing.
Table 1. Descriptive statistics of the JCCMP sale (steers).
|
Statistic |
2017 |
2018 |
2019 |
2020 |
2021 |
All years |
|
Number of JCCMP steers marketed |
152 |
280 |
271 |
259 |
254 |
1,216 |
|
Pounds of JCCMP steers marketed |
102,762 |
199,842 |
200,234 |
190,105 |
177,649 |
870,592 |
|
Average weight of JCCMP steers marketed (pounds) |
676 |
714 |
739 |
734 |
699 |
716 Average |
|
Wgt. avg. JCCMP steer price/pound |
$1.3625 |
$1.4447 |
$1.3252 |
$1.3405 |
$1.5120 |
$1.3970 Average |
|
Average commercial steer sale baseline price/pound |
$1.3364 |
$1.3335 |
$1.2048 |
$1.2401 |
$1.3831 |
$1.2996 Average |
|
Wgt. avg. JCCMP steer premium/pound |
$0.0488 |
$0.1831 |
$0.1068 |
$0.1441 |
$0.1814 |
$0.1328 Average |
|
Total JCCMP steer premiums |
$5,019 |
$36,594 |
$42,786 |
$27,403 |
$32,885 |
$144,687 |
Table 2. Descriptive statistics of the JCCMP sale (heifers).
|
Statistic |
2017 |
2018 |
2019 |
2020 |
2021 |
All years |
|
Number of JCCMP heifers marketed |
76 |
152 |
228 |
236 |
206 |
898 |
|
Pounds of JCCMP heifers marketed |
50,426 |
98,529 |
148,764 |
161,019 |
131,716 |
590,454 |
|
Average weight of JCCMP heifers marketed (pounds) |
664 |
648 |
652 |
682 |
639 |
657 Average |
|
Wgt. avg. JCCMP heifer price/pound |
$1.2875 |
$1.3846 |
$1.3170 |
$1.2607 |
$1.4432 |
$1.3446 Average |
|
Average commercial heifer sale baseline price/pound |
$1.1898 |
$1.1943 |
$1.0393 |
$1.1275 |
$1.2505 |
$1.1603 Average |
|
Wgt. avg. JCCMP heifer premium/pound |
$0.1078 |
$0.1984 |
$0.2169 |
$0.0441 |
$0.1903 |
$0.1515 Average |
|
Total JCCMP heifer premiums |
$5,436 |
$19,550 |
$64,537 |
$7,097 |
$25,575 |
$122,195 |
The estimated standard deviations for the baseline commercial cattle prices were fairly consistent across the years for heifers, ranging from $0.0653 per pound in 2018 to $0.0862 per pound in 2021. As was observed in commercial sale data, there was a higher level of variation with steer prices; the standard deviation of these prices ranged from $0.4990 per pound in 2019 to $0.1028 per pound in 2020. Total JCCMP Steer Premiums and Total JCCMP Heifer Premiums represent the estimated total level of premiums paid to cattle producers who participated in the JCCMP sale and measures the direct effect or increased level of income realized by the producers for each year (this premium includes savings resulting from not having to transport cattle to an auction facility and not having to pay auction facility sales commissions or insurance costs associated with selling animals through an auction facility). We estimate the total JCCMP premiums paid to producers to be $266,882 over the 5-year study time frame.
Analysis
While the direct effect of the JCCMP was estimated to have increased participating cattle producers’ incomes by $266,882 over the study period, there are other economic effects and variables that should be examined to completely evaluate the program. Economic impact analysis is a methodology well suited to estimating these effects and the IMPLAN® software is a well-recognized proprietary software package that is designed to perform this type of analysis (Johnson, 1986).
A common metric used by economic development professionals and community leaders is “economic spillover.” IMPLAN® estimates the economic spillover of an economic shock by summing the estimates of the indirect and induced effects. Indirect effects represent business-to-business transactions made by the sector being examined. For example, an operation may purchase feed from the local agricultural cooperative, medicine from a local animal health supply store, fuel from a local fuel station or distributor, and building supplies from the local hardware store. Induced effects represent the household-based purchases made by the employees and proprietors (owners) of the businesses involved in the direct and indirect transactions. Examples of these types of purchases include groceries, clothing, medical services, and automobile purchases for personal use. The sum of the indirect and induced effects is commonly referred to as economic spillover.
IMPLAN® also estimates several economic variables within the direct, indirect, and induced effects. These include the following:
- Employment — the number of full- and part-time jobs that result from the initial shock (direct effect) in the local economy.
- Labor income — the level of wages and salaries paid to employees and proprietors.
- Value added — the amount of value that is added to raw inputs in the part of the production process that takes place in the local economy.
- Output — equivalent to sales.
Given the types of economic information estimated by the IMPLAN software, the user must decide which way to model the economic shock or stimulus. In the case of the premiums being paid to cattle producers due to participating in the JCCMP, premiums can be treated as either an increase in household income or as a change to the industry. Modeling the economic shock as a change in the industry would result in indirect effects (producers are expanding their operations and would therefore engage in business-to-business purchases) in addition to the induced effects from employee and proprietor purchases. Modeling the shock as a change in household income would only result in an induced effect from purchases made by the producers’ households, as well as the personal purchases made by employees of these business with which the producers’ households do business.
These increased premiums are, in the simplest terms, an increase in proprietor income. While we do not believe that receiving premiums from the JCCMP will necessarily increase production on the operations that participate in the sale, there is reason to expect that some operations will utilize the premiums for household expenditures only (in this case, there would be no indirect effects and would only generate induced effects), while other operations may wish to utilize a portion of the change in proprietor income for business reinvestment (business-to-business expenditures that would generate indirect effects) as well as household expenditures.
Then we considered which operations would choose to reinvest some of the JCCMP premiums in the business and which operations would opt to spend all the premiums on household expenditures (for example, take a vacation or purchase a new living room suite). After examining the distribution of the number of head sold per operation each year, we (arbitrarily) decided to use 10 head sold (steers and heifers combined) each year through the JCCMP as a threshold. If an operation sold fewer than 10 animals in a given year, then we assumed that the change in revenue (premium) from the sale was small enough that the proprietor would use the entire amount for household expenditures. If the operation sold 10 or more head within a given year, we assumed that a portion of the premiums would be reinvested in the business.
This decision to segregate the operations by the number of head sold leads to several additional questions. Since we assumed that there would not be a noticeable increase in cattle production due to the JCCMP premiums, we modeled the increase in proprietor income for operations selling 10 or more head each year as an industry change for IMPLAN® Sector 11 – Beef cattle ranching and farming, including feedlots and dual-purpose ranching and farming. We specified industry sales as the aggregate level of premiums received by this class of operations for the specific analysis year. Since we assumed that there would be no appreciable increase in production, the level of employment was constrained to zero employees and the level of employee compensation was constrained to $0. The level of proprietor income was assumed to be the same as the level of sales since the change in sales necessarily equals the change in proprietor income.
The modeling was more complicated for the change in proprietor income of operations that were assumed to not reinvest the JCCMP premiums into the firm (operations selling fewer than 10 heifers through the SPRHS in a given year). Since the USDA Economic Research Service estimates that the median level of farm household income ranged from $76,250 in 2016 to $83,111 in 2019 (the latest year for which these estimates are available), we modeled this change in income in the range of $70,000 to $100,000 household income, which is a category provided by the IMPLAN® software.
We then estimated the amount of federal, state, and local taxes that needed to be deducted from the gross premium to determine the level of disposable spending that could take place. To estimate the federal taxes, we calculated the proportion of Federal Government NonDefense spending (this spending is presumed to be derived from federal tax collections) as a part of total household spending for the $70,000 to $100,000 household income range using estimates provided by the IMPLAN® software.
The level of estimated federal taxes was deducted from the total level of premiums earned by the operations with SPRHS sales under 10 head for each analysis year. The same type of methodology was used to estimate the level of state and local taxes, except that the level of State/Local Government NonEducation expenditures was used as a proxy for the total level of state and local taxes paid by households in the $70,000 to $100,000 income range. The estimated amounts of state, local, and federal taxes were deducted from the level of premiums received for this class of operation for estimation of the induced effects.
The estimated aggregated direct taxes were apportioned among the appropriate fiscal revenue source categories by using the induced effects tax tables from operations selling ten or more head analyses for each year of the study period. This set of estimations was used as a guide due to the relatively large level of direct effects and the assurance that these large levels would populate the induced effects tax tables (recall that the induced effects represent household purchases by employees, the same concept being considered when the entire amount of JCCMP premiums is being used for household purchases).
Economic impact analysis summary results are shown in Table 3.
Table 3. Economic impact analysis summary results for the JCCMP sale by year.
|
Impact |
2017 |
2018 |
2019 |
2020 |
2021 |
Total |
|
Direct proprietor income change net of taxes |
$10,401 |
$56,145 |
$85,931 |
$32,208 |
$55,128 |
$239,813 |
|
Change in employment |
0.1 |
0.7 |
0.8 |
0.3 |
0.6 |
2.5 |
|
Change in labor income (including change in proprietor income) |
$12,365 |
$76,937 |
$116,540 |
$44,440 |
$75,868 |
$326,150 |
|
Change in value added |
$17,744 |
$101,474 |
$147,795 |
$56,896 |
$96,997 |
$420,906 |
|
Change in output |
$22,490 |
$140,086 |
$191,864 |
$74,694 |
$127,131 |
$556,265 |
While the increases in jobs created attributable to JCCMP premiums are relatively small for all years, labor income net of changes in proprietor income (calculated by subtracting “Direct proprietor income change net of taxes” from “Change in labor income”) experienced increases from $10,401 (2017) to $85,931 (2019) as a result in the increases in farm household income. In addition, the state’s value-added activities net of the direct increase in proprietor income increases from a low of $17,744 (2017) to a high of $147,795 (2019). We estimate that the total level of sales for all sectors increased by $556,265 over the study period, including the changes in proprietor income net of taxes and that the level of sales due to the economic spillover effects increased by $312,536.
The use of the IMPLAN® software also allows the estimation of fiscal (tax) effects that accrue to local, state, and federal governments each year for the induced effects. These effects are shown in Table 4 and Table 5. While the induced household income change effects and industry change effects are gathered directly from IMPLAN®, additional steps are taken to gather the direct effects of the household income change. The first step is to calculate the proportions of household income changes paid directly to state, local, and federal taxes. This is done by dividing the amounts paid for federal (non-defense) and state (non-education) by the total state, local, and federal taxes for a given year. Once these proportions are found, the remainder of household income is run through IMPLAN to estimate the induced tax effects.
Table 4. Estimated changes in state and local taxes.
|
Tax |
2017 |
2018 |
2019 |
2020 |
2021 |
Total |
|
TOPI: Sales tax |
$523 |
$3,251 |
$1,404 |
$631 |
$1,054 |
$6,863 |
|
TOPI: Property tax |
$311 |
$1,943 |
$837 |
$377 |
$629 |
$4,097 |
|
TOPI: Other taxes |
$51 |
$319 |
$138 |
$62 |
$104 |
$674 |
|
Personal Tax: Other taxes |
$278 |
$1,628 |
$2,473 |
$961 |
$1,635 |
$6,976 |
|
Corporate profiles and dividends |
$50 |
$212 |
$407 |
$164 |
$278 |
$1,110 |
|
Total |
$1,240 |
$7,490 |
$5,533 |
$2,303 |
$3,882 |
$20,448 |
Table 5. Estimated changes in federal taxes.
|
Tax |
2017 |
2018 |
2019 |
2020 |
2021 |
Total |
|
Social insurance |
$763 |
$4,535 |
$6,570 |
$2,537 |
$4,346 |
$18,751 |
|
Taxes on Production and Imports |
$100 |
$722 |
$339 |
$146 |
$251 |
$1,558 |
|
Corporate Profits Tax |
$201 |
$407 |
$904 |
$354 |
$605 |
$2,471 |
|
Personal Income Tax |
$722 |
$4,379 |
$6,402 |
$2,432 |
$4,163 |
$18,098 |
|
Total |
$1,784 |
$10,043 |
$14,214 |
$5,467 |
$9,365 |
$40,873 |
While most of the changes in taxes in Table 4 are paid to the Mississippi Department of Revenue and are used for state-level programs that benefit the residents of the state, there are two sources of revenue that accrue to local governments. Property taxes, whether personal property taxes or property taxes derived from taxes on production and imports (TOPI), generally accrue to local (county and municipal) governments. Furthermore, while sales taxes collected by businesses are remitted to the Mississippi Department of Revenue, 18.5 percent of sales tax collected within an incorporated municipality’s boundaries (city/town limits) are remitted back to that municipality’s general fund as a diversion. There is no diversion to counties for sales tax collected from outside municipal boundaries.
Estimated additional federal taxes collected that are attributable to the JCCMP premiums tended to have substantial variation over the study period, presumably due to changes in prices, pounds marketed, and changes in the federal tax code. The increase in federal tax collections that occurred in 2019 happened despite tax cuts imposed at the federal level (however, 2019 experienced the second highest number of pounds marketed), but it should be noted that estimated federal tax collections declined in 2020 when the number of pounds marketed were slightly higher.
Conclusions
The primary goal that spurred the development of the Jasper County Calf Marketing program was to provide an opportunity for producers of high-quality feeder cattle to increase returns. Given the guidelines under which the program operates and the revenues and savings that result from participation, our estimates indicate that this goal has been met with an average $0.1328 per pound premium for steers and $0.1515 per pound premium for heifers sold over the study period, but there are other considerations that make this Extension-related program even more valuable to the state of Mississippi as a whole.
The analysis reveals that substantial economic spillover benefits exist, resulting from the estimated induced effects, associated with increasing producer household incomes due to participation in the SPRHS. Indirect and induced employment effects revealed an estimated increase of 2.5 full- and part-time jobs. The estimated indirect and induced labor income effects revealed an increase in labor income of $326,150. The estimated indirect and induced effects for value-added activities in the state revealed an increase of $420,906. In addition, indirect and induced sales effects in the state were estimated to be $556,265 due to the JCCMP premium increases.
Economic Evaluation of Extension Programs
While one purpose of this study was to estimate the direct and economic spillover benefits of a recognized Extension programming activity, another purpose was to advise the reader regarding critical factors to be considered in developing an economic impact evaluation of Extension programming. We encourage anyone who is considering this type of analysis to consider the following factors:
- Determine if the Extension program can be appropriately evaluated using the economic impact analysis methodology. This methodology involves spending by some party. The analysis presented in this publication involved spending by purchasers of replacement breeding stock both at the SPRHS sale and through commercial sales. This type of analysis may not be appropriate or may not be feasible for some types of Extension programs, such as an evaluation of the leadership skills gained by 4-H club members due to the types of research and assumptions that would be involved in a rigorous analysis.
- This type of methodology cannot determine the feasibility of a project. Economic impact analysis cannot indicate whether a project or program is profitable or even if the economic benefit of the program exceeds its economic costs. Economic impact analysis can be used to estimate the indirect and induced (economic spillover) effects of the program’s profits and losses or excess economic benefits/costs if the condition regarding spending is met.
- Analyze the economic impact of the project correctly. It is very easy to misuse this type of analysis methodology and obtain inaccurate numbers that can mislead policy makers. While it is often inconvenient, having the analysis reviewed by competent practitioners of the methodology will not only ensure that the analysis is as accurate as possible, but will also provide a high level of transparency to potential users. There are several Extension and research economists associated with the Mississippi State University Department of Agricultural Economics or Department of Forestry that can assist in providing objective analyses of this type.
- Beware of the temptation to generate large economic multipliers. While a technical discussion of the concept of economic multipliers is beyond the scope of this analysis, they are basically ratios that measure the magnitude of the total economic effect for the various economic variables as compared to the direct effect. While the IMPLAN® software can generate large multipliers, these cannot objectively be defended. In general, a multiplier or ratio of 2.0 is considered to be close to the highest defendable level, and production agriculture multipliers are generally well below that level. The labor income multiplier for the operations that sold 10 or more heifers through the SPRHS is calculated as 1.36 (realizing that proprietor income is a part of labor income). However, the assumptions made in developing the analysis will result in multiplier increases or decreases. While the labor income multiplier is calculated to be relatively low, the output or sales multiplier for operations that sold 10 or more heifers in the sale for 2020 is estimated as 2.23. This relatively high estimation is due to the assumption that the change in proprietor income would not change the operations’ production practices, so no additional labor would be hired, and thus there would be no additional employee wages (costs that would reduce the operations profits and proprietor income) resulting from the increase in revenue.
- Utilize reputable data sources. The analysis presented in this publication utilized objective data provided by the Southeast Mississippi Livestock auction barn (home to the SPRHS) and the USDA Agricultural Marketing Service. Although the deficiencies of the AMS data were previously discussed, these organizations provide objective records of expenditures that add to the objectivity of the analysis. While collecting these types of data can be tedious and time-consuming, utilizing these types of data provides a more objective basis for analysis than producer surveys or anecdotal evidence.
- Report the results of the analysis objectively. It is likely that any type of analysis or evaluation of this type will be read with interest by several stakeholders in the local community. It is important that the evaluation results be reported as objectively as possible.
The example used in this publication provided a number of points that could be used to demonstrate the economic impact of this Extension program. First, animals sold through the JCCMP received a high premium, which obviously benefits the producer who sold the animal. In 2021, 17 individual producers sold between six and 60 head of calves. This suggests that these producers earned between $376 and $6,124 in premiums over the calf sold at a typical commercial sale. It is possible that these animals could have commanded a premium at a commercial sale; however, the available commercial sale data does not identify premium cattle.
The story does not end here. We calculate that the estimated premiums generated by the sale of 460 quality calves in the 2021 JCCMP sale generated an additional $69,469 in sales (output) from business-to-business and employee spending, as well as an additional 0.5 jobs earning $20,033 in labor income throughout the state. It is assumed that the average additional job earned $40,066 in wages/salaries and benefits.
There are also substantial fiscal effects that further demonstrate the value and impact of the Extension program to elected officials. We estimate that the premiums earned from participation in the 2021 SPRHS generated an estimated additional $7,581 in total state and local taxes. While the state government receives the bulk of these revenues, local governments typically receive property taxes ($629), and municipalities receive an 18.5 percent diversion of the sales tax that is collected within municipal boundaries that supplements their general funds.
Given that municipalities collected 84.5 percent of the sales tax collected in the state for the most recent 12 months, we estimate that premiums received from the 2021 SPRHS resulted in an increased diversion to municipalities of $165. This suggests that local governments received an additional $794, and the state government received $6,787 to enable programs that benefit the public good (such as Cooperative Extension). In addition, SPRHS premiums generated an estimated additional $18,730 in federal revenues for 2021.
We conclude with the presumption that most Extension programs have economic benefits that could be estimated in a manner similar to the JCCMP. These results can be shared with stakeholders from local businesses and employees to elected officials. For suggestions of economists who might be able to assist with this type of evaluation effort, please contact the authors.
References
Hughes, D. W. Consultation with David W. Hughes, Professor and Greever Endowed Chair, Agricultural Economics. University of Tennessee. May 30, 2021.
Johnson, T. G. A Dynamic Input-Output Model for Small Regions. The Review of Regional Studies. Vol. 16, Issue 1. P. 14–23. 1986.
Maples, J. G. Compilation of USDA Agricultural Marketing Service weekly livestock auction summaries 2016-2019. Data no longer available from USDA Agricultural Marketing Service.
United States Department of Agriculture – Agricultural Marketing Service. Mississippi Weekly Livestock Auction Summary. Accessed May 2021.
United States Department of Agriculture – Economic Research Service. Farm Household Income and Characteristics. Accessed May 27, 2021.
Williams, B. R., E. A. DeVuyst, D. S. Peel, and K. C. Raper. The Likelihood of Positive Returns from Value-Added Calf Management Practices. Journal of Agricultural and Applied Economics. 46,1(February 2014): 125-138.
Williams, B. R., E. A. DeVuyst, D. S. Peel, and K. C. Raper. Reducing Self-Selection Bias in Feeder Cattle Premium Estimates Using Matched Sampling. Journal of Agricultural and Resource Economics. 30(1):124-138. April 2014.
The information given here is for educational purposes only. References to commercial products, trade names, or suppliers are made with the understanding that no endorsement is implied and that no discrimination against other products or suppliers is intended.
Publication 3753 (POD-04-22)
By Kelby King, Extension Agent I, MSU Extension Service in Jasper County; Adam R. Nathan, Student Researcher, Department of Agricultural Economics; Kalyn T. Coatney, PhD, Associate Professor, Agricultural Economics; Thomas E. Brewer, Extension Agent IV, MSU Extension Service in Jefferson Davis County; Rebecca C. Smith, PhD, Associate Extension Professor, Agricultural Economics; James N. Barnes, PhD, Associate Extension Professor, Agricultural Economics; Joy Fox Anderson, PhD, Extension Agent IV, MSU Extension Service in DeSoto County; Gregory W. Biggs, Extension Agent II, MSU Extension Service in Madison County; and Alan Barefield, PhD, Extension Professor, Agricultural Economics.

The Mississippi State University Extension Service is working to ensure all web content is accessible to all users. If you need assistance accessing any of our content, please email the webteam or call 662-325-2262.