Vol. 13, No. 6 / The U.S. Trout Aquaculture Industry: Where is it going?
Abstract
- This newsletter shows the overall trends in U.S. trout aquaculture production, farmgate values, and imputed farmgate prices.
- Annual aquaculture data are compiled from the NOAA Fisheries website.
- Econometric models are estimated to measure the impacts of disasters and economic events on aquaculture production, farmgate values, and imputed farmgate prices.
Acknowledgement
- This newsletter is a contribution of the Mississippi Agricultural and Forestry Experiment Station and the Mississippi State University Extension Service.
- This material is based upon work that is supported in part by the National Institute of Food and Agriculture, U.S. Department of Agriculture, Hatch project under accession number 081730 and
- NOAA (Office of Sea Grant, U.S. Dept. of Commerce, under Grant NA22OAR4170090, Mississippi Alabama Sea Grant Consortium).
Keywords
- Trout aquaculture production
- Trout aquaculture farmgate values and prices
Let Us Start Our Modeling Effort!
- The NOAA Fisheries data on U.S. trout aquaculture production (lb/yr) and farmgate values ($/yr) are available from 1983 to 2019.
- Farmgate prices ($/lb) are imputed from farmgate values and annual production.
- Econometric models are estimated to determine significant determinants of production, farmgate values, and prices.

Rainbow trout are the most popular and easily reared trout species. They are fast-growing and crowding-tolerant fish, making them well-suited to captive breeding. These trout are widely used worldwide for fish farming and restocking for recreational angling. In the wild, they feed on invertebrates and other fish, but cultured strains do very well on various artificial diets. https://www.agmrc.org/commodities-products/aquaculture/aquaculture-fin-fish-species/trout.
U.S. Aquaculture Economic Models
- The Ordinary Least Squares (OLS) models of U.S. aquaculture consisted of the following dependent variables:
- Aquaculture production (lb/yr),
- Deflated aquaculture farmgate values ($/yr),
- Deflated aquaculture farmgate prices ($/lb).
- The OLS models of U.S. aquaculture were estimated using the robust variance procedure of STATA-17.
- The variation inflation factor was calculated to detect the possible presence of multicollinearity.
- The marginal impacts of disaster events were computed using the margins procedure.
U.S. Aquaculture Production Economic Model
- The OLS model of U.S aquaculture production (lb/yr) assumed that annual production could be explained by the following:
- year
- deflated farmgate, dockside, and import prices ($/lb)
- recession, U.S.-China trade war, global pandemic, and Gulf natural disasters (1 or 0)
- unemployment rate (%)
- other variables
U.S. Trout Aquaculture Production and Farmgate Values
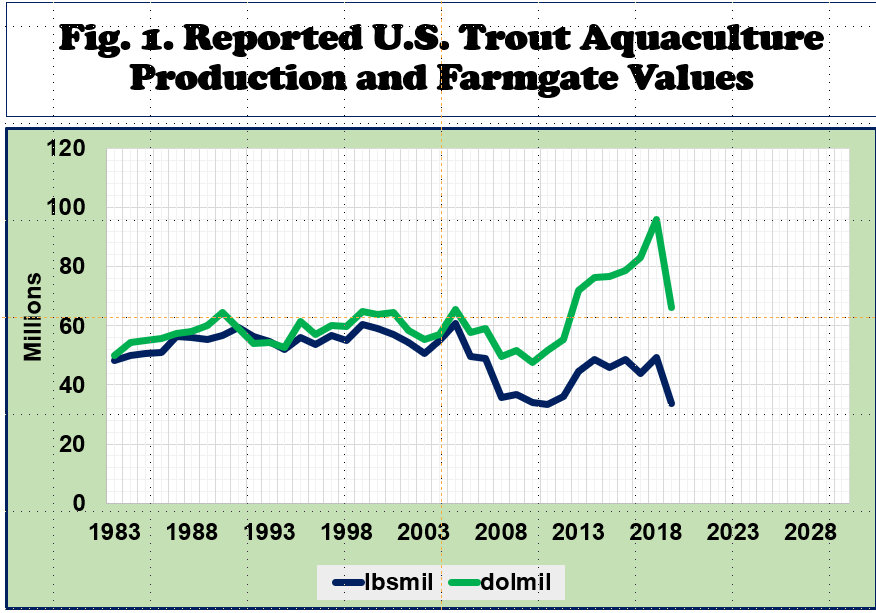
- The reported trout aquaculture production (lb/yr) and farmgate values ($/yr) are shown in Fig. 1.
- The blue curve shows the annual trout production (in million pounds per year).
- The green curve indicates the trout aquaculture farmgate values (in million dollars annually).
- Data from 1983 to 2019 were compiled from the NOAA Fisheries website.
U.S. Trout Aquaculture Producers
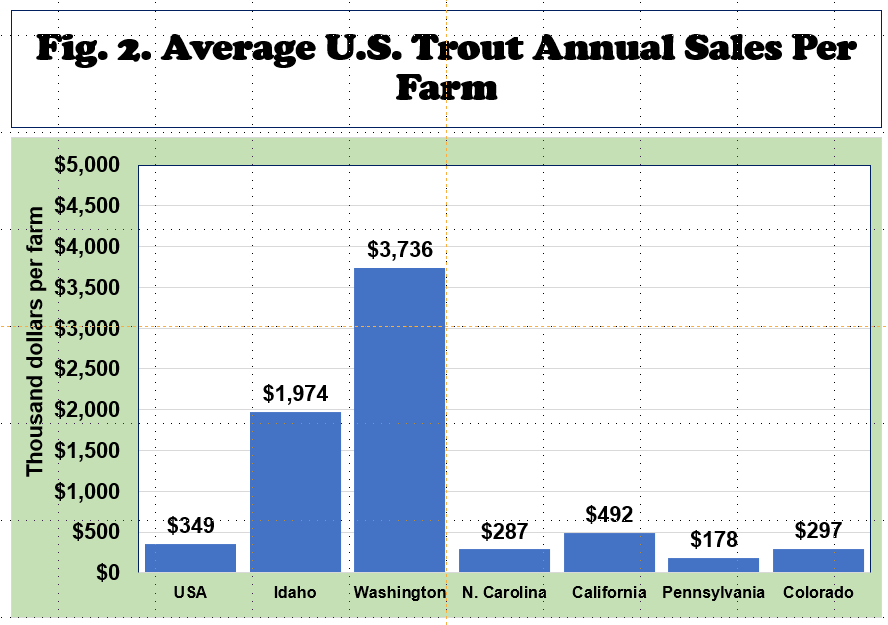
- In 2013, there were 359 trout farms in the U.S., as compiled from the U.S. Agriculture Census website. The average annual trout sales per farm was $307,000 per farm.
- The number of trout farms fell to 334 in 2018. Census data showed a higher average annual sale of $349,000 per trout farm that year.
- The data indicate that the most significant trout farms are in Washington, with annual sales averaging almost $3.8 million in 2028.
U.S. Trout Aquaculture Producers By State
- Idaho ($41.4 million),
- Washington ($26.1 million),
- North Carolina ($9.7 million),
- California ($7.3 million),
- Pennsylvania ($6.7 million), and
- Colorado ($3.2 million).

Reported and Predicted U.S. Trout Aquaculture Production
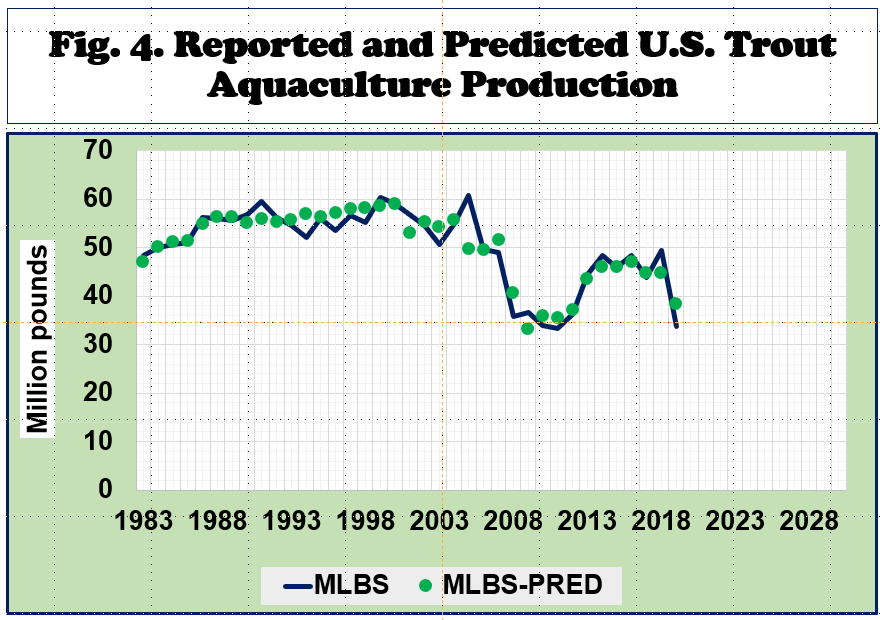
- The reported and predicted U.S. trout aquaculture production are shown in Fig. 4.
- The estimated OLS equation is statistically significant (at α= 0.01).
- The estimated equation explained 86 percent of the variations in trout aquaculture production.
- The blue curve shows the reported annual trout production (million pounds annually).
- The green dots show the predicted annual trout production (million pounds annually).
Projections of U.S. Trout Aquaculture Production to 2030
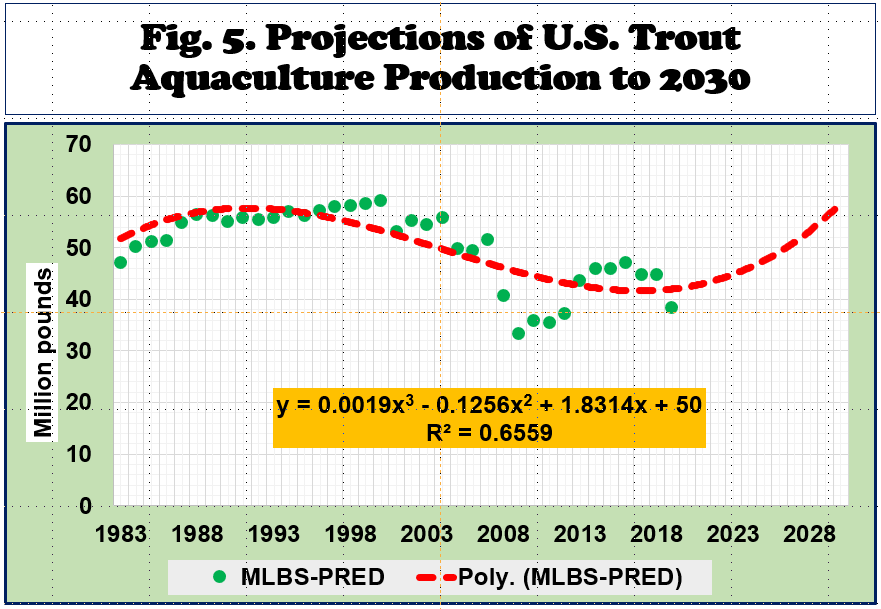
- The projections of trout aquaculture production up to 2030 are shown in Fig. 5.
- The Excel Trendline function generated a polynomial equation, y = 0.0019x3 - 0.1256x2 + 1.8314x + 50, for the predicted values of annual trout production.
- The polynomial equation explains about two-thirds of the variations in the predicted values (R² = 0.6559).
Marginal Impacts on U.S. Trout Aquaculture Production
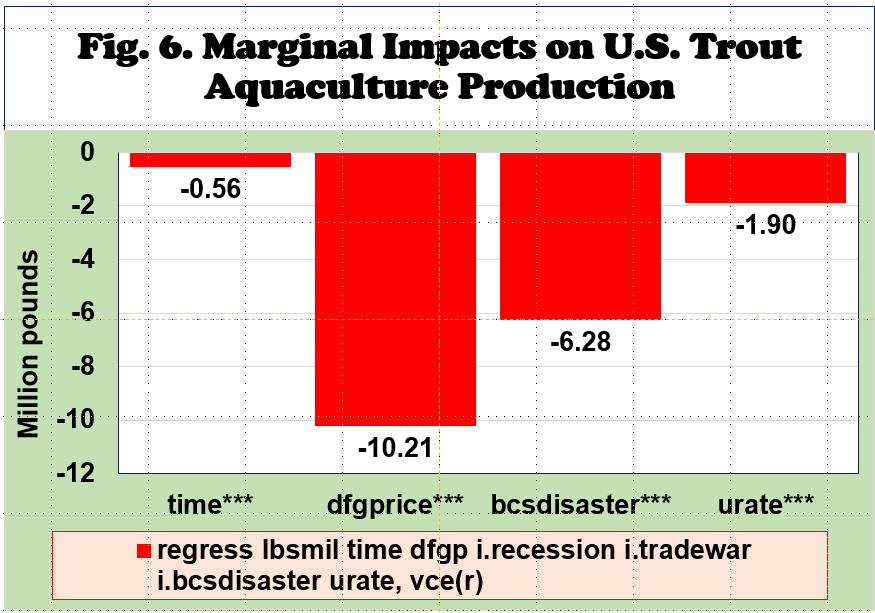
- A dollar rise in imputed deflated trout farmgate price led to a 10.21 million pounds decrease in annual trout aquaculture production.
- A natural disaster event reduced annual trout aquaculture production by 6.28 million pounds.
- An increase in the unemployment rate by one percent diminished annual trout aquaculture production by 1.9 million pounds.
Marginal Impacts on U.S. Trout Farmgate Values
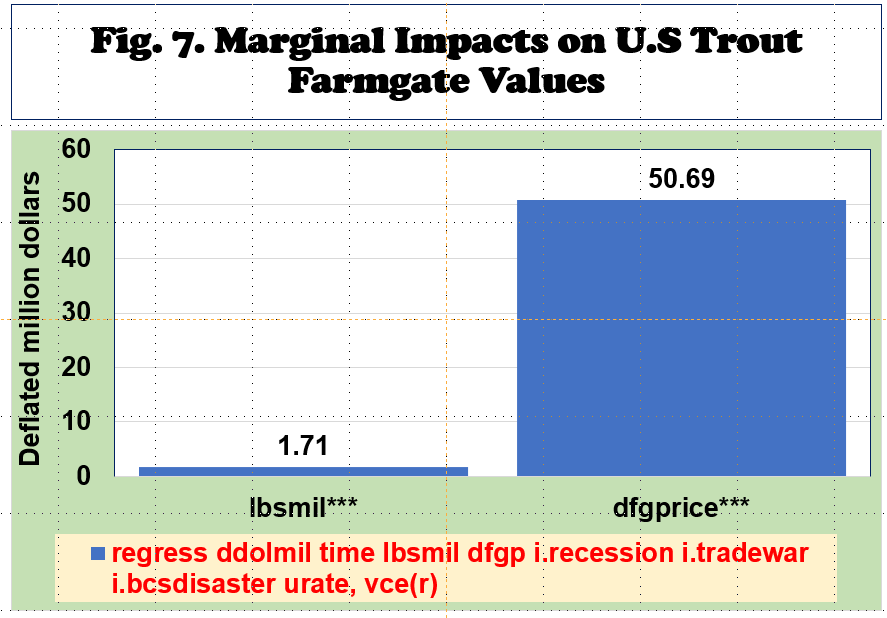
- A million-pound increase in annual trout production enhanced deflated trout farmgate values by 1.71 million dollars.
- A dollar expansion in imputed deflated trout farmgate price led to a 50.69 million dollar rise in trout deflated farmgate values.
Marginal Impacts on U.S. Trout Farmgate Prices
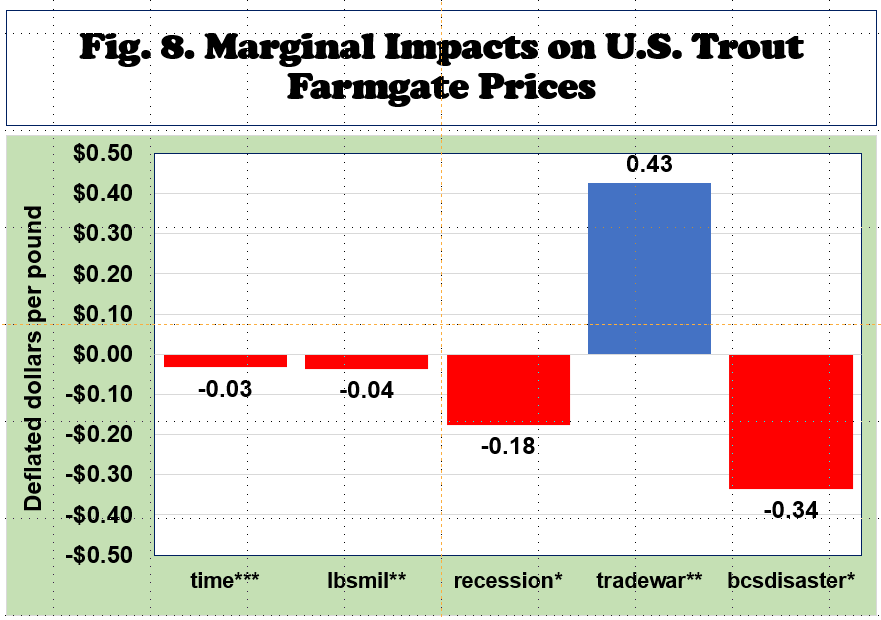
- A million-pound increase in annual trout production diminished deflated trout farmgate prices by $0.04 per pound.
- A recession event reduced deflated trout farmgate prices by $0.18 per pound.
- A U.S.-China trade war event enhanced deflated trout farmgate prices by $0.43 per pound.
- A natural disaster event reduced deflated trout farmgate prices by $0.34 per pound.
Summary and Implications
These variables have been shown to exert significant impacts on trout aquaculture production and farmgate values:
- Changes in trout farmgate prices,
- Occurrence of recessions,
- Continuation of US-China trade war
- Changes in the unemployment rate,
- Occurrence of Gulf disaster event.
However, the magnitude and direction of impacts are still subject to further model development and testing. Compared to three other trout aquaculture data sources, some significant differences are observed.
Data from the Food and Agriculture Organization (FAO-STAT) website are not very different from the data compiled from NOAA Fisheries website. FAO-STAT data on U.S. trout aquaculture started in 1960 while farmgate values started in 1984. While both trout aquaculture production and farmgate value data released by NOAA Fisheries started in 1983 to 2019. I await the updated annual aquaculture production and farmgate values for recent years.
U.S. trout aquaculture data from the U.S. Department of Agriculture (NASS-Quick-Stats) started in 2010 to 2022. Large differences are observed between food-fish-trout sales reported by USDA-NASS and NOAA-Fisheries. The same observations can be made on the trout aquaculture production data.
When compared to the USDA-Aquaculture Census data, the 2013 and 2018 trout aquaculture sales data compiled from the NOAA Fisheries data are significantly lower. The 2013 USDA aquaculture census data on total trout sales are 53% higher than the 2013 NOAA Fisheries data on trout farmgate value. The 2018 USDA aquaculture census data on total trout sales are 22% higher than the 2018 NOAA Fisheries data on trout farmgate value.
In the meantime, I decided to use the NOAA Fisheries trout aquaculture data since the period covered started in 1983 to 2019. Similar graphical trends are noticeable despite the size differences since 2010.
Suggested Citation
Posadas, B.C. 2023. The U.S. Trout Aquaculture Industry: Where is it Going? Mississippi MarketMaker Newsletter, Vol. 13, No. 6. Mississippi State University Extension Service. June 8. https://extension.msstate.edu/newsletters/mississippi-marketmaker.
For accessibility assistance please contact Ben Posadas at ben.posadas@msstate.edu

