Vol. 12, No.5 / Long-Term Shifts In Oyster Landings And Prices In U.S. Domestic Markets
Abstract
In this issue, Dr. Posadas compares the nominal dockside prices and commercial landings of oysters harvested in the U.S. by major species. The major oyster species harvested in the U.S. include Eastern oysters and Pacific oysters. In addition, the nominal farmgate prices and production of oyster farms are also compiled. The total supply and apparent per capita consumption of oysters are also estimated. The overall trends in prices, harvests, and consumption are measured over time.
Acknowledgment
This newsletter is a contribution of the Mississippi Agricultural and Forestry Experiment Station and the Mississippi State University Extension Service. This material is based upon work that is supported in part by the National Institute of Food and Agriculture, U.S. Department of Agriculture, Hatch project under accession number 081730 and NOAA (Office of Sea Grant, U.S. Dept. of Commerce, under Grant NA10OAR4170078, Mississippi Alabama Sea Grant Consortium).
Introduction
- Nominal dockside, farmgate, import, and export prices are in dollars per pound of oyster meat.
- Commercial landings, aquaculture production, imports, and exports are in pounds of oyster meat.
- Dockside, farmgate, import, and export values of oysters are in dollars.
- The total supply is in pounds of oyster meat.
- Total expenditures on oysters are in dollars.
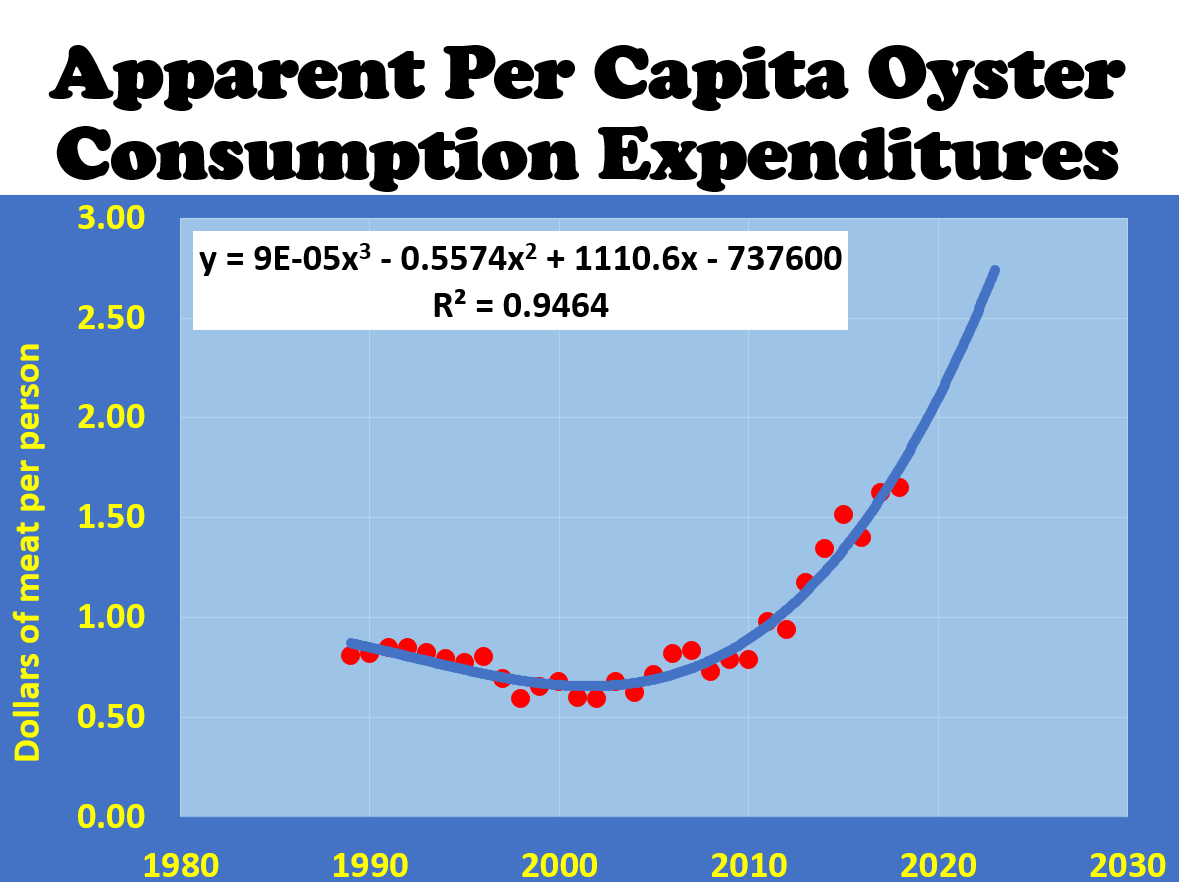
- Apparently, per capita oyster consumption is in pounds of meat and dollars per person.
- Time covers the years from 1950 to 2020.
- The raw data sources are NOAA Fisheries and the Mississippi Department of Marine Resources.
- Simple trend analyses are performed in Excel.
Summary Of Commercial Oyster Landings
- The source of raw data is NOAA Fisheries reports and websites.
- Over time, the overall trend of U.S. commercial oyster landings has been downwards since 1930 (Fig. 1).
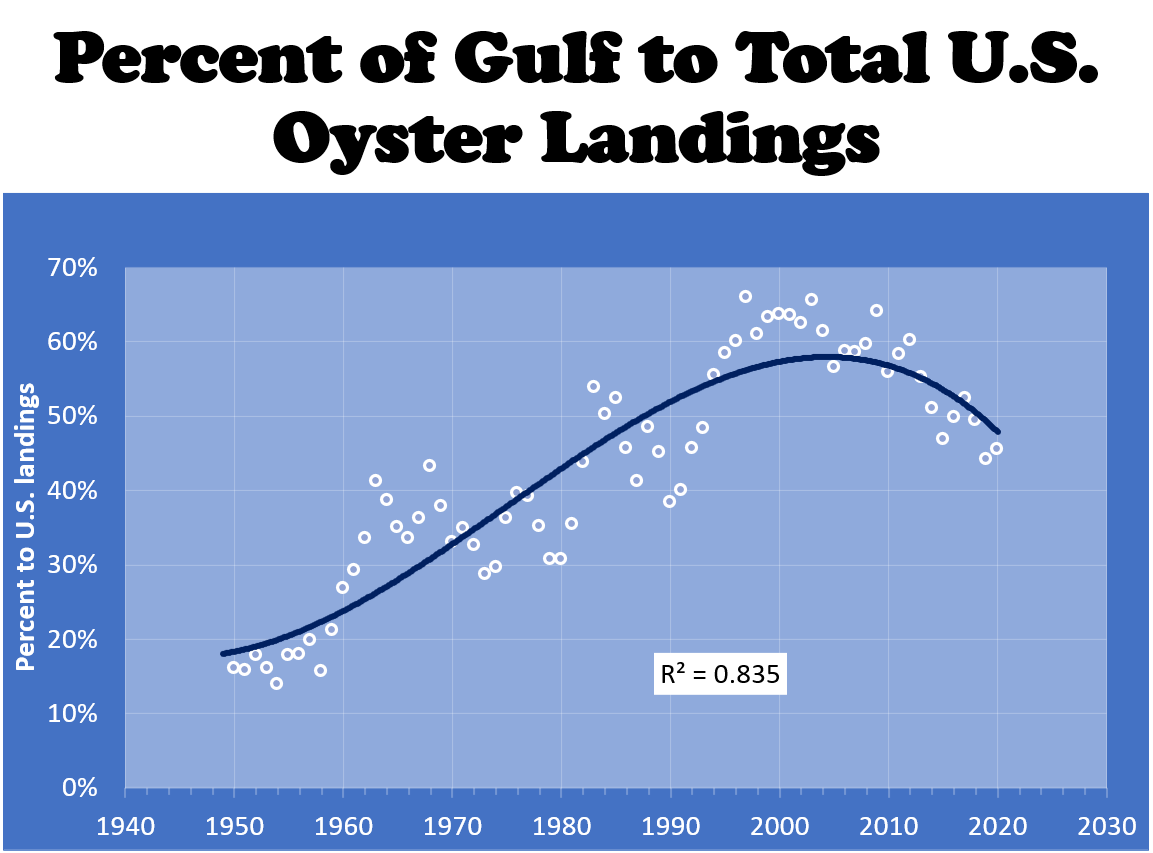
- The Gulf produced most oysters starting in 2000, but its share declined after the Deepwater Horizon oil spill in 2010 (Fig. 2).
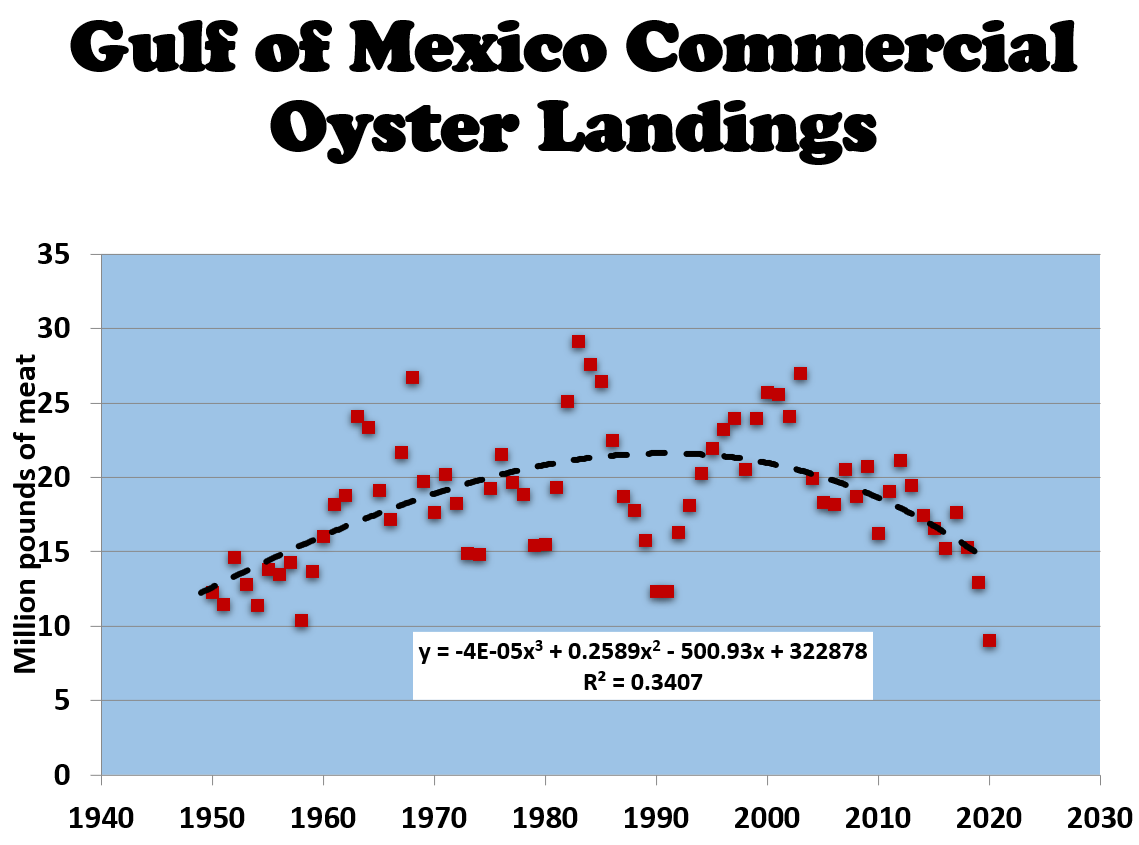
- In the Gulf, the initial trend between 1950 and 1990 was upward. Afterward, the overall was downhill toward its lowest level recently (Fig. 3).
- In Mississippi, oyster landings were very erratic (Fig. 4). Recent coastal hazards wiped out its public oyster reefs. No oyster landings were reported after 2018.
- Habitat degradation, pollution, oyster diseases, predation, coastal hazards, rapid coastal development, and more led to these overall downward trends in oyster landings.


Summary Of Oyster Landings By Species
- The source of raw data is the NOAA Fisheries website.
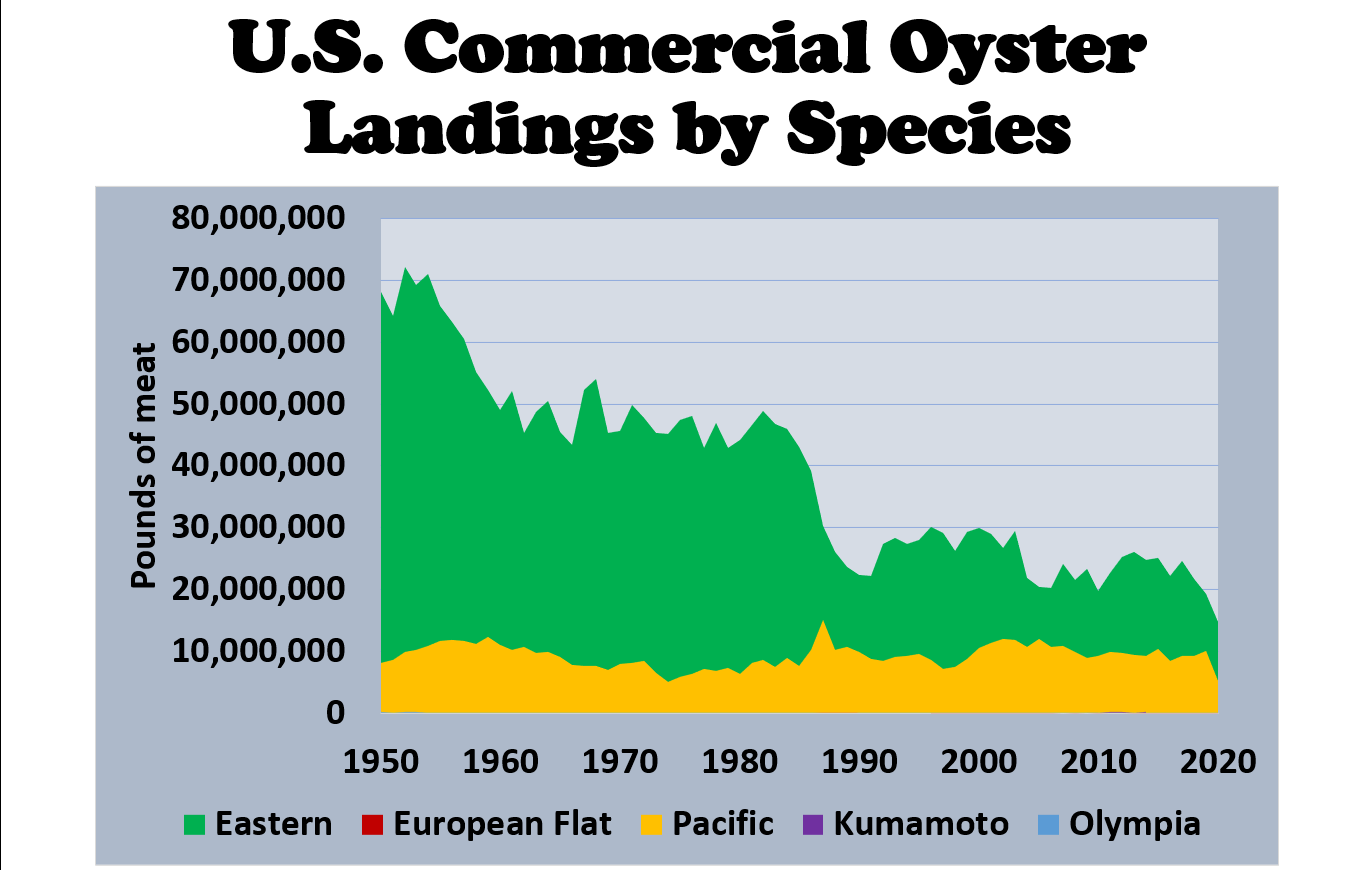
- The two most important species harvested in the U.S. are the Eastern oyster and the Pacific oyster (Fig. 5).
- Three other oyster species are harvested in limited quantities – European flat, Pacific, and Kumamoto oysters (Fig. 5).
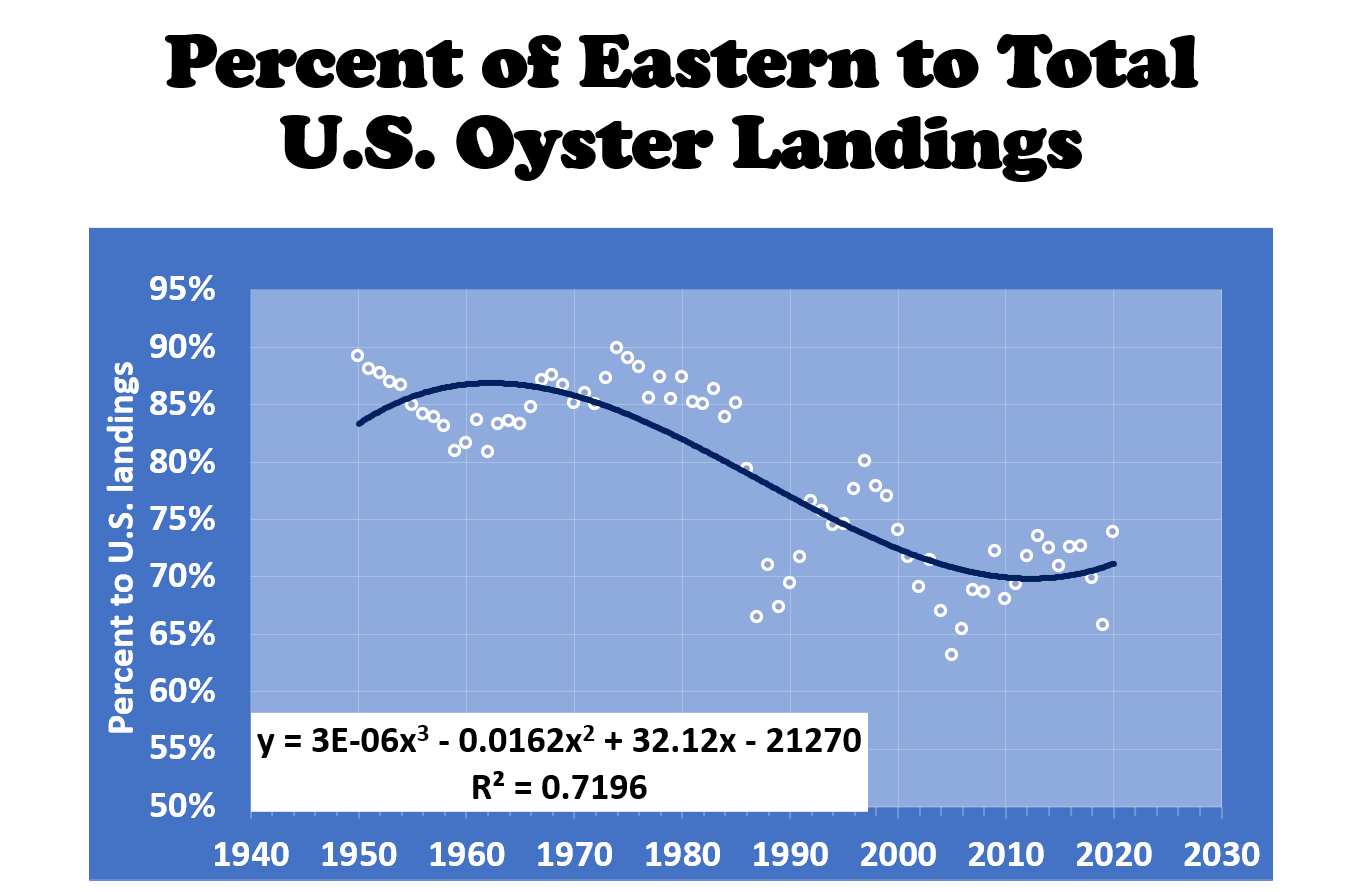
- The Eastern oyster dominates the domestic market, but its share has declined over the years (Fig. 6).
- The Pacific oyster has steadily gained more market share, especially for two decades.
Summary Of Oyster Dockside Values And Prices
- The source of raw data is the NOAA Fisheries website.
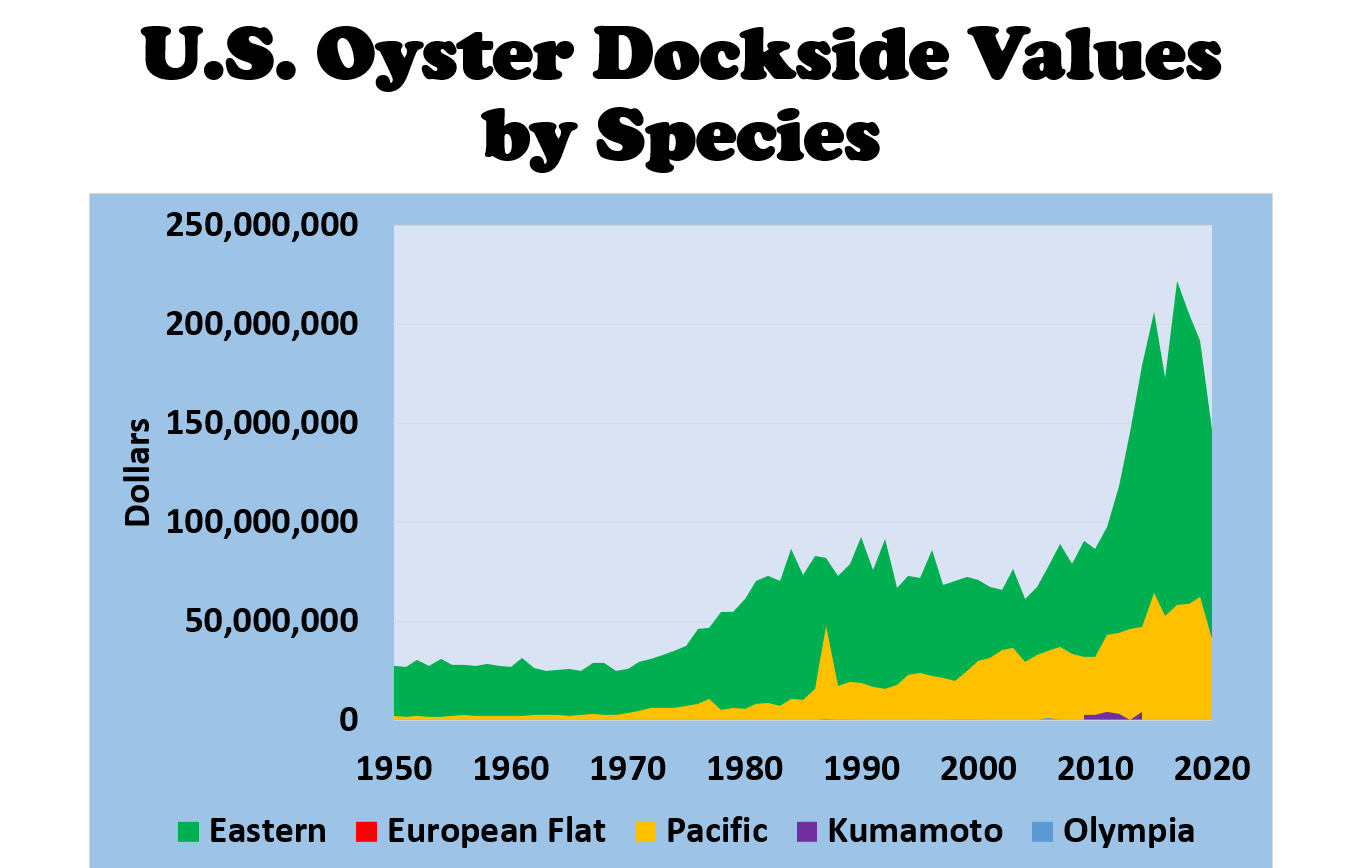
- The Eastern oyster dominates the domestic market, but its share has declined over time (fig. 7).
- The Pacific oyster has steadily gained more market share, especially for two decades (Fig. 7).
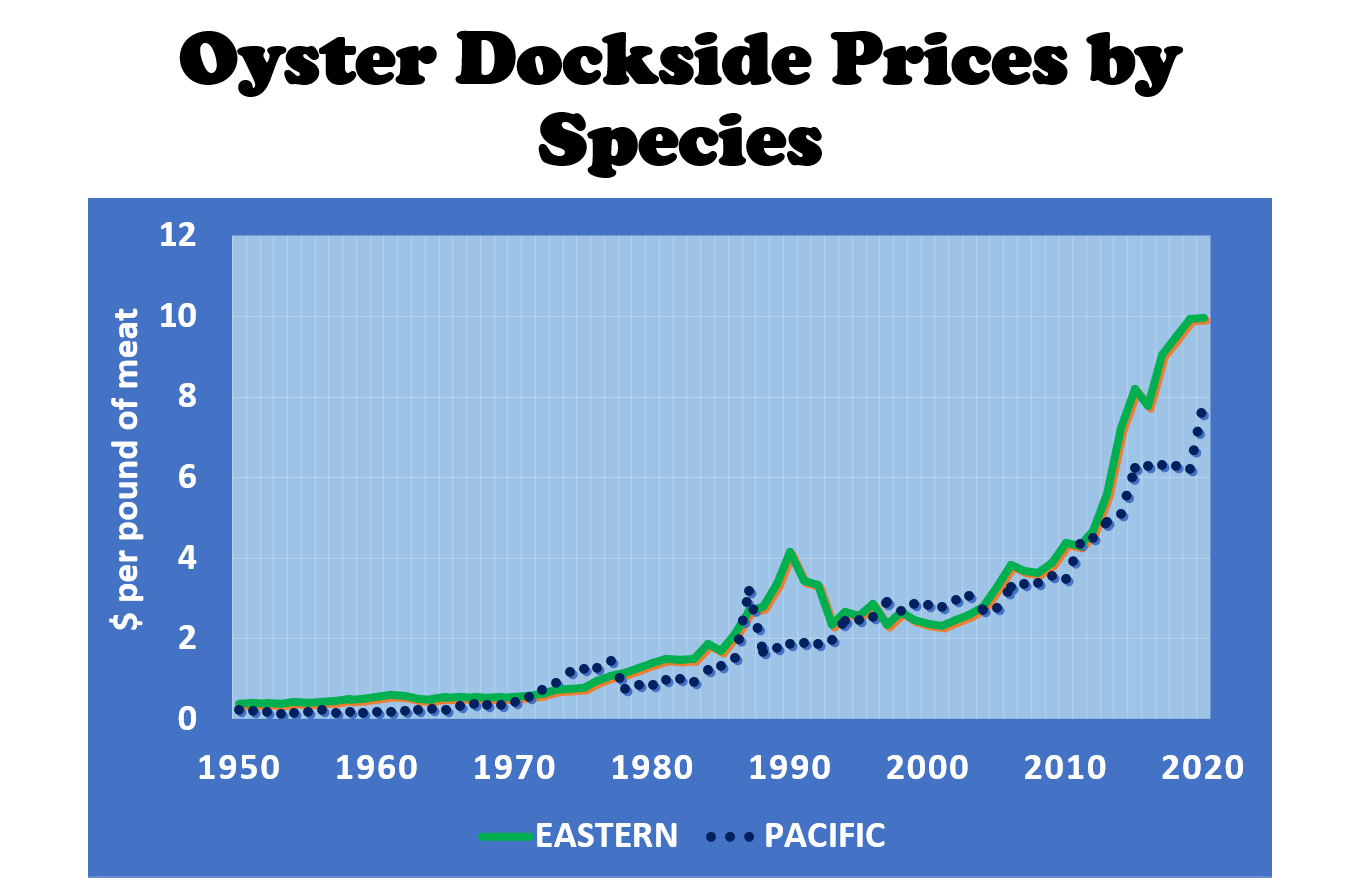
- The dockside prices of both species are rising over time (Fig. 8).
- In 2020, Eastern oysters landed at $10 per pound of meat, while the Pacific oysters landed at $8 per pound (Fig. 8).
- These rising dockside prices of oysters landed in the U.S. boosted the dockside values of oysters during the past decade (Fig. 7).
Summary Of U.S. Oyster Aquaculture Production And Farmgate Values
- The source of raw data is the NOAA Fisheries website.
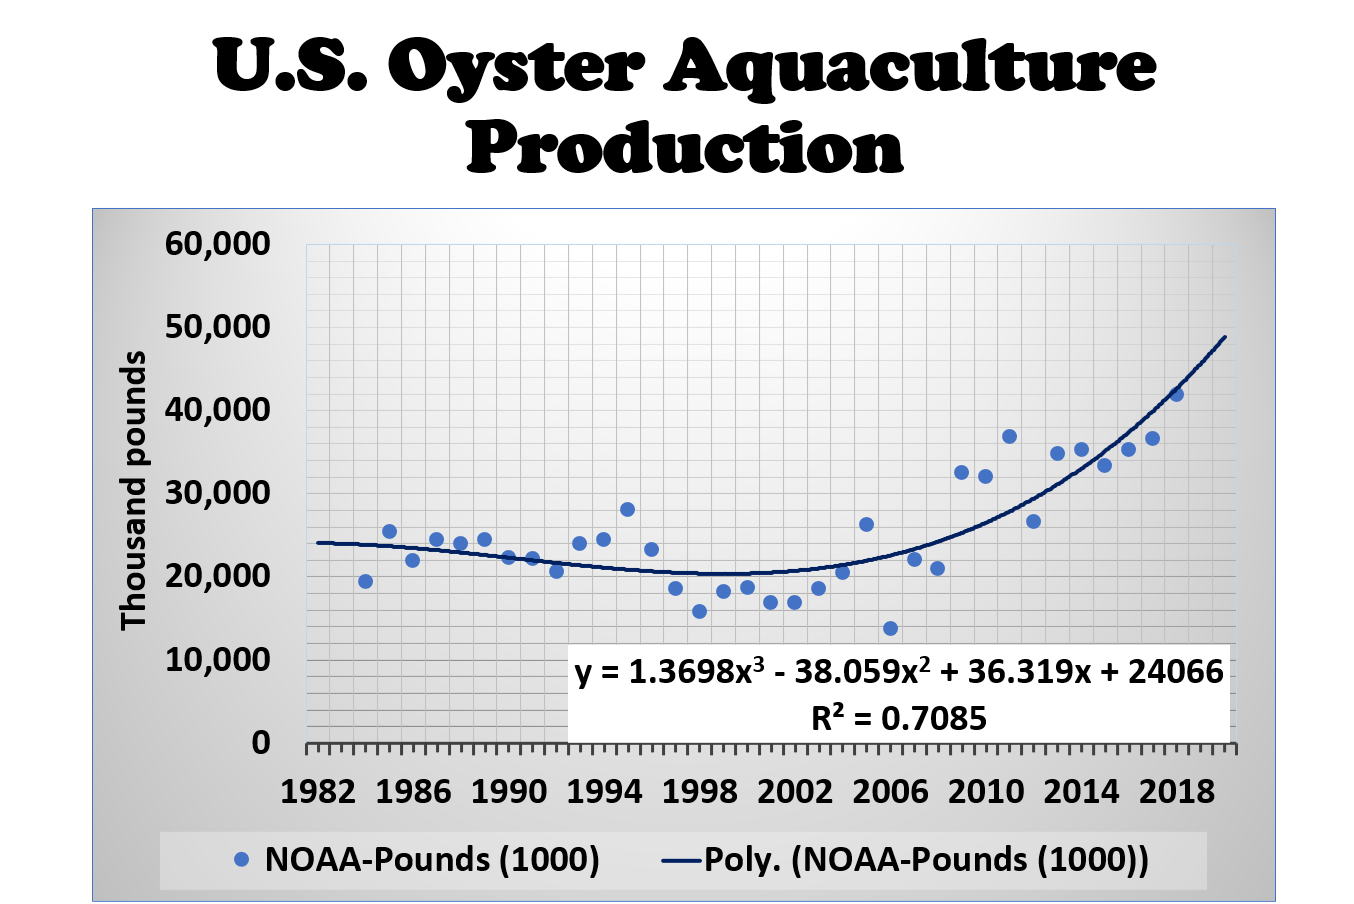
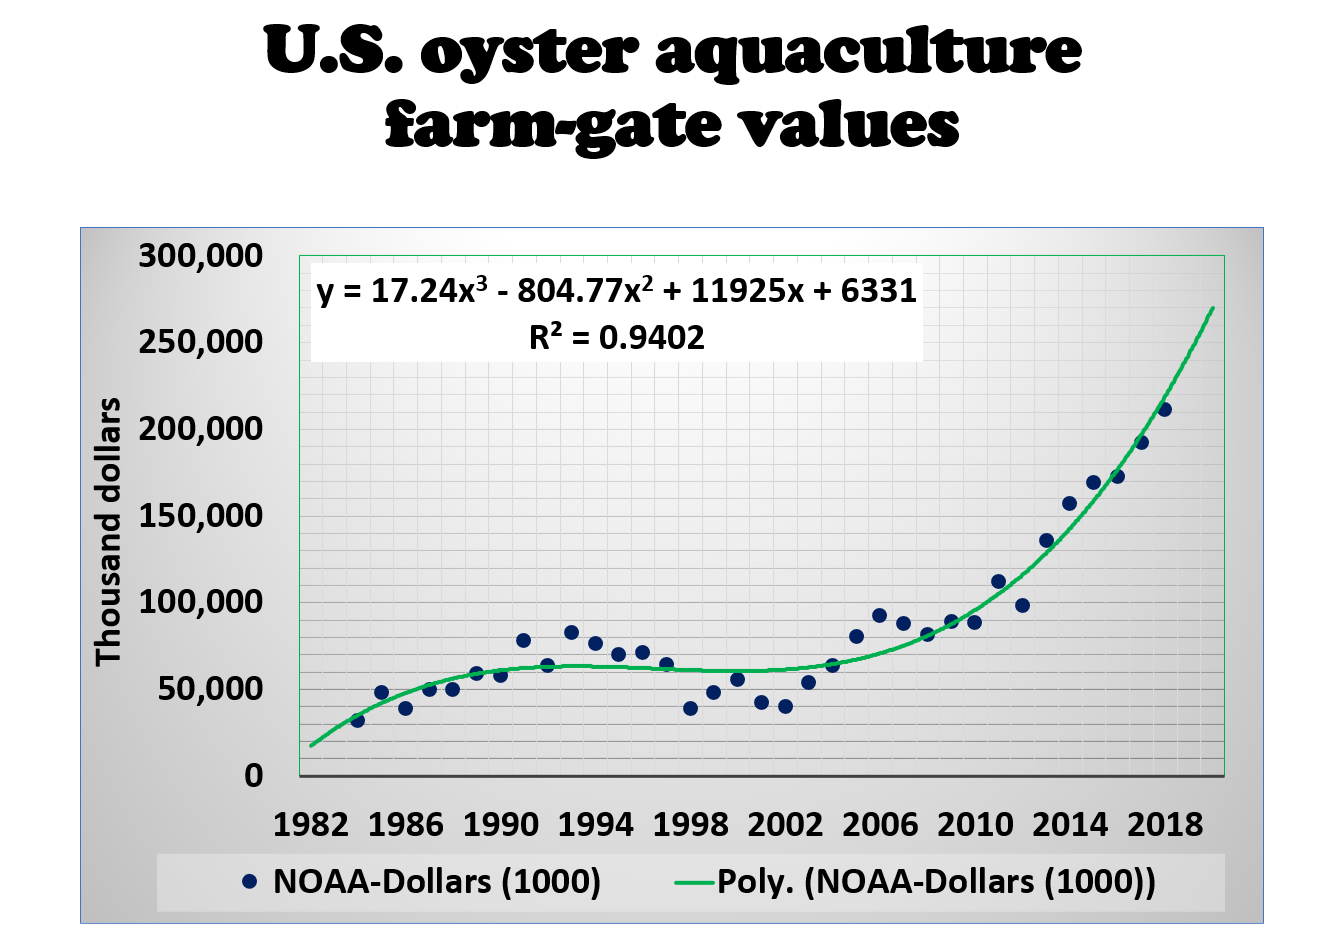
- Oyster aquaculture annual production went into three stages. It averaged 23 million pounds, valued at $60 million per year from 1984 to 1996 (Fig. 9-10).
- Between 1997 and 2008, annual oyster aquaculture production fell to 19 million pounds, with farmgate value averaging $62 million (Fig. 9-10).
- During the past decade, oyster aquaculture production continued to expand, averaging 35 million pounds per year, valued at $143 million (Fig. 9-10).
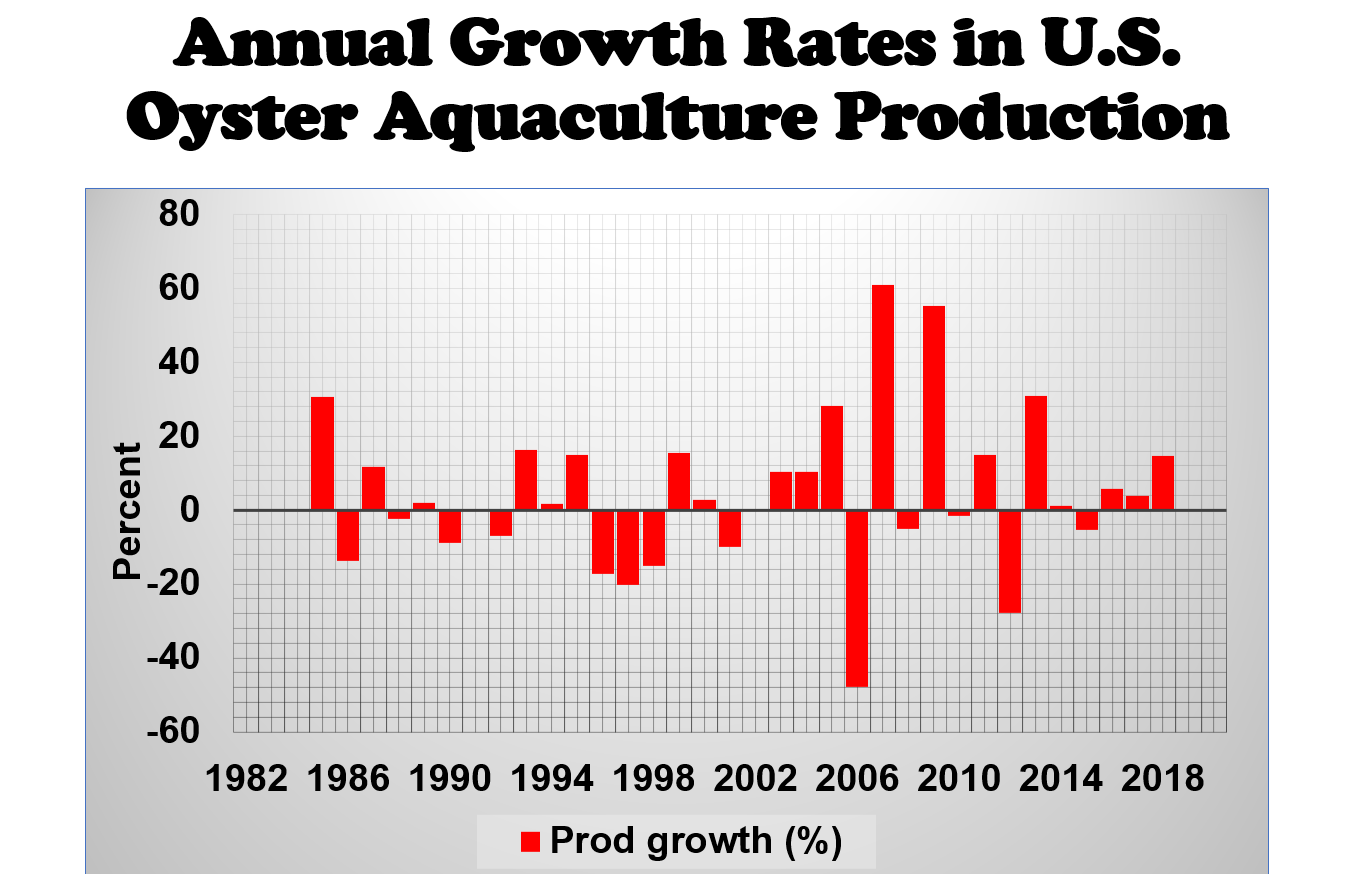
- Annual growth in oyster aquaculture fluctuated vigorously starting in 2005 until 2013. The annual growth rate rose recently, reaching over 14% in 2018 (Fig. 11).
- It is expected that the recent recession and the global Covid-19 pandemic negatively impacted the industry in recent years.
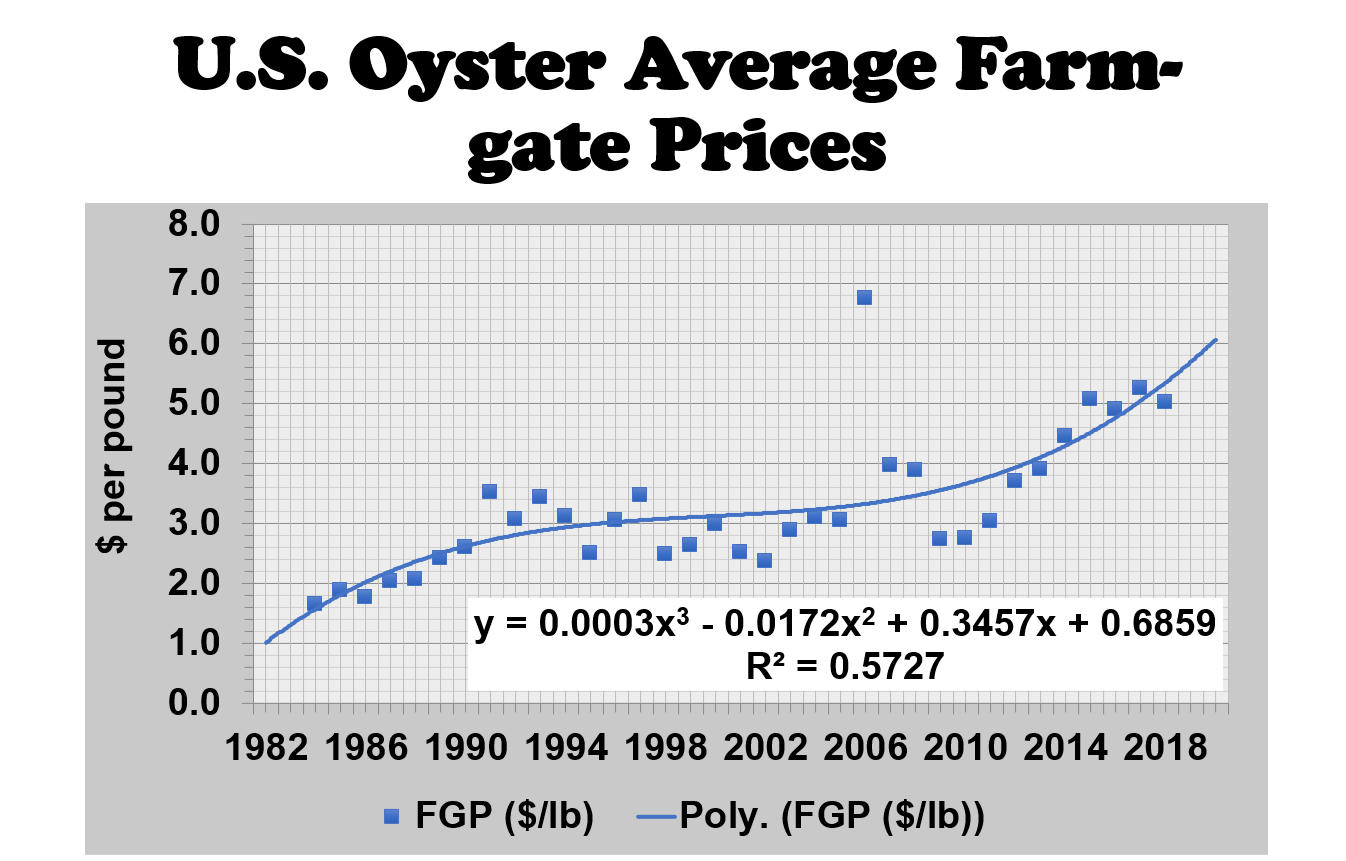
- The average farmgate prices started to rise in the 1980s and hovered around $3 per pound until the 1990s until the early 2000s (Fig. 12).
- After that, average farmgate prices fell, then climbed until 2018 reaching an average of $5 per pound of oyster meat (Fig. 12).
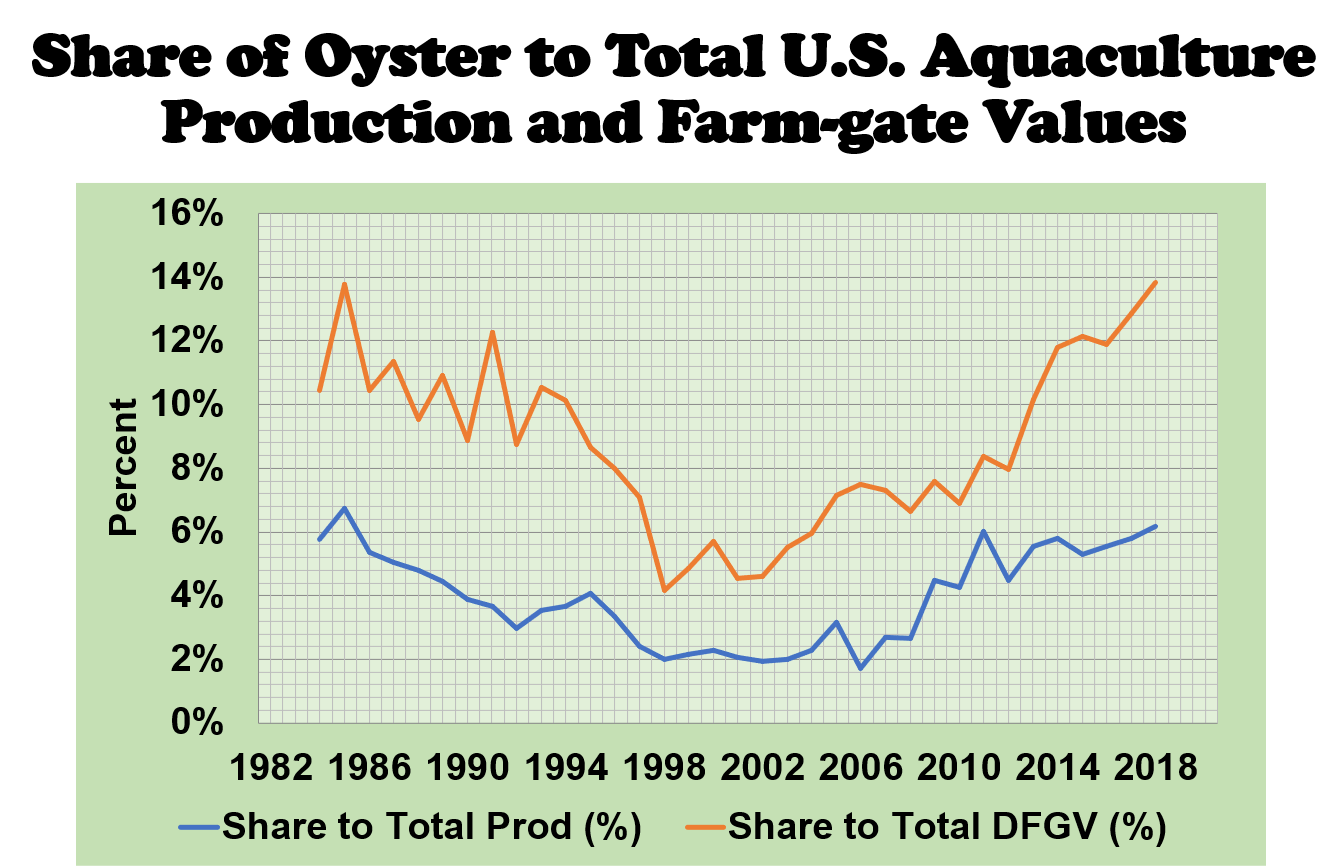
During the past decade, the share of oyster production to total aquaculture production averaged 5% of output and 10%, respectively (Fig. 13).
Summary Of Mississippi Oyster Aquaculture Program
- The Mississippi Department of Marine Resources Off-Bottom Oyster Aquaculture program has been increasingly successful since its start in 2018.
- The program includes classroom and field education in oyster aquaculture production and techniques, as well as aiding in the development of operational and business plans for their future in the industry.
- The Deer Island Aquaculture Park now provides upwards of 450 acres of potential aquaculture real estate, increasing from the 50 initial acres in 2018.
- After completing 2018 and 2019 classes, MDMR currently has 51 acres leased by 24 farmers and upwards of 2.8 million oyster seeds being cultured.
- MDMR’s 2020 class has more participants than ever before, so the expected number of leased acreage is expected to double industry production and sale volume.
- The source of raw data on farmgate prices, production, and farmgate values is the Mississippi Department of Marine Resources. The data in 2022 included the first nine weeks only.
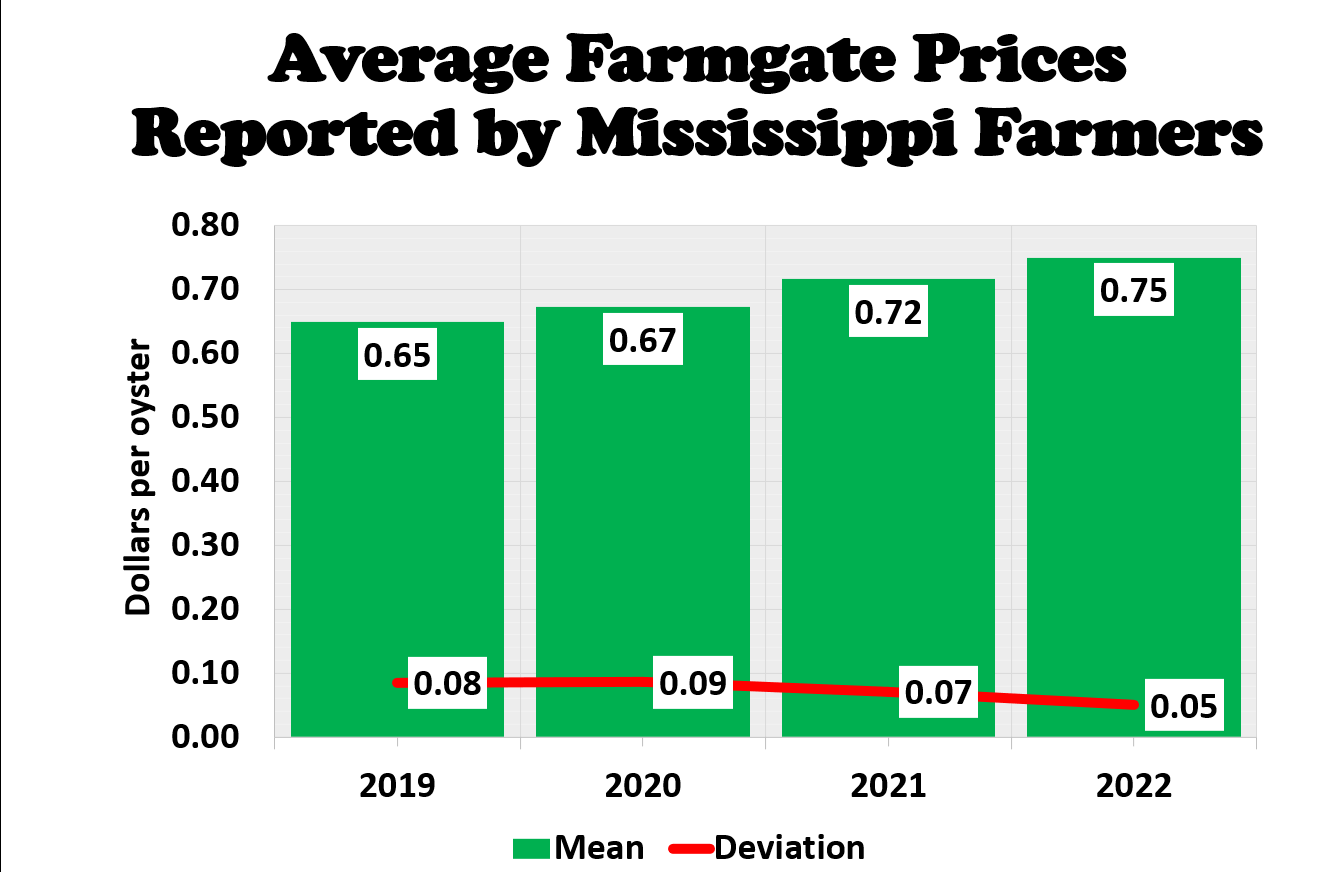
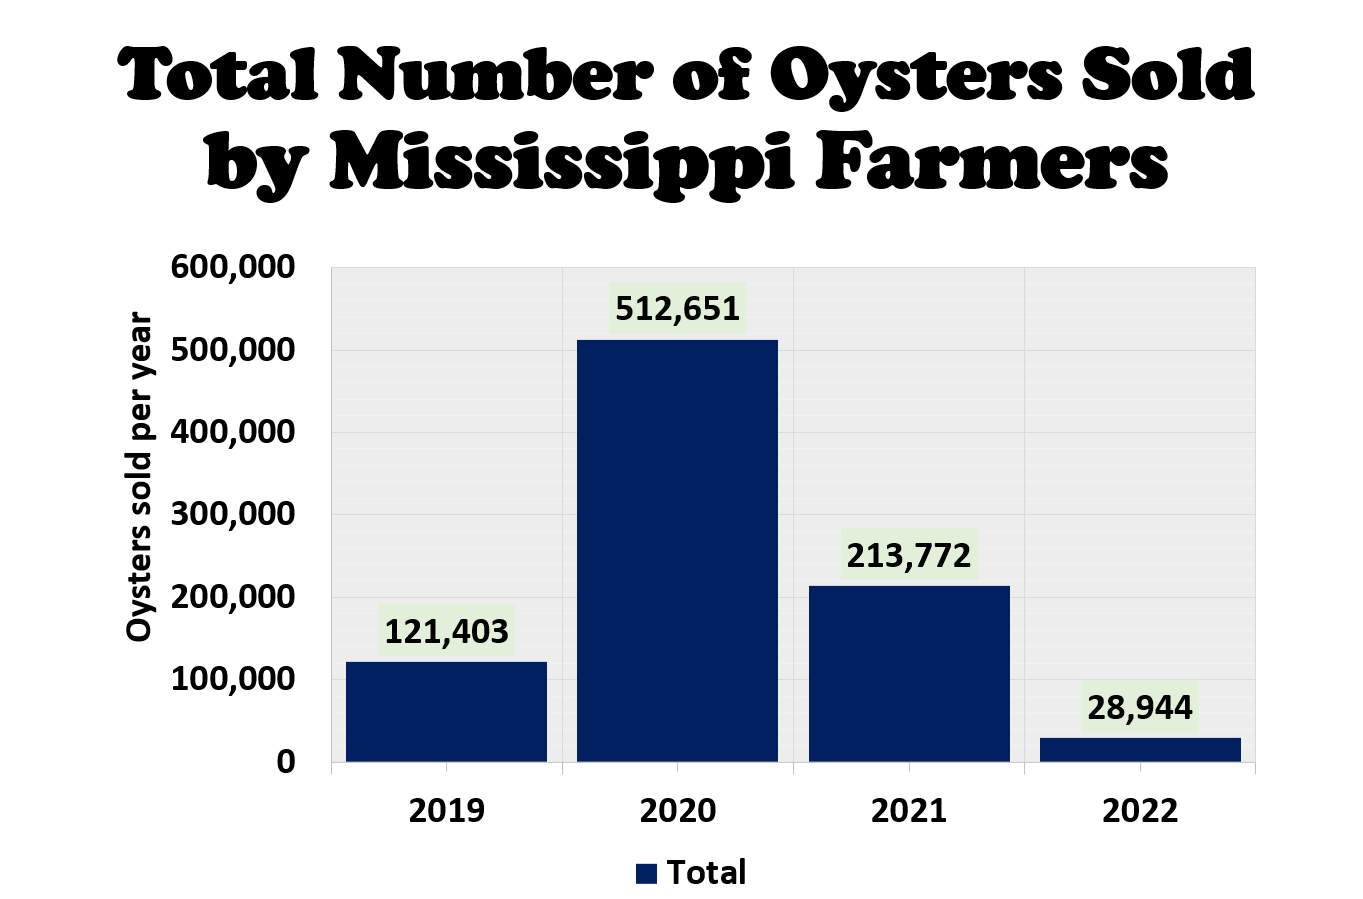
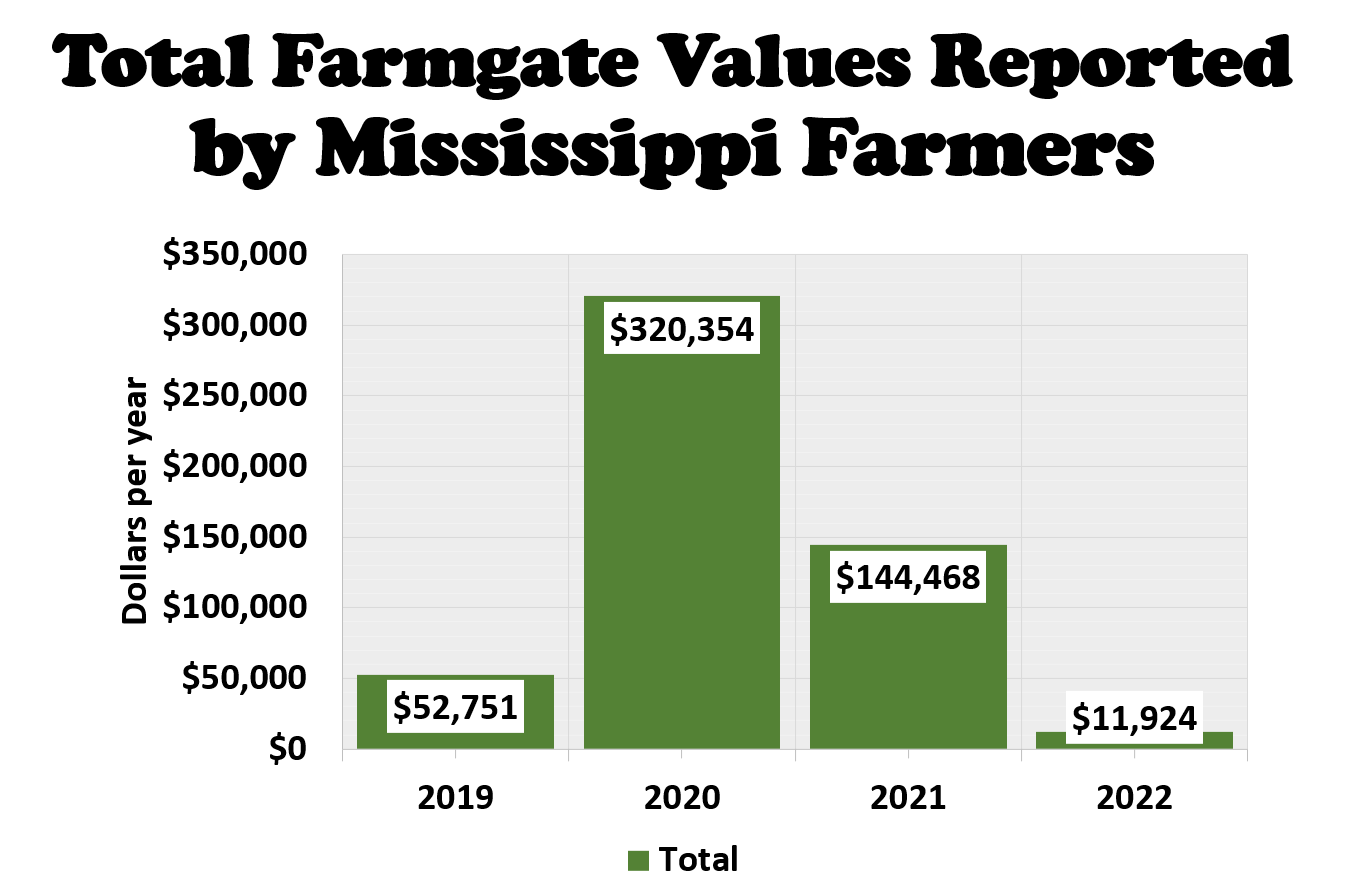
- The 2019 season was severely impacted by the prolonged double openings of the Bonnet Carre Spillway, reducing salinity to deadly levels in the grow-out areas (Fig. 14-16).
- In 2020, the off-bottom industry sold over half a million individual oysters at an average farmgate price of $0.67 per single oyster (Fig. 14-16).
- The 2021 season was adversely affected by the Covid-19 global pandemic when restaurant sales plummeted (Fig. 14-16).
Summary Of Oyster Supply
- The source of raw data is the NOAA Fisheries website.
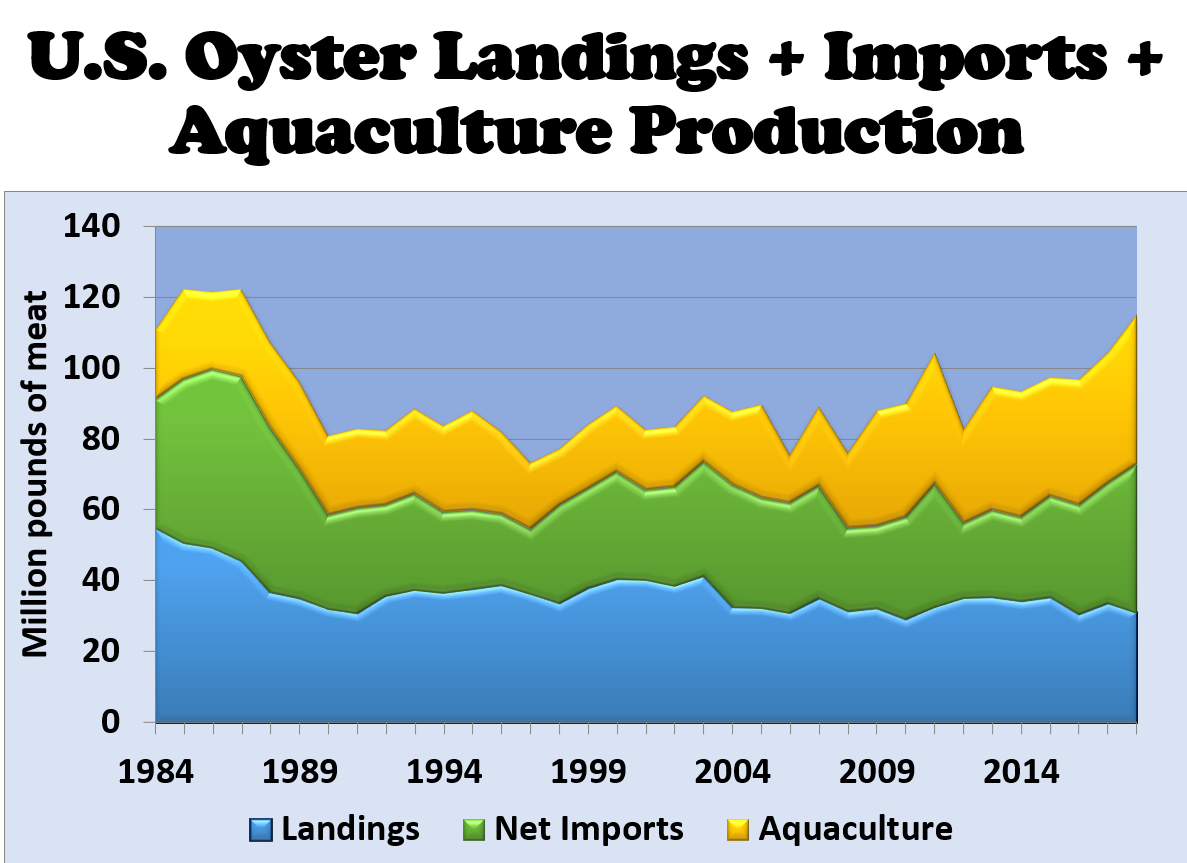
- The total supply of oyster products includes total landings, total imports, total aquaculture production, and inventory changes (Fig. 17).
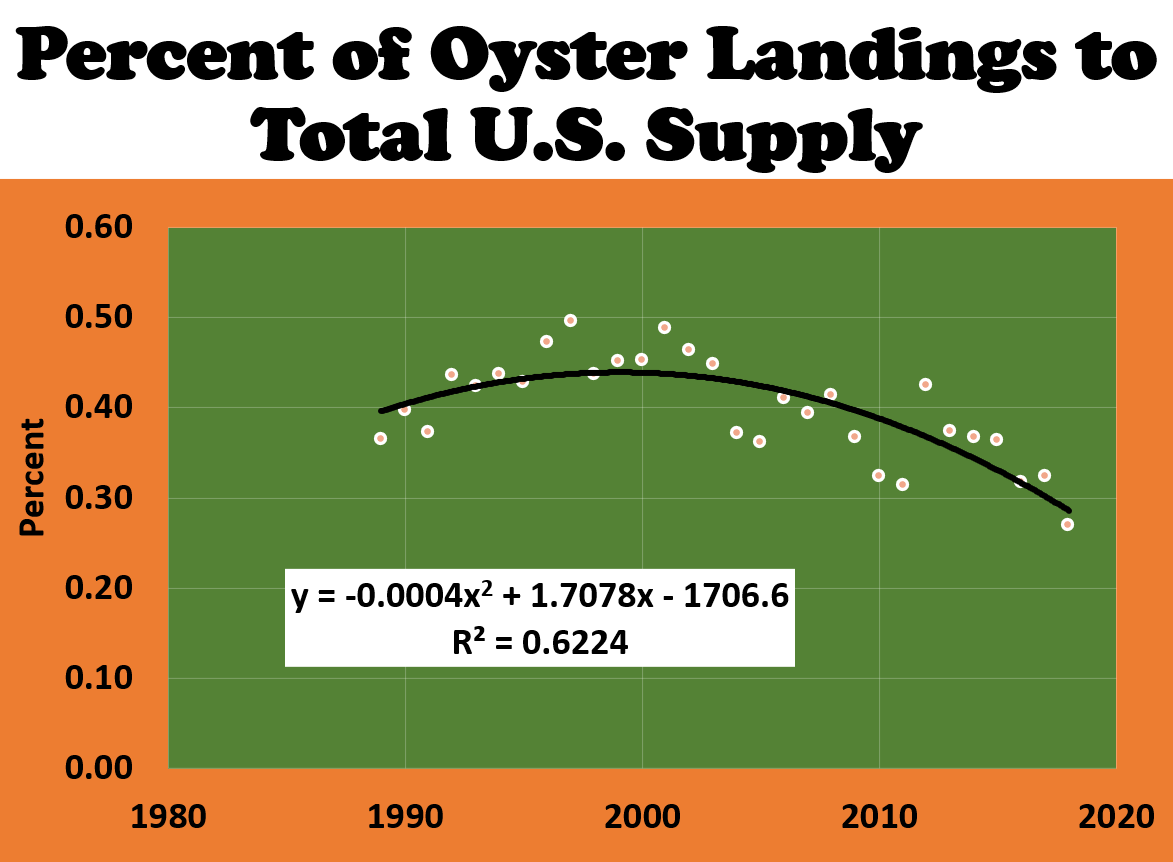
- Total oyster landings had been shrinking over time and contributed an average of 34% of the total supply during the past decade (Fig. 19).
- Total oyster imports averaged 37 million pounds during the last decade, while oyster exports reached 7 million pounds per year.
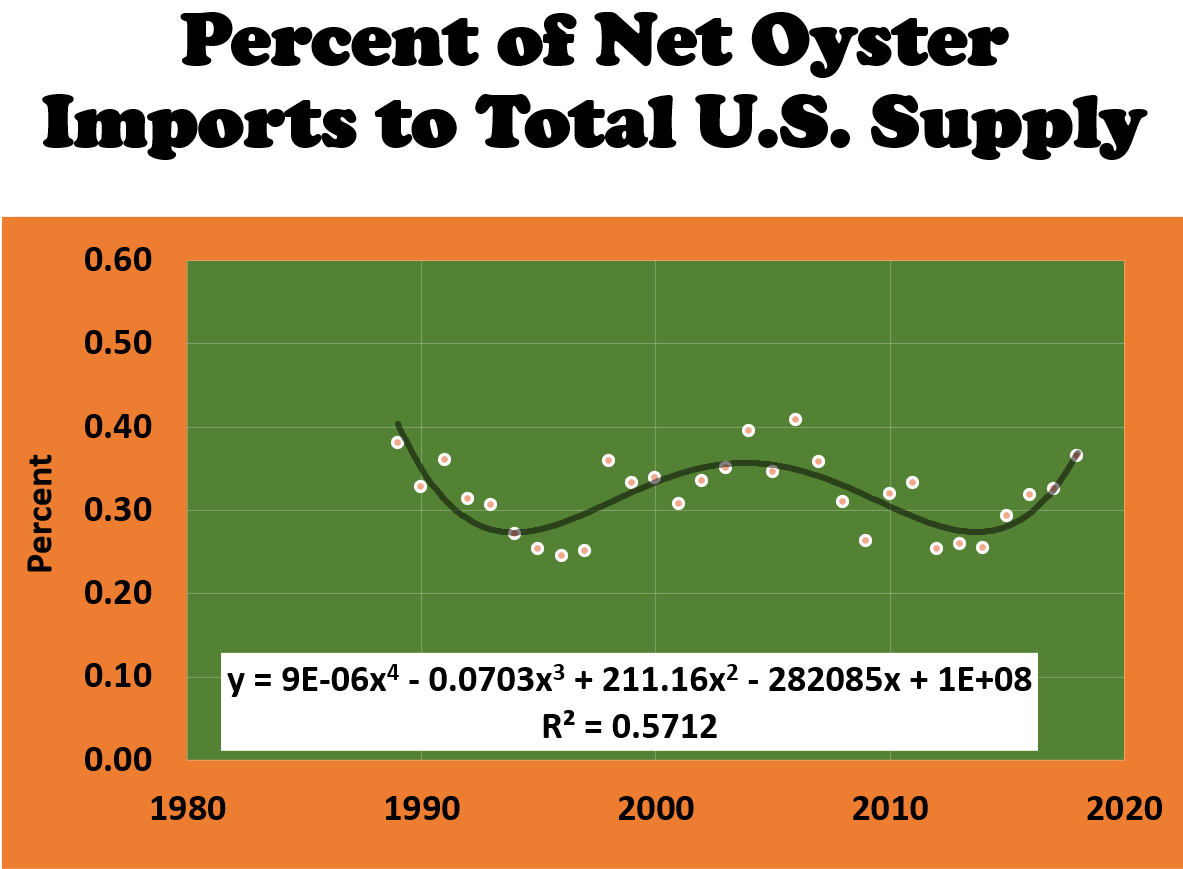
- The share of net imports of oysters to total supply has averaged 30% since 2011 (Fig. 18).
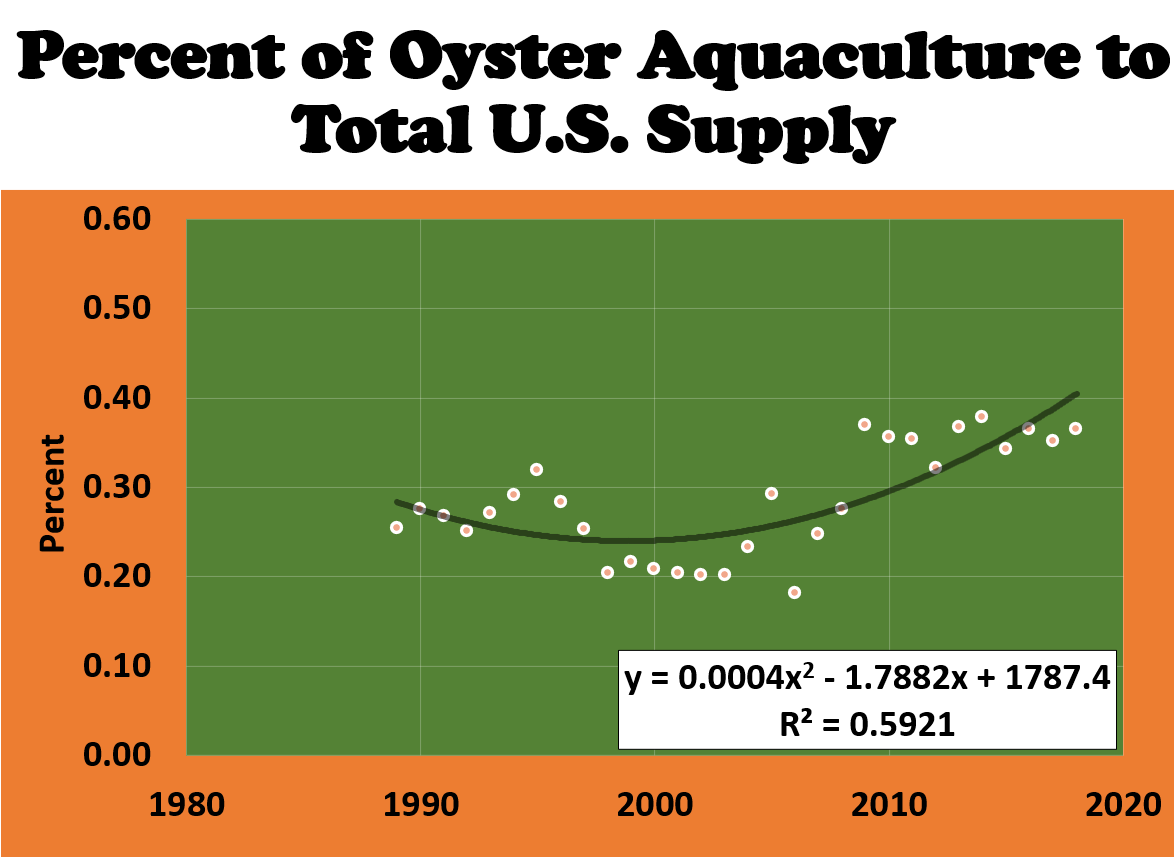
- Oyster aquaculture contributed an increasing share to the total supply averaging 36% during the past decade (Fig. 20).
Summary Of Oyster Prices And Consumption
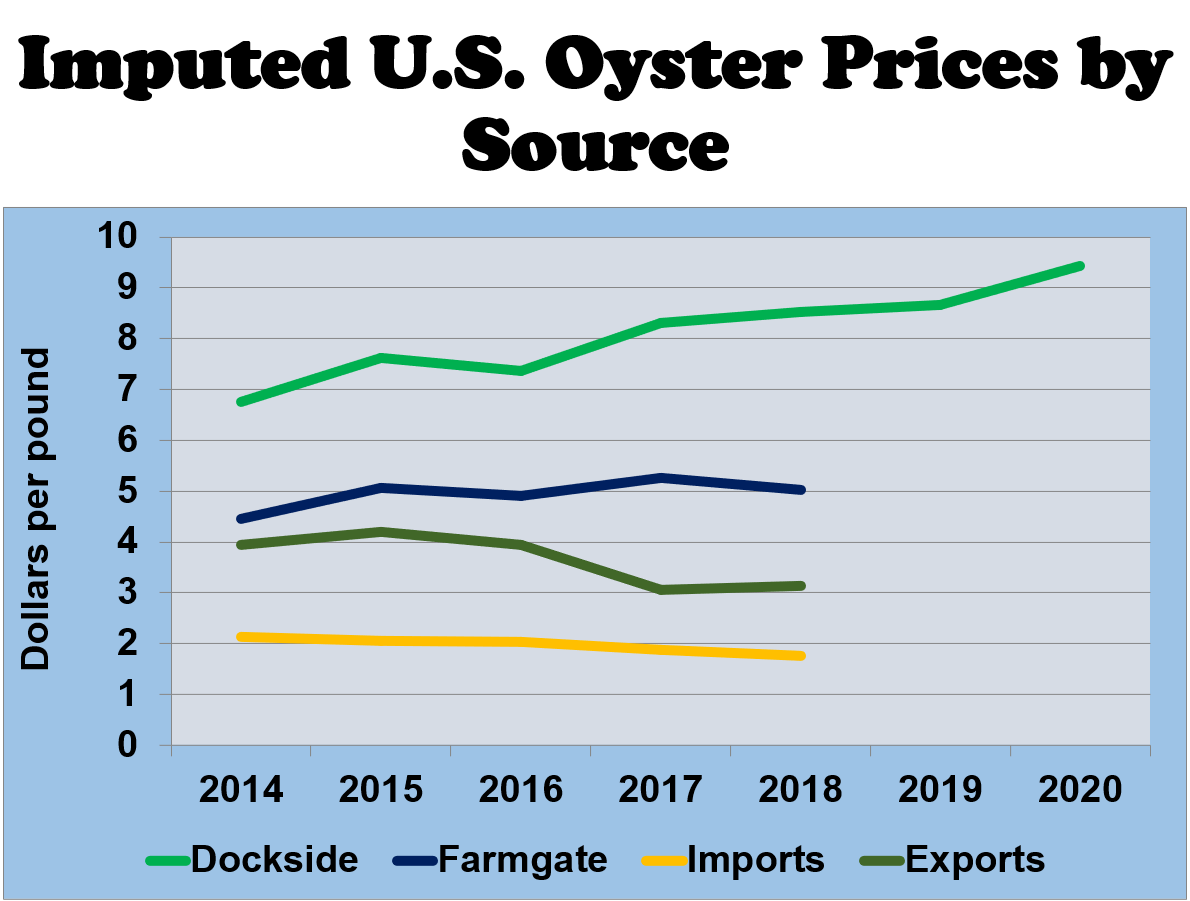
- Imputed prices were estimated by dividing the total value by quantity (Fig. 21).
- After 2014, wild-caught oysters were significantly more expensive than farmed oysters (Fig. 21).
- Wild oysters were sold at the docks from almost $7 to over $9 per pound of meat.
- Farmed oysters were sold from over $4 to $5 per pound at the farm gate.
- Average prices of imports of oysters hovered around $2 per pound.
- Oyster exports were valued between $3 and $4 per pound.
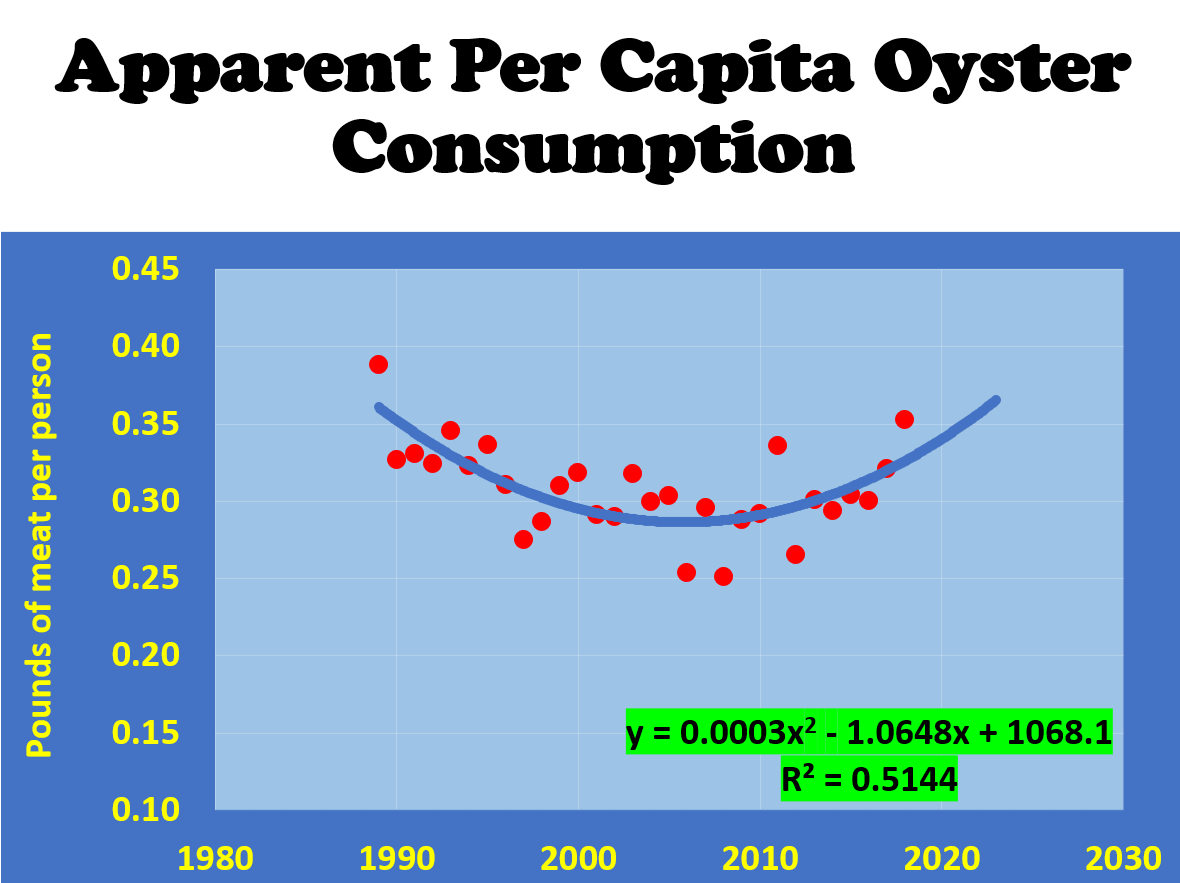
- Per capita consumption was estimated by dividing total supply or expenditures by the number of the civilian population.
- There are some unknown variables needed in making these estimates. There are no official estimates on oyster per capita consumption available online.
- These preliminary estimates show that per capita oyster consumption was 0.3 pounds (Fig. 22).
- Per capita oyster expenditures had continued to rise, averaging $1.50 per person (Fig. 23).
My Economic Outreach On Seafood Marketing And Prices
- Posadas, B.C. Long-term Shifts in Oyster Supply and Prices in U.S. Domestic Markets. Mississippi MarketMaker Newsletter, Vol. 12, No. 5. (May 24, 2022).
- Posadas, B. C. Recent Shrimp Dockside Prices In The Gulf Of Mexico States. Mississippi MarketMaker Newsletter, Vol. 12, No. 4. (May 2, 2022).
- Posadas, B.C. Impacts of the Global Pandemic on Prices of Catfish Products in U.S. Domestic Markets. Mississippi MarketMaker Newsletter, Vol. 12, No. 3. (Apr. 6, 2022.)
- Posadas, B.C. Impacts of the Global Pandemic on Prices of Major Mississippi Seafood Products. Mississippi MarketMaker Newsletter, Vol. 12, No. 2. (Feb. 25, 2022).
- Posadas, B.C. Economic Impacts of the Global Covid-19 Pandemic on U.S. Retail Prices of Selected Shellfish Species. Mississippi MarketMaker Newsletter, Vol. 11, No. 1. (Jan. 6, 2021).
- Posadas, B.C. Economic Impacts of the Global Covid-19 Pandemic on U.S. Retail Prices of Selected Fish Species. Mississippi MarketMaker Newsletter, Vol. 10, No. 11. (Dec. 8, 2020).
YouTube
- Posadas, B.C. Posadas, B.C. Long-term Shifts in Oyster Supply and Prices in U.S. Domestic Markets. Mississippi State University Coastal Research and Extension Center. Virtual Presentation. May 23, 2022.
- Posadas, B.C. Recent Shrimp Dockside Prices in the Gulf of Mexico States. Mississippi State University Coastal Research and Extension Center. Virtual Presentation. Apr. 18, 2022.
- Posadas, B.C. Price Outlook of U.S. Catfish Products. Mississippi State University, Coastal Research and Extension Center, Virtual Presentation. Apr. 5, 2022.
- Posadas, B.C. Price Outlook of Mississippi Seafood Products. Mississippi State University, Coastal Research and Extension Center, Virtual Presentation. Feb. 4, 2022.
- Posadas, B.C. Economic Impacts of the Global Covid-19 Pandemic on U.S. Retail Prices of Selected Shellfish Species. Mississippi State University, Coastal Research and Extension Center, Virtual Presentation. Jan. 5, 2021.
- Posadas, B.C. Economic Impacts of the Global Covid-19 Pandemic on U.S. Retail Prices of Selected Fish Species. Mississippi State University, Coastal Research and Extension Center, Virtual Presentation. Dec. 8, 2020.


