Seafood Economics
Mississippi Seafood Restaurants
Seafood restaurants include the retail trade of seafood products by eating and drinking places.
An online list of Mississippi seafood restaurants is posted on the Mississippi Department of Marine Resources website. Restaurants are listed by region and city.
A survey of Mississippi seafood restaurants found that the most commonly purchased fish was catfish, followed by tilapia, salmon, tuna, and snapper. The second group of fish species purchased by participating seafood restaurants included mahi-mahi, grouper, cobia, red drum, and sea trout. The third cluster of fish species served by the seafood restaurants that participated in the survey included pollock, black drum, cod, mullet, and haddock.
Shrimp was the most commonly purchased shellfish species by the participating establishments, followed by oysters, crawfish, scallops, and blue crabs. The second cluster of shellfish species purchased by participating seafood restaurants included snow crab, lobsters, squid, mussels, and clams. The third bundle of shellfish species served by the seafood restaurants that participated in the survey included Dungeness crab, king crab, octopus, and roe.
Seafood Restaurants' Long-term Sales and Job Contributions
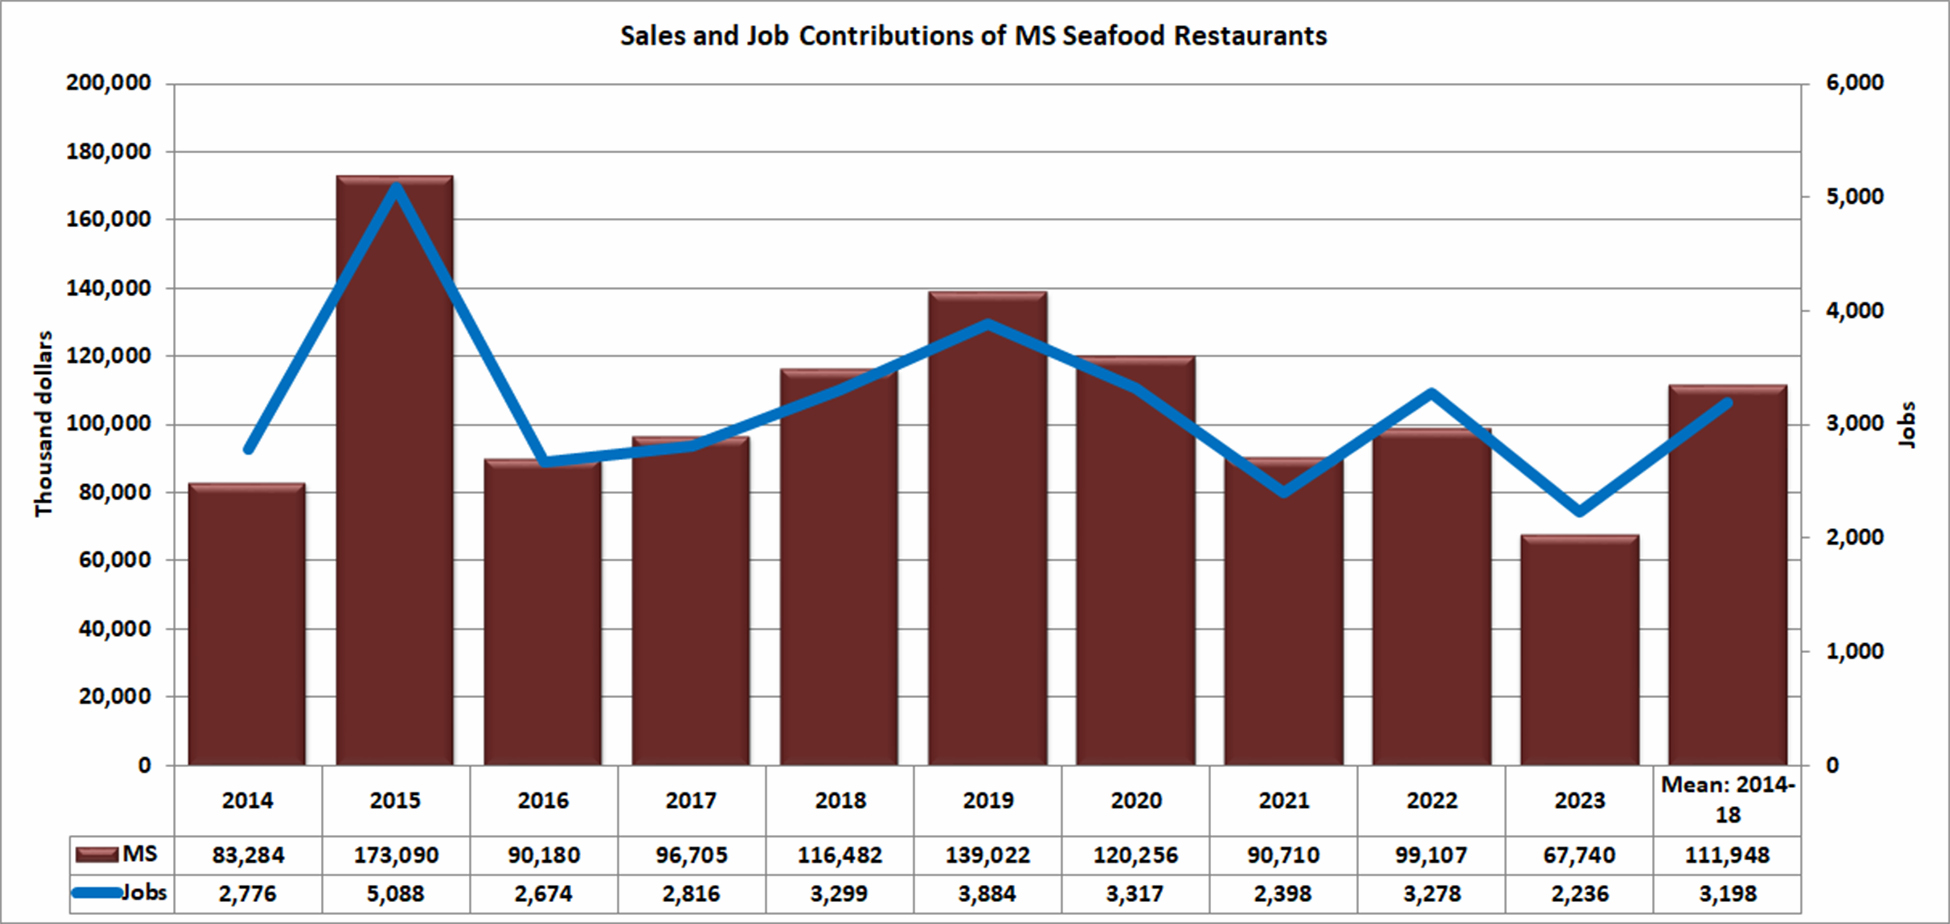
Sales are the gross sales by businesses within the economic region affected by an activity. The total sales contribution consists of direct, indirect, and induced sales. Mississippi seafood restaurants generated an average annual sales contribution of almost $112 million from 2014 to 2018 (Fig. 1). Overall, the Mississippi seafood restaurant sales contribution has not yet recovered from the 2019 disaster and global pandemic.
Job contributions are projected to be a mix of full-time and part-time jobs. The total job contribution is the sum of direct, indirect, and induced jobs. Mississippi seafood restaurants have created an average of more than 3,100 jobs from 2014 to 2023 (Fig. 1). Overall, the Mississippi seafood restaurant job contribution has not yet recovered from the 2019 disaster and global pandemic.
The average productivity of Mississippi restaurant industry workers can be measured by dividing sales contribution by job contribution. The average productivity of Mississippi seafood restaurant workers during the past five years was $34,000.
Full-service Restaurants' Demographic Characteristics
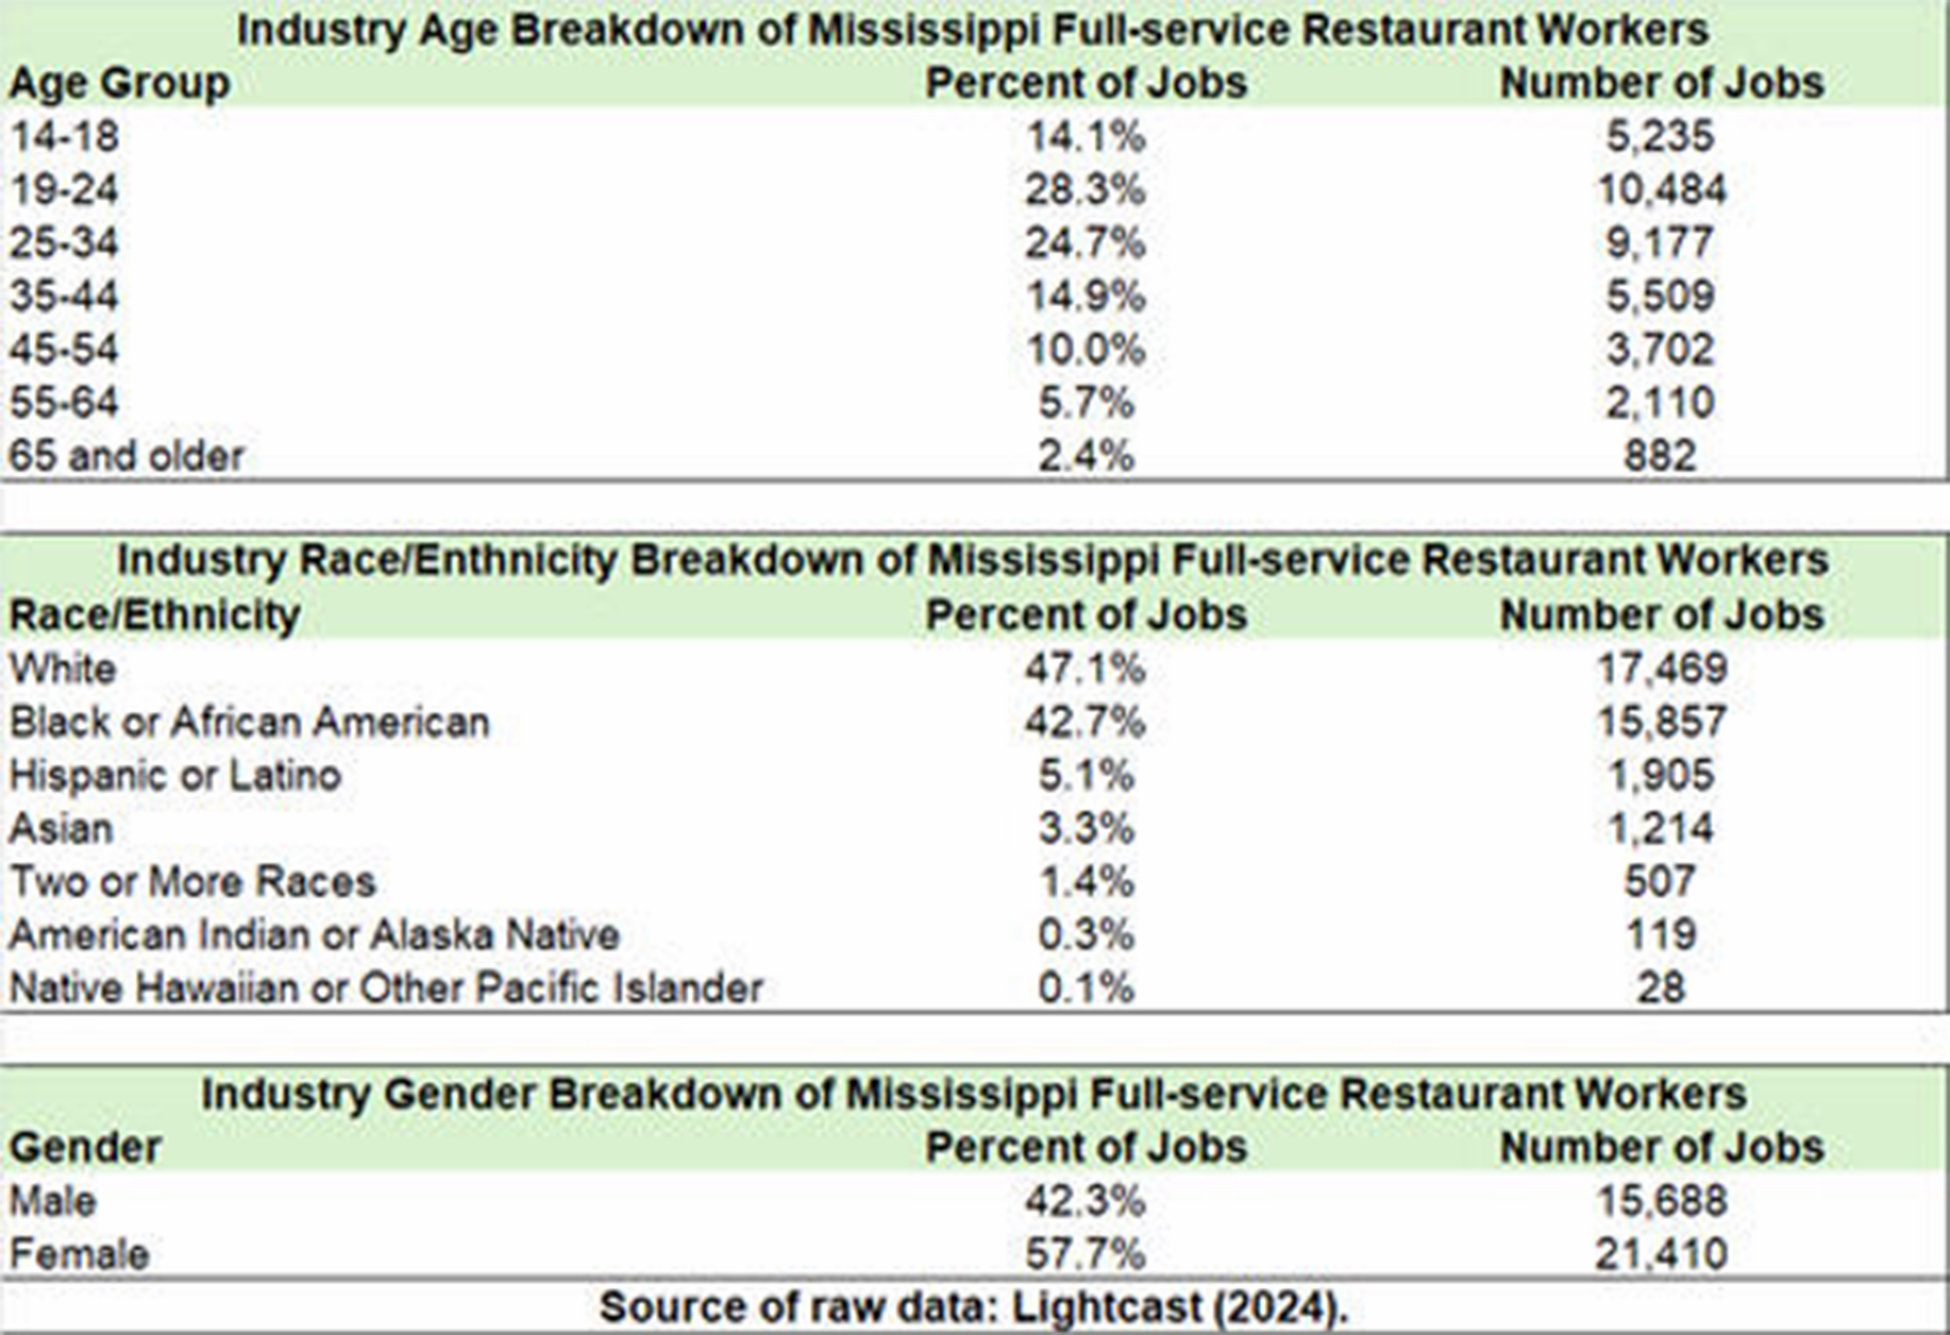
The demographic characteristics of full-service restaurant jobs in Mississippi are shown below. Most of the workers are between 19 and 34 years old. The racial breakdown of workers is primarily White and African American. Most of the workers are female.
Seafood Restaurants' Economic Contributions in 2023
Seafood restaurants generated economic activities and provided jobs in the state economy. Output or sales are the gross sales by businesses within the economic region affected by an activity. The total sales contribution consists of direct, indirect, and induced sales. The economic contributions of Mississippi seafood wholesaling in 2023 are shown in Fig. 1. The industry generated $67.7 million in annual sales contributions in 2023. The industry sales contribution in 2023 is lower than the benchmark average from 2014 to 2018.
Employment or job contributions are estimated as a mix of full-time and part-time jobs. The total employment contribution is the sum of direct, indirect, and induced jobs. The industry created 2,236 jobs in 2023. The industry job contribution in 2023 is lower than the benchmark average from 2014 to 2018.
Seafood Economics
- Commercial Fishing Industry
- Commercial Shrimp Industry
- Mississippi Commercial Crab Industry
- Mississippi Commercial Finfish Industry
- Mississippi Commercial Oyster Industry
- Mississippi Seafood and Fish Markets
- Mississippi Seafood Importing
- Mississippi Seafood Marketing
- Mississippi Seafood Processing
- Mississippi Seafood Restaurants
- Mississippi Seafood Wholesaling