Seafood Economics
Commercial Crab Industry
Mississippi Commercial Crab Industry
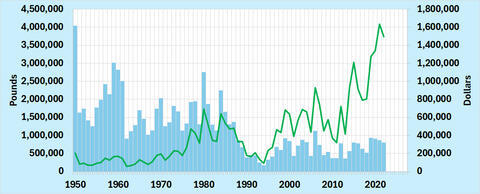
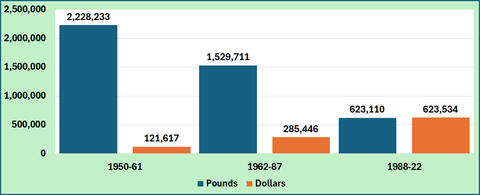
The annual Mississippi commercial blue crab landings and landing values from 1950 are shown below (Fig. 1). From 1950 to 1961, yearly landings averaged about 2.2 million pounds, valued at $120,000 (Fig. 2). Lower annual landings were reported from 1962 to 1987, averaging 1.5 million pounds, but valued higher at $285,000 per year. Since 1988, commercial landings declined to 620,000 pounds, valued higher, averaging $623,000 annually.
In response to requests by state regulatory agencies and seafood organizations, the 2009 (and later) economic contributions of the Mississippi seafood industry by major species were imputed from state estimates published by NOAA Fisheries. Extension and research publications were developed to document the economic contributions of Mississippi's major seafood species that landed, processed, sold, and consumed.
Sales are the gross sales by businesses within the economic region affected by an activity. Sales, income, value-added, and tax contributions are measured in dollars. Employment or job contribution is expressed in terms of a mix of both full-time and part-time jobs. The total economic contribution is the sum of direct, indirect, and induced contributions.
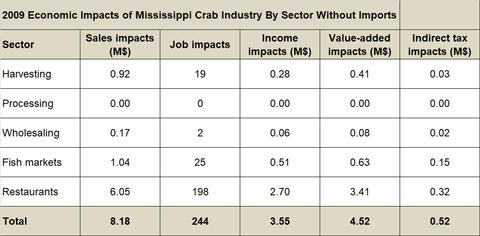
The economic contributions of the crab industry in 2009 are shown in the table below (Table 1). The sales contributions reached $8.18 million in 2009, generating 244 full-time and part-time jobs. Income contribution was $3.55 million, and value-added created was $4.52 million. The industry added tax impacts, reaching $0.52 million.
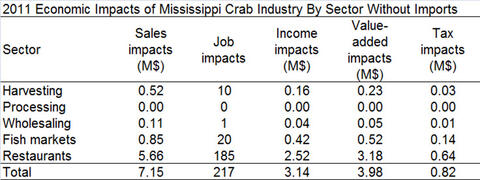
Lower economic contributions of the Mississippi crab industry were estimated in 2011, as shown in the table below (Table 2). The crab industry's sales contributions reached $7.15 million and generated about 217 full-time and part-time jobs. Income contributions reached $3.14 million, and the value-added created was $3.98 million. The industry made tax impacts totaling $0.82 million.
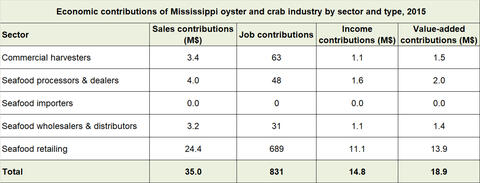
The 2015 estimates of the economic contributions of Mississippi's combined crab and oyster industries are shown below (Table 3). Due to the confidentiality of the 2015 data, NOAA Fisheries estimates were combined for the two species. The combined sales contributions totaled $35 million and generated 831 full-time and part-time jobs. Pooled-income contributions were $14.8 million, and the value-added created was $18.9 million.
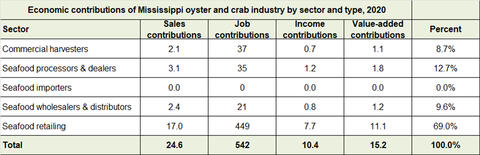
Below are the 2020 estimates of the economic contributions of Mississippi's combined crab and oyster industries (Table 4). Due to the confidentiality of the 2015 data, NOAA Fisheries estimates were combined for the two species. The combined sales contributions were lower, totaling $24.6 million, and generated 542 full-time and part-time jobs. Pooled-income contributions were $10.4 million, and the value-added created was $15.2 million.
- Commercial Crab Industry
- Commercial Fishing Industry
- Commercial Oyster Industry
- Commercial Shrimp Industry
- Mississippi Commercial Finfish Industry
- Mississippi Seafood and Fish Markets
- Mississippi Seafood Importing
- Mississippi Seafood Marketing
- Mississippi Seafood Processing
- Mississippi Seafood Restaurants
- Mississippi Seafood Wholesaling