P4092
Irrigation in Mississippi: 2025 Update
This publication summarizes key facts about agricultural irrigation in Mississippi. All data were compiled from the Census of Agriculture and from the Irrigation and Water Management Survey, which were most recently conducted in 2022 and 2023, respectively, by the United States Department of Agriculture’s National Agricultural Statistics Service.
Irrigation Expansion
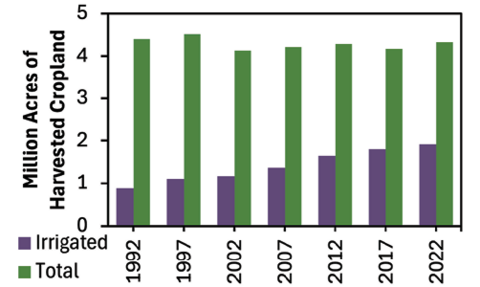
Irrigated cropland area in Mississippi has more than doubled during the past three decades, even though total cropland area in the state has remained similar (Figure 1). Over 1.9 million acres of harvested cropland are irrigated in Mississippi.
Geographical Distribution
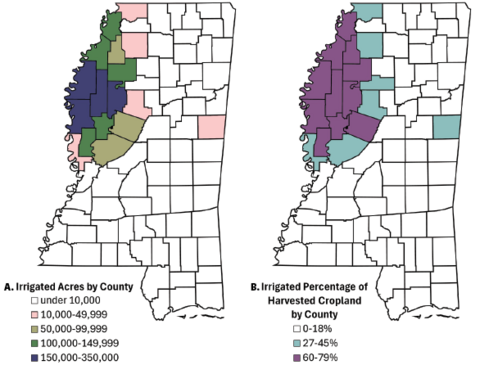
Most of the irrigated land in Mississippi is in the Delta. The central Delta counties in dark blue account for 6% of Mississippi’s land area but 51% of all irrigated land in the state (Figure 2A). In terms of the irrigated percentage of harvested cropland, the counties of Mississippi can be grouped into three clusters: 0-18%, 27–45%, and 60–79%. All counties in the highest cluster and all but one county in the middle cluster are at least partially within the Delta (Figure 2B).
Crops Receiving Irrigation
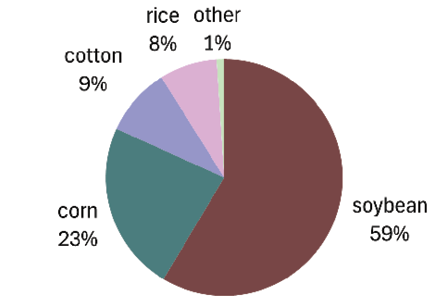
Soybean, corn, cotton, and rice are the most common crops on irrigated cropland in Mississippi. Averaging across the four most recent surveys, these four crops are grown on 59%, 23%, 9%, and 8% of irrigated cropland in the state, respectively.
Application Methods
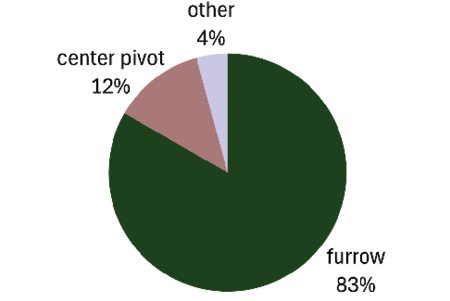
Furrow irrigation and center-pivot irrigation are the most common methods of applying irrigation both in Mississippi and in the United States as a whole. As of 2023, furrow and center-pivot application methods are used on 83% and 12%, respectively, of irrigated open fields in Mississippi, in contrast to 19% and 49% in the entire country.
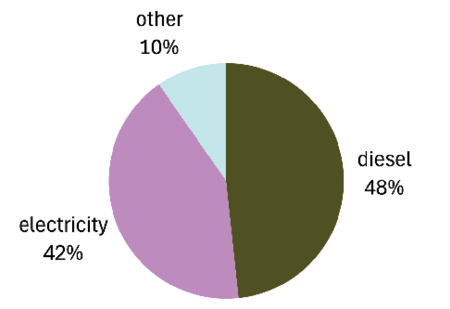
Energy Sources
Diesel and electricity are the most common sources of energy for irrigation pumping in Mississippi and in the United States as a whole. As of 2023, the two energy sources are used on 48% and 42%, respectively, of irrigated open fields in Mississippi, in contrast to 21% and 72% in the entire country.
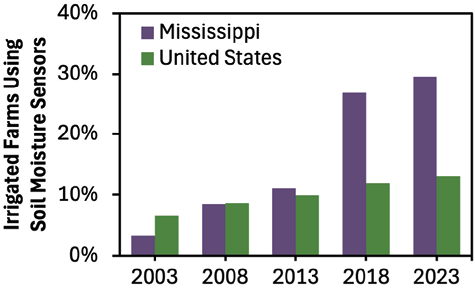
Soil Moisture Sensors
Mississippi has become the state with the highest rate of soil moisture sensor usage for scheduling irrigation. As of 2023, soil moisture sensors were used on 30% of irrigated farms in Mississippi, compared with 13% in the entire country.
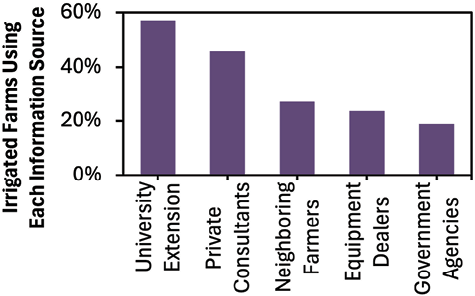
Information Sources
Extension remains the most popular source of information for improving irrigation in Mississippi. As of 2023, Extension was used for this purpose by 57% of irrigated farms in the state, as compared with 42% in the entire country.
For more information, please contact Extension Irrigation Specialist Drew Gholson (drew.gholson@msstate.edu).
This publication is a contribution of the National Center for Alluvial Aquifer Research (NCAAR). NCAAR is supported by the Agricultural Research Service, United States Department of Agriculture, under Cooperative Agreement number 58-6066-2-023.
Publication 4092 (POD-10-25)
By Himmy Lo, PhD, Assistant Extension/Research Professor; Drew Gholson, PhD, Associate Professor; Dillon Russell, Extension Specialist I, Delta Research and Extension Center; Dave Spencer, PhD, Assistant Professor, Plant and Soil Sciences; and Mary Love Tagert, PhD, Extension Professor, Agricultural and Biological Engineering.
The Mississippi State University Extension Service is working to ensure all web content is accessible to all users. If you need assistance accessing any of our content, please email the webteam or call 662-325-2262.
Download

P4092
Irrigation in Mississippi: 2025 Update
505.28 KB
Authors
-
 Extension Specialist I
- Delta Research and Extension Center
-
 Associate Professor
- Plant and Soil Sciences
-
 Associate Professor
- Water Resources Research Institute
-
 Extension Professor
- Ag & Bio Engineering
-
Asst Extension/Research Prof
- Delta Research and Extension Center