P4149
Mississippi Deer Damage in Row Crops Survey
Mississippi row crop producers face many economic challenges every year. One issue that is becoming increasingly more common is the impact of deer depredation on crop yields. While crop insurance does help cover some of the losses incurred from deer damage, it does not always show the full impact of producer losses.
Surveys of producers on this issue have found that deer cause significant crop losses. A 2016 study found that deer caused an estimated $141.82 per acre in damages for Georgia producers. Similarly, in a survey of cotton growers, county Extension agents, and consultants, a 2024 survey found that deer reduced yield by 34–42% on affected acres, costing cotton producers $152 million in 2023.
To help determine the extent of the issue in Mississippi, the Mississippi State University Extension Service and Department of Agricultural Economics conducted a survey of Mississippi producers. Following is a summary of the results from that survey, focusing primarily on corn, cotton, and soybeans.
Results
There were 207 responses in total; however, many of the respondents did not answer all of the questions in the survey. Producers were asked how many acres of crops they planted, the number of acres that were impacted, and their estimated yield loss. Producers reported yield losses in 12 different crops, with the majority of losses in corn, cotton, and soybeans.
Additionally, producers were asked if any acres had to be replanted and the costs of the replant. The responses were then used to calculate an economic loss. The economic loss was calculated by multiplying the yield loss by the respective crops’ price and the acres impacted, and then adding the replanting costs. Crop prices used in the calculation were $4.35 per bushel for corn, $10.10 per bushel for soybeans, and $0.635 per pound for cotton.
Of the surveys that had all the economic damage information filled out, 13 respondents reported damages in corn, 21 reported damages in cotton, and 90 reported damages in soybeans. Respondents reported damage occurring in 45 Mississippi counties.
For corn, cotton, and soybeans, 17,830 total acres were reported to be affected by deer damage, with a total economic impact of $4.6 million (Table 1). The damaged acres accounted for 17% of the total acres planted by the respondents.
Soybeans were by far the most impacted, with 90 respondents reporting damages on 14,204 acres, of which 4,013 acres had to be replanted. Total economic loss for soybeans was $3.68 million, or $258.91 per acre. Cotton had the second-most acres impacted at 2,066; of those acres, 597 had to be replanted. Total economic loss for cotton was $640,733, or $310.21 per acre. Lastly, producers reported 1,561 acres of corn damaged, with 171 acres requiring replanting. Economic loss for corn was $294,109, or $188.46 per acre.
| Item | Corn | Cotton | Soybeans |
|---|---|---|---|
| Respondents | 13 | 21 | 90 |
| Acres planted | 9,222 | 9,507 | 84,243 |
| Acres damaged | 1,561 | 2,066 | 14,204 |
| Acres replanted | 171 | 597 | 4,013 |
| Average yield loss | 38 bu/ac | 416 lb/ac | 24 bu/ac |
| Crop price | $4.35/bu | $0.635/lb | $10.10/bu |
| Total economic loss | $294,109.90 | $640,732.63 | $3,677,496.10 |
| Average loss per acre | $188.46 | $310.21 | $258.91 |
| Average loss per respondent | $22,623.84 | $30,511.08 | $40,861.07 |
To better understand the geographic distribution of reported deer-related losses, economic damage was summarized by county across Mississippi. Figure 1 shows the reported economic losses for corn, cotton, and soybeans by county. Based on the survey results, a total of $5.35 million in deer-related damage was reported across 45 counties. Soybeans accounted for the majority of the loss, followed by cotton and then corn.
Monroe County reported the highest total loss at $1.17 million, driven by a greater number of survey responses from that area. Other counties with relatively high reported losses included Lowndes County ($626,223), Noxubee County ($522,666), and Coahoma County ($456,050). In contrast, some counties had much lower losses, with several under $5,000 in total damage.
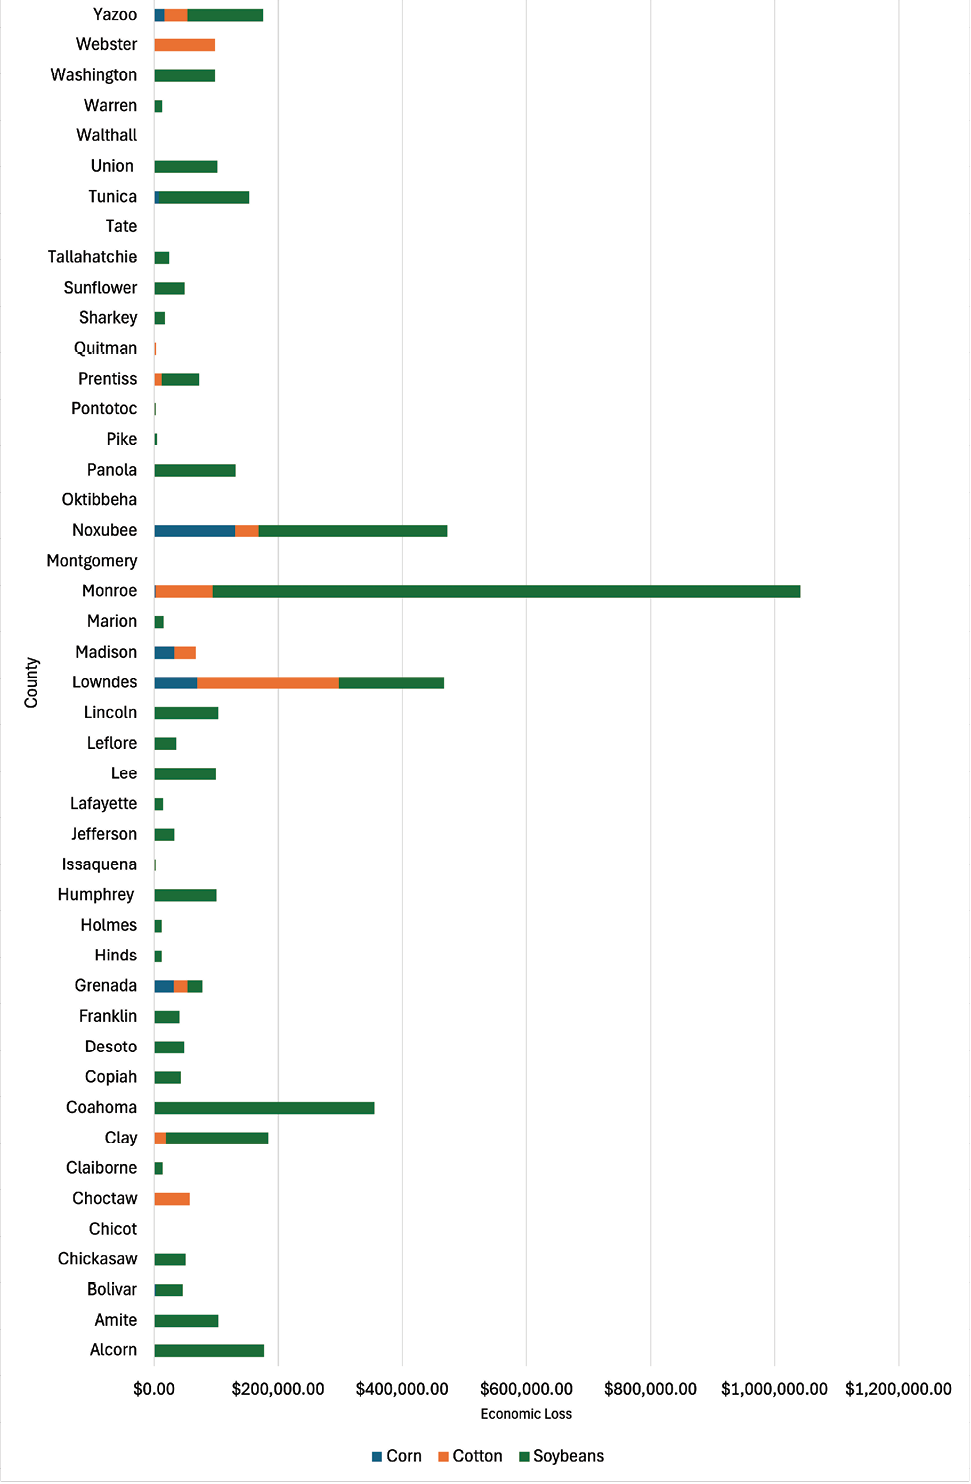
These differences reflect variation in both the level of deer damage and the number of producers who responded to the survey from each county. It is important to note that counties with higher reported losses may not necessarily experience greater deer pressure; rather, these values may reflect a larger sample of producers providing complete economic data in those areas.
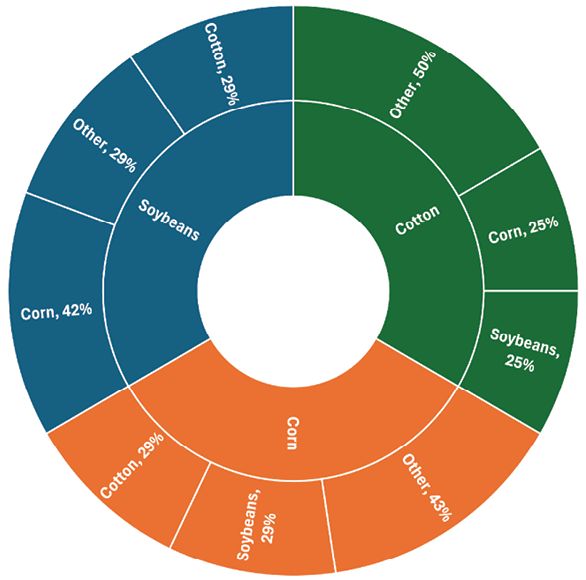
In addition to yield losses and replanting costs, producers were asked whether they avoided planting certain crops altogether due to concerns about deer damage. Producers reported avoiding a total of over 13,000 acres across corn, soybeans, and cotton. In these cases, alternative crops were planted in place of the avoided crop.
Figure 2 summarizes the percentages of replacement crops planted instead of the avoided crop. For example, among avoided corn acres, 29% were planted with soybeans, 29% with cotton, and 43% with other crops. Similarly, for avoided soybean acres, 42% were replaced with corn, 29% with cotton, and 29% with other alternatives. Cotton avoidance showed a comparable pattern, with 25% replaced with corn, 25% with soybeans, and 50% with other crops. These findings suggest that anticipated deer damage may influence crop selection and rotational decisions beyond the scope of immediate economic loss.
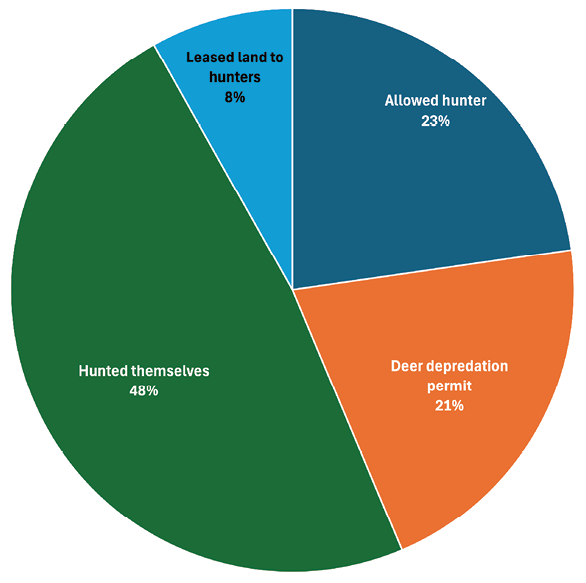
Producers were also asked a series of questions on what actions they took to reduce deer damage on their land (Figure 3). The most common method used to control deer was hunting by the producers at 48% of respondents. This was followed by allowing other hunters on the land (23%) and securing a deer depredation permit (21%).
Producers were also asked how they perceived deer population trends over time in their area. Specifically, they were asked whether they believe the deer population on land they own, lease, or rent has increased, decreased, or stayed the same, or if they were unsure, compared to 1 year ago, 3 years ago, and 5 years ago (Figure 4). Compared to last year, 60% of respondents reported that the deer population had increased, 5% reported a decrease, 29% believed it stayed the same, and 5% were unsure. Compared to 3 years ago, almost 80% reported an increased deer population, 3% reported a decrease, 17% saw no change, and 2% were unsure. Finally, compared to 5 years ago, almost 80% indicated that the deer population had increased, 6% reported a decrease, 11% saw no change, and 6% were unsure.
Among producers who reported that the deer population had increased, follow-up responses were collected to better understand the contributing factors behind these observations (Figure 5). Producers could select multiple responses from a provided list. The most frequently cited reasons were a lack of hunters targeting female deer (63 responses), a lack of overall hunting pressure (44 responses), and producers believing their crops are the deer’s primary food source (36 responses).
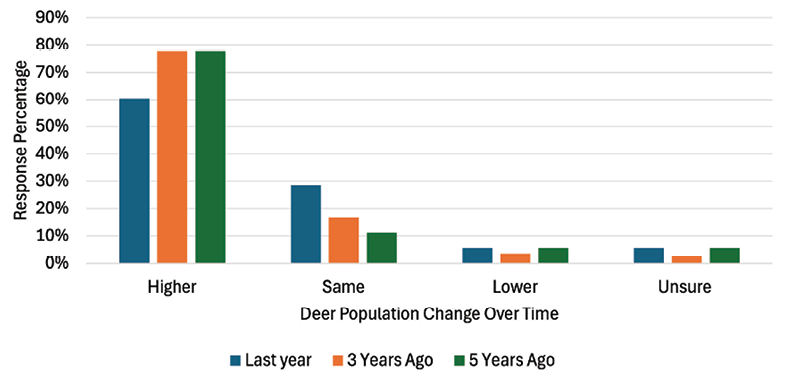
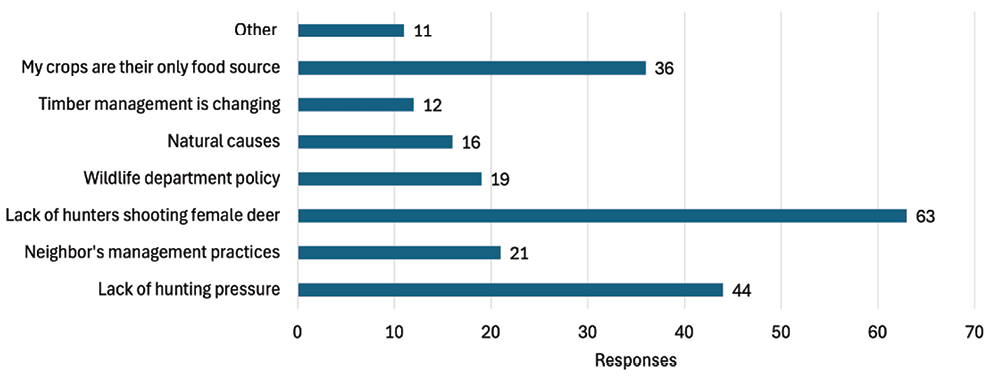
Figure Data Tables
| County | Corn | Cotton | Soybeans | Total Economic Loss |
|---|---|---|---|---|
| Alcorn | 176,750 | 176,750 | ||
| Amite | 103,560 | 103,560 | ||
| Bolivar | 2,610 | 43,524.50 | 46,134.50 | |
| Chickasaw | 50,865 | 50,865 | ||
| Chicot | 10.10 | 10.10 | ||
| Choctaw | 57,150 | 57,150 | ||
| Claiborne | 13,225 | 13,225 | ||
| Clay | 19,050 | 164,485 | 183,535 | |
| Coahoma | 354,550 | 354,550 | ||
| Copiah | 42,610 | 42,610 | ||
| Desoto | 48,480 | 48,480 | ||
| Franklin | 40,562.50 | 40,562.50 | ||
| Grenada | 32,100 | 22,050 | 23,200 | 77,350 |
| Hinds | 12,075 | 12,075 | ||
| Holmes | 12,120 | 12,120 | ||
| Humphrey | 100,415 | 100,415 | ||
| Issaquena | 2,222 | 2,222 | ||
| Jefferson | 32,750 | 32,750 | ||
| Lafayette | 14,600 | 14,600 | ||
| Lee | 99,075 | 99,075 | ||
| Leflore | 35,494 | 35,494 | ||
| Lincoln | 103,145 | 103,145 | ||
| Lowndes | 69,600 | 228,168.50 | 169,100 | 466,868.50 |
| Madison | 32,400 | 34,050 | 66,450 | |
| Marion | 14,900 | 14,900 | ||
| Monroe | 2,283.75 | 91,675 | 947,609 | 1,041,567.75 |
| Montgomery | 444.50 | 444.50 | ||
| Noxubee | 130,412.50 | 38,038.13 | 303,615 | 472,065.63 |
| Oktibbeha | 757.50 | 757.50 | ||
| Panola | 131,000 | 131,000 | ||
| Pike | 4,545 | 4,545 | ||
| Pontotoc | 2,508 | 2,508 | ||
| Prentiss | 11,950 | 60,400 | 72,350 | |
| Quitman | 3,175 | 3,175 | ||
| Sharkey | 17,271 | 17,271 | ||
| Sunflower | 49,237.50 | 49,237.50 | ||
| Tallahatchie | 23,800 | 23,800 | ||
| Tate | ||||
| Tunica | 7,475 | 145,662.50 | 153,137.50 | |
| Union | 101,250 | 101,250 | ||
| Walthall | 435 | 435 | ||
| Warren | 12,605 | 12,605 | ||
| Washington | 481.15 | 97,717.50 | 98,198.65 | |
| Webster | 98,044 | 98,044 | ||
| Yazoo | 16,312.50 | 36,937.50 | 121,800 | 175,050 |
| Total | 294,109.90 | 640,732.63 | 3,677,496.10 | 4,612,338.63 |
| Avoided Crop | Replacement Crop |
|---|---|
| Soybeans | Corn (42%) Cotton (29%) Other (29%) |
| Corn | Cotton (29%) Soybeans (29%) Other (43%) |
| Cotton | Soybeans (25%) Corn (25%) Other (50%) |
| Action | Respondents |
|---|---|
| Allowed hunter | 25 (23%) |
| Deer depredation permit | 23 (21%) |
| Hunted themselves | 53 (48%) |
| Leased land to hunters | 9 (8%) |
| Compared to | Higher | Same | Lower | Unsure |
|---|---|---|---|---|
| Last year | 55 (60%) | 26 (29%) | 5 (5%) | 5 (5%) |
| 3 Years Ago | 70 (78%) | 15 (17%) | 3 (3%) | 2 (2%) |
| 5 Years Ago | 70 (78%) | 10 (11%) | 5 (6%) | 5 (6%) |
| Description | Number of Respondents |
|---|---|
| Lack of hunting pressure | 44 |
| Neighbor’s management practices | 21 |
| Lack of hunters shooting female deer | 63 |
| Wildlife department policy | 19 |
| Natural causes | 16 |
| Timber management is changing | 12 |
| My crops are their only food source | 36 |
| Other | 11 |
Conclusion
These results do not show the full impact of deer damage in Mississippi since not all producers completed the survey. The damages could be higher than what is reported here. Also, producers who were more severely affected by deer damage would be more likely to fill out the survey. The economic loss also depends on the year—if crop prices were higher, the economic loss would be greater. Furthermore, there are other costs outside of yield and replant, such as not planting the desired or most profitable crop.
References
Hand, L. C., Roberts, P., & Taylor, S. (2024). Growers, consultants, and county agents perceive white-tailed deer to be the most economically impactful pest of Georgia cotton. Crop, Forage, & Turfgrass Management, 10(e70007).
Mengak, M., & Crosby, M. (2016). Farmers’ perceptions of white-tailed deer damage to row crops in 20 Georgia counties during 2016. University of Georgia Extension Publication WSFNR-17-38.
Publication 4149 (POD-10-25)
By Brianna Croft, Master’s Student, Agricultural Economics; Brian E. Mills, PhD, Associate Professor, Agricultural Economics; Steve Martin, PhD, Extension Professor, Delta Research and Extension Center; Will Maples, PhD, Associate Professor, Agricultural Economics; and Curt Lacy, PhD, Extension/Research Professor, Central Mississippi Research and Extension Center. Funding for this survey was provided by the Mississippi Soybean Promotion Board.
The Mississippi State University Extension Service is working to ensure all web content is accessible to all users. If you need assistance accessing any of our content, please email the webteam or call 662-325-2262.
Download

P4149
Mississippi Deer Damage in Row Crops Survey
654.66 KB
Authors
-
 Associate Professor
- Agricultural Economics
-
 Professor and Head
- Central MS Research & Ext Center
-
 Extension Professor
- Delta Research and Extension Center
-
 Associate Professor
- Agricultural Economics