P2732
Protect Your Pine Plantation Investment by Thinning
Thinning at the proper time is one of the best strategies for protecting your pine plantation investment and increasing the value of that investment. Thinning is a silvicultural treatment used to reduce stand density, which improves tree growth, enhances forest health, and can help recover the value of trees that otherwise might die.
The establishment of a pine plantation requires planting more trees per acre than desired for final harvest at the end of the rotation or growing cycle. This is primarily to control the form and value of the timber produced. Planting too few trees will cause large persistent limbs within the first log section, which will greatly reduce the value of the future timber harvest.
Increasing the planting density will control limb production by “shading” the lower limbs. The tree will then naturally prune the limbs over time. However, as the stand ages and trees grow in size, there will not be enough space for all the trees. Eventually the trees will begin to compete with one another for space, water, and nutrients. This competition will slow the trees’ growth. The objective of thinning at the proper time is to reduce the number of trees in the pine plantation before the stand becomes too dense and tree growth begins to slow.
It is not uncommon for timber landowners to neglect timely thinning of pine plantations. In some cases, thinning is intentionally delayed in hopes of receiving a higher price for pulpwood, which is a lower-valued product primarily harvested at thinning. However, the practice of delaying thinning is not a sound strategy to maximize the wealth of a long-term pine plantation investment. Delaying a thinning introduces an increased risk of density-related mortality from direct competition between trees and can increase the probability of a southern pine beetle infestation.
Also, there is no certainty of seeing a pulpwood price increase if thinning is delayed. However, if prices do increase, any short-term gain associated with delaying the thinning will most likely result in a long-term loss. Delaying thinning slows the growth of the remaining trees, resulting in longer rotations and reduced value for the pine plantation.
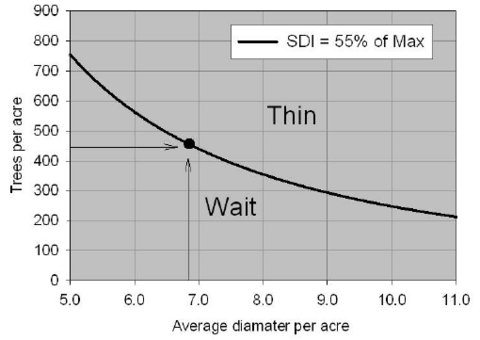
To demonstrate the value of thinning, a typical pine plantation was modeled using a computer growth and yield simulator. Timber growth over time was projected along with future timber volumes from thinnings and final harvest. The pine plantation scenarios included three different sites that are capable of producing a dominant tree height of 60 feet, 70 feet, and 80 feet in 25 years. Dominant tree height in feet produced by a given timberland site is referred to as site index (SI). For each of the three site indices, an initial planting density of 681 trees per acre (TPA) was used. The year of thinning and number of trees to remove during each thinning were determined using stand density index (SDI) criteria (a measure of site occupancy). Research suggests thinning a stand when SDI is 55 percent of maximum, and leaving a residual number of trees that is equal to 35 percent of maximum SDI. The maximum SDI for loblolly pine is 450. The formula for SDI is:
Stand Density Index = TPA(DIA/10)1.605
Where: TPA = trees per acre
DIA = quadratic mean diameter
Ideally, trees are thinned before the point of density related mortality (SDI = 55 percent of max), and the number of trees retained in the stand after thinning (SDI = 35 percent of max) should ensure adequate site occupancy (no growing space is wasted). This is illustrated in Figure 1.
The thinning regimes for each of the three sites are listed in Table 1. A management regime refers to the specific combination of thinnings and final harvest age for a site.
For each of the three scenarios, the timing of the final harvest was based on maximizing land expectation value (LEV). The financial formula used to calculate LEV is:
LEV = [Net Value in Year n] ÷ [(1+i)n – 1]
Where: i = interest rate in decimal percent
n = the rotation age in years
| Base age 25 | Age | Current (before thinning) TPA | Current average stand diameter | Residual (after thinning) TPA | Residual average stand diameter |
|---|---|---|---|---|---|
| 60 | 17 | 565 | 6.4 | 274 | 7.1 |
| 70 | 14 | 561 | 6.3 | 287 | 6.9 |
| 80 | 13 | 550 | 6.5 | 268 | 7.2 |
| Base age 25 | Age | Current (before thinning) TPA | Current average stand diameter | Residual (after thinning) TPA | Residual average stand diameter |
|---|---|---|---|---|---|
| 60 | 30 | 260 | 10.1 | 142 | 10.7 |
| 70 | 22 | 278 | 9.5 | 158 | 10.0 |
| 80 | 21 | 257 | 10.2 | 138 | 10.9 |
LEV can be thought of as the value of land for growing trees for a specific management regime. LEV is equal to the net present worth of all future expected cash flows discounted by some minimum acceptable rate of return or discount rate.The management regime with the highest LEV is considered to be financially optimal. For the three scenarios considered, a discount rate of 5 percent was used, and stand establishment cost (tree planting and site preparation) was estimated at $191.49 per acre. Product volumes from thinnings and final harvest were valued using the following product prices: $37.73 per ton for sawtimber, $21.19 per ton for chip-n-saw, and $8.20 per ton for pulpwood.
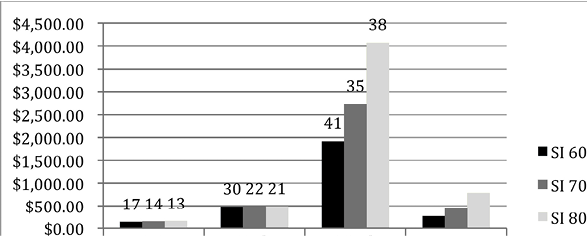
Using SDI criteria to determine biologically optimal thinning ages and LEV criteria to determine financially optimal final harvest ages produces the following management regimes and associated revenues by site index for each thinning and final harvest (Figure 2).
| Site index | 1st thinning | 2nd thinning | Final harvest | LEV |
|---|---|---|---|---|
| 60 | 130.97 | 474.96 | 1,912.89 | 264.04 |
| 70 | 136.64 | 480.27 | 2,725.66 | 447.16 |
| 80 | 149.81 | 482.71 | 4,066.76 | 793.49 |
Consider the financial implications of delaying a first thinning treatment. As previously mentioned, the financially optimal management regimes for each of the three site indices were determined using LEV criteria. The final harvest age that results in the greatest LEV is the financially optimal harvest age. If first thinning was delayed 1 or 2 years, how much would pulpwood prices have to increase in those years to justify that decision based on LEV criteria? The required increase in pulpwood prices does not include compensation for the increased risk a delayed thinning can introduce. For each of the three site indices, the pulpwood price was increased until the LEV was greater than or equal to the LEV of the previously identified financially optimal management regime. See Tables 2 and 3.
| Site index | LEV ($/acre) | LEV loss by 1-year delay ($/acre) | Increase in pulpwood price needed to avoid loss (%) | Increase in pulpwood price needed to avoid loss ($/ton) |
|---|---|---|---|---|
| 60 | 264.04 | 5.65 | 8 | 0.66 |
| 70 | 447.16 | 15.23 | 15 | 1.23 |
| 80 | 793.49 | 22.19 | 20 | 1.64 |
| Site index | LEV ($/acre) | LEV loss by 1-year delay ($/acre) | Increase in pulpwood price needed to avoid loss (%) | Increase in pulpwood price needed to avoid loss ($/ton) |
|---|---|---|---|---|
| 60 | 264.04 | 7.75 | 11 | 0.90 |
| 70 | 447.16 | 19.35 | 18 | 1.48 |
| 80 | 793.49 | 30.50 | 27 | 2.21 |
Thinning “on time” results in higher LEVs than management regimes where the first thinning is delayed for 1 or 2 years. For all three site indices, the LEV continually declined as thinning was delayed for both 1 and 2 years. The assumption here is that first-thinning pulpwood prices did not increase or decrease. Recall that the rationale for some landowners delaying a first thinning is the expectation (or hope) of higher pulpwood prices.
In the case of the SI 60 site, pulpwood prices from a first thinning would have to be at least 8 percent higher, or 66 cents per ton, to result in a comparable LEV. If the thinning is delayed 2 years, then the pulpwood price would have to be 11 percent higher, or 90 cents per ton. For more productive timberland, the pulpwood price increase required to justify delaying thinning is even greater. Site index 70 requires first-thinning pulpwood prices to be 15 percent higher, or $1.23 per ton, to justify a 1-year delay in thinning and 18 percent higher, or $1.48, to justify a 2-year delay. The required pulpwood price increase is even more extreme for site index 80, where pulpwood prices would have to increase 20 percent, or $1.64 per ton, to justify a 1-year delay and 27 percent, or $2.21 per ton, to justify a 2-year delay.
The values described above are only examples and will vary with establishment costs, number of trees planted, current market conditions, product values, etc. However, as this example demonstrates, the better the site, the more costly the delay. Slow-growing pine plantations on poorer sites (SI 60 or lower) may be able to afford a temporary delay in thinning, but this is not the case for fast-growing plantations on good sites (SI 70 or higher). Pine plantations on good sites lose too much money with a thinning delay. The pulpwood prices necessary to avoid investment value losses can be very high, and there is no certainty that those prices will be realized.
Conclusion
Thinning at the proper time not only improves the overall health of your pine plantation, but also sets the stage for future higher valued products such as chip-n-saw and sawtimber. Unfortunately, many landowners will choose to wait to conduct the first thinning in hopes of securing higher stumpage prices for pulpwood, but delaying a thinning treatment brings increased risk of tree mortality and the chance of a pine beetle outbreak as the growth rates slow and trees become more stressed. Thinning “on time” is one of the best strategies to reduce the risk of southern pine beetle attack.
As shown here, the required stumpage prices for landowners to break even after delaying thinning are extremely high and unrealistic, particularly for more productive timberland (higher site indices). Delaying thinning with the expectation of increased pulpwood prices is not a sound strategy to maximize the wealth of a long-term pine plantation investment.
References
Dean, T. J., & Chang, S. J. (2002). Using simple marginal analysis and density management diagrams for prescribing density management. Southern Journal of Applied Forestry, 26(2), 85–92.
North Carolina State University. (n.d.). Managed pine plantation growth and yield simulator (Version 3.1).
Self, A. B., Measells, M. K., & Henderson, J. E. (2022). Financial considerations. In M. J. Wallace & A. J. Londo (Eds.), Managing the family forest in Mississippi. Mississippi State University Extension Service Publication 2470.
Self, A. B., Traugott, T. A., & Dicke, S. (2022). Are my pine trees ready to thin? Mississippi State University Extension Service Publication 2260.
Publication 2732 (POD-12-25)
Reviewed by Sabhyata Lamichhane, PhD, Assistant Professor, Forestry, from an earlier version by James E. Henderson, PhD, Extension Professor and Head, Coastal Research and Extension Center, and Andrew J. Londo, PhD, former Extension/Research Professor, Forestry.
The Mississippi State University Extension Service is working to ensure all web content is accessible to all users. If you need assistance accessing any of our content, please email the webteam or call 662-325-2262.
Download

P2732
Protect Your Pine Plantation Investment by Thinning
170.44 KB
Departments
Authors
-
 Assistant Professor
- Forestry