P4130
2024 Mississippi Statewide Needs Assessment Survey
About This Report
Mississippi State University Extension provides research-based information, educational programs, and technology transfer focused on issues and needs of Mississippians, enabling them to make informed decisions about their well-being. With offices in all 82 counties and on tribal lands of the Mississippi Band of Choctaw Indians (MBCI), MSU Extension’s unique interdisciplinary perspective enables the organization to make a real difference in the lives of Mississippians.
From late 2024 to early 2025, MSU Extension conducted a statewide needs assessment survey to better understand community needs and priorities. Both web-based and paper-and-pencil versions of the survey were available. Various methods were used to distribute the survey, including tabling at community events, posting to social media and listservs, and initiating snowball sampling by asking friends, family, and community partners to distribute the survey via their own social media, listservs, and personal contacts. A Qualtrics survey panel and MSU Extension professionals also completed the survey. Ultimately, a total of 3,501 individuals across the state responded to the survey.
The statewide needs assessment survey included 70 items across five program areas:
- 4-H Youth Development (13 items)
- Community Resource and Economic Development (13 items)
- Agriculture (16 items)
- Natural Resources (14 items)
- Family, Health, and Wellness (14 items)
For the five program areas, participants were asked to rank the importance of addressing the items in their community using the following scale: very important, important, somewhat important, not important, I don't know (which is not included in this analysis).
For delivery methods, participants were asked how likely they were to use the delivery methods to learn about the program area items using the following scale: very likely, likely, somewhat likely, not likely, I don't know (which is not included in this analysis).
The results of the survey provide data-driven insight to help inform MSU Extension’s work moving forward. Engaging community members in this needs assessment process ensures that MSU Extension programs are aligned with local needs and priorities.
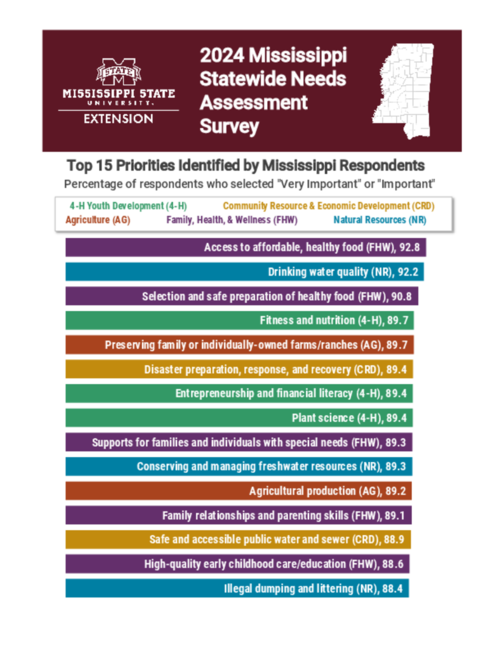
Note: The PDF on this page does not meet web accessibility standards. It is for printing only. The following tables present the same data found in the PDF.
| Priority | Program Area | Percentage of Respondents Who Selected “Very Important” or “Important” |
|---|---|---|
| Access to affordable, healthy food | Family, Health, and Wellness | 92.8 |
| Drinking water quality | Natural Resources | 92.2 |
| Selection and safe preparation of healthy food | Family, Health, and Wellness | 90.8 |
| Fitness and nutrition | 4-H Youth Development | 89.7 |
| Preserving family or individually owned farms/ranches | Agriculture | 89.7 |
| Disaster preparation, response, and recovery | Community Resource and Economic Development | 89.4 |
| Entrepreneurship and financial literacy | 4-H Youth Development | 89.4 |
| Plant science | 4-H Youth Development | 89.4 |
| Supports for families and individuals with special needs | Family, Health, and Wellness | 89.3 |
| Conserving and managing freshwater resources | Natural Resources | 89.3 |
| Agricultural production | Agriculture | 89.2 |
| Family relationships and parenting skills | Family, Health, and Wellness | 89.1 |
| Safe and accessible public water and sewer | Community Resource and Economic Development | 88.9 |
| High-quality early childhood care/education | Family, Health, and Wellness | 88.6 |
| Illegal dumping and littering | Natural Resources | 88.4 |
| Priority | Very Important | Important | Somewhat Important | Not Important |
|---|---|---|---|---|
| Entrepreneurship skills and financial literacy | 61.1 | 28.3 | 8.8 | 1.8 |
| Social and emotional well-being | 61.0 | 27.0 | 9.7 | 2.3. |
| Plant science | 61.0 | 28.4 | 9.1 | 1.5 |
| Fitness and nutrition | 55.8 | 33.9 | 8.9 | 1.4 |
| Leadership skills and personal development | 55.7 | 32.4 | 10.1 | 1.8 |
| Animal science | 55.0 | 30.9 | 11.8 | 2.3 |
| College and career readiness skills | 54.2 | 32.1 | 11.4 | 2.3 |
| Natural resources and environmental science | 53.6 | 29.7 | 14.3 | 2.4 |
| Health and safety | 51.6 | 35.7 | 10.8 | 1.9 |
| Engineering and technology literacy and skills | 51.2 | 33.3 | 13.2 | 2.3 |
| Community action | 46.7 | 37.5 | 13.4 | 2.4 |
| Outdoor recreation | 43.4 | 35.9 | 16.3 | 4.4 |
| Creative and expressive arts | 32.6 | 39.1 | 22.6 | 5.7 |
| Priority | Very Important | Important | Somewhat Important | Not Important |
|---|---|---|---|---|
| Safe and accessible public water and sewer | 64.2 | 24.7 | 9.3 | 1.8 |
| Disaster preparation, response, and recovery | 58.6 | 30.9 | 9.3 | 1.2 |
| Natural resource management | 54.6 | 33.3 | 10.2 | 1.9 |
| Workforce development | 53.1 | 35.3 | 9.9 | 1.7 |
| Support for access to affordable, reliable, high-speed internet | 47.7 | 34.8 | 13.4 | 4.1 |
| Business development, attraction, retention, expansion | 46.0 | 37.9 | 13.9 | 2.2 |
| Entrepreneurship and small/local business development | 44.0 | 40.1 | 14.0 | 1.9 |
| Downtown revitalization | 44.0 | 35.3 | 16.8 | 3.9 |
| Community planning and problem-solving | 42.7 | 40.1 | 14.4 | 2.8 |
| Local government employee training and certification | 41.4 | 38.5 | 16.5 | 3.6 |
| Digital skills and literacy | 40.6 | 39.1 | 16.9 | 3.4 |
| Civic engagement and community leadership | 40.1 | 39.9 | 16.9 | 3.1 |
| Tourism and recreation | 35.9 | 38.8 | 20.1 | 5.2 |
| Priority | Very Important | Important | Somewhat Important | Not Important |
|---|---|---|---|---|
| Preserving family or individually owned farms/ranches | 61.9 | 27.7 | 8.1 | 2.3 |
| Agricultural production | 57.9 | 31.2 | 8.7 | 2.2 |
| Support for new farmers and ranchers | 57.0 | 30.2 | 10.5 | 2.3 |
| Local food system development | 51.6 | 36.6 | 10.3 | 1.5 |
| Pollinators and pollinator services | 50.2 | 33.8 | 13.5 | 2.5 |
| Animal health and forage management | 48.6 | 37.2 | 12.1 | 2.1 |
| Home and community gardening | 48.3 | 35.1 | 14.0 | 2.6 |
| Agricultural worker training and education | 44.3 | 39.3 | 14.3 | 2.1 |
| Nutrient management | 44.0 | 39.5 | 14.2 | 2.3 |
| Profitability of agriculture and agribusinesses | 43.9 | 39.9 | 13.6 | 2.6 |
| Pesticide applicator safety, licensure, and certification | 43.8 | 37.9 | 15.3 | 3.3 |
| Agricultural technologies | 43.3 | 40.4 | 13.6 | 2.7 |
| Pest identification and management | 42.3 | 39.1 | 16.3 | 2.3 |
| Sustainable management of landscapes and sports turf | 42.1 | 38.6 | 16.5 | 2.8 |
| Sustainable agricultural systems | 39.3 | 38.3 | 18.6 | 3.8 |
| Agricultural tourism and ecotourism | 38.3 | 38.8 | 19.1 | 3.8 |
| Priority | Very Important | Important | Somewhat Important | Not Important |
|---|---|---|---|---|
| Drinking water quality | 71.6 | 20.7 | 6.2 | 1.5 |
| Conserving and managing freshwater resources | 57.7 | 31.5 | 9.2 | 1.8 |
| Illegal dumping and littering | 57.7 | 30.7 | 9.8 | 1.8 |
| Protecting/conserving the marine environment and fishery | 53.3 | 31.0 | 12.4 | 3.3 |
| Forest conservation and management | 51.9 | 34.7 | 11.0 | 2.4 |
| Urban and rural stormwater management | 51.7 | 34.8 | 11.0 | 2.5 |
| Water consumption | 50.3 | 33.2 | 12.4 | 4.1 |
| Conserving and managing natural ecosystems | 48.3 | 36.2 | 13.0 | 2.5 |
| Composting, reusing, and recycling consumer goods | 45.6 | 34.6 | 16.9 | 2.9 |
| Coastal habitat restoration and resiliency | 45.5 | 32.0 | 13.4 | 9.1 |
| Damage to crops, property, and landscapes from wildlife | 45.3 | 37.8 | 14.0 | 2.9 |
| Human-wildlife interaction and wildlife health | 42.5 | 38.5 | 15.6 | 3.4 |
| Renewable energy | 39.7 | 31.3 | 20.1 | 8.9 |
| Forest product market development | 39.4 | 39.0 | 17.6 | 4 |
| Priority | Very Important | Important | Somewhat Important | Not Important |
|---|---|---|---|---|
| Access to affordable, healthy food | 70.0 | 22.8 | 6.3 | 0.9 |
| Selection and safe preparation of healthy food | 62.5 | 28.4 | 7.7 | 1.4 |
| Mental health, stress management, suicide prevention | 59.9 | 28.1 | 10.1 | 1.9 |
| Family relationships and parenting skills | 58.0 | 31.2 | 9.4 | 1.4 |
| Substance abuse | 58.0 | 29.1 | 10.2 | 2.7 |
| High-quality early childhood care/education | 57.3 | 31.3 | 9.7 | 1.7 |
| Supports for families and individuals with special needs | 56.9 | 32.4 | 9.5 | 1.2 |
| Injury and violence prevention | 56.7 | 31.2 | 10.5 | 1.6 |
| Chronic/infectious disease prevention/management | 56.6 | 30.0 | 11.2 | 2.2 |
| Budgeting | 54.9 | 32.8 | 10.5 | 1.8 |
| Healthy homes | 52.9 | 33.7 | 11.8 | 1.6 |
| Healthy growth and development across the life span | 51.1 | 35.5 | 11.6 | 1.8 |
| Retirement and estate planning | 49.1 | 36.5 | 12.2 | 2.2 |
| Energy conservation and efficiency | 43.8 | 39.4 | 14.3 | 2.5 |
| Age Range | Percentage |
|---|---|
| 18–24 | 5.9 |
| 25–29 | 5.3 |
| 30–34 | 6.8 |
| 35–39 | 8.2 |
| 40–44 | 9.3 |
| 45–49 | 9.4 |
| 50–54 | 10.2 |
| 55–59 | 10.1 |
| 60–64 | 11.4 |
| 65–69 | 10.4 |
| 70–74 | 7.7 |
| 75+ | 5.3 |
| Sex | Percentage |
|---|---|
| Female | 60.8 |
| Male | 37.8 |
| Prefer not to say | 1.4 |
| Race | Percentage |
|---|---|
| White | 73.9 |
| Black or African American | 19.3 |
| Prefer not to say | 3.4 |
| Two or more races | 1.9 |
| American Indian or Alaska Native | 0.9 |
| Asian (includes India and Middle East) | 0.5 |
| Native Hawaiian or Other Pacific Islander | 0.1 |
| Hispanic? | Percentage |
|---|---|
| No | 91.9 |
| Yes | 5.2 |
| Prefer not to say | 2.9 |
| Degree Earned | Percentage |
|---|---|
| Less than high school degree | 1.9 |
| High school graduate | 16.2 |
| Some college, no degree | 19.1 |
| Associate degree | 14.1 |
| Bachelor’s degree | 25.3 |
| Graduate or professional degree | 22.3 |
| Prefer not to say | 1.2 |
| Income Range | Percentage |
|---|---|
| Less than $10,000 | 3.8 |
| $10,000 to $14,999 | 3.1 |
| $15,000 to $24,999 | 5.2 |
| $25,000 to $34,999 | 7.8 |
| $35,000 to $49,999 | 9.6 |
| $50,000 to $74,999 | 14.0 |
| $75,000 to $99,999 | 13.3 |
| $100,000 to $149,999 | 17.2 |
| $150,000 to $199,999 | 9.0 |
| $200,000 or more | 6.6 |
| Prefer not to say | 10.3 |
| Have Used Resources | Percentage |
|---|---|
| Yes | 62.9 |
| No | 31.7 |
| I Don’t Know | 5.4 |
| Category | Percentage |
|---|---|
| External Stakeholders | 58.0 |
| Paid Qualtrics Panel | 33.2 |
| Paid Extension Employees | 8.8 |
| Delivery Method | Percentage of “Very Likely” or “Likely” |
|---|---|
| Search internet or world wide web | 81.7 |
| Watch a how-to video on the internet or social media | 78.9 |
| Take an online course over the internet | 74.2 |
| Follow social media accounts that post on the topic | 71.0 |
| Take an online one-time class through social media | 65.7 |
| Delivery Method | Percentage of “Very Likely” or “Likely” |
|---|---|
| Search the internet or world wide web | 87.1 |
| Watch a how-to video on the internet or social media | 83.2 |
| Take an online course over the internet | 77.9 |
| Follow social media accounts that post on the topic | 70.5 |
| Watch a how-to TV show | 68.4 |
| Delivery Method | Percentage of “Very Likely” or “Likely” |
|---|---|
| Search the internet or world wide web | 90.5 |
| Watch a how-to video on the internet or social media | 83.8 |
| Attend a single meeting or workshop | 73.4 |
| Take an online course over the internet | 70.0 |
| Watch a how-to TV show | 70.0 |
| Delivery Method | Percentage of “Very Likely” or “Likely” |
|---|---|
| Search the internet or world wide web | 86.5 |
| Watch a how-to video on the internet or social media | 74.0 |
| Attend a single meeting or workshop | 69.0 |
| Watch a how-to TV show | 66.0 |
| Pick up a brochure or flyer at a store or other display | 64.9 |
| County | Number of Respondents |
|---|---|
| Adams | 22 |
| Alcorn | 30 |
| Amite | 15 |
| Attala | 35 |
| Benton | 9 |
| Bolivar | 52 |
| Calhoun | 39 |
| Carroll | 12 |
| Chickasaw | 15 |
| Choctaw | 39 |
| Claiborne | 4 |
| Clarke | 20 |
| Clay | 40 |
| Coahoma | 24 |
| Copiah | 19 |
| Covington | 15 |
| DeSoto | 98 |
| Forrest | 73 |
| Franklin | 21 |
| George | 27 |
| Greene | 8 |
| Grenada | 200 |
| Hancock | 86 |
| Harrison | 178 |
| Hinds | 148 |
| Holmes | 25 |
| Humphreys | 9 |
| Issaquena | 3 |
| Itawamba | 18 |
| Jackson | 103 |
| Jasper | 10 |
| Jefferson | 3 |
| Jefferson Davis | 19 |
| Jones | 34 |
| Kemper | 18 |
| Lafayette | 37 |
| Lamar | 39 |
| Lauderdale | 45 |
| Lawrence | 15 |
| Leake | 9 |
| Lee | 78 |
| Leflore | 24 |
| Lincoln | 14 |
| Lowndes | 60 |
| Madison | 50 |
| Marion | 17 |
| Marshall | 19 |
| Mississippi Band of Choctaw Indians | 8 |
| Monroe | 39 |
| Montgomery | 37 |
| Neshoba | 15 |
| Newton | 31 |
| Noxubee | 9 |
| Oktibbeha | 134 |
| Panola | 18 |
| Pearl River | 131 |
| Perry | 16 |
| Pike | 22 |
| Pontotoc | 42 |
| Prentiss | 25 |
| Quitman | 8 |
| Rankin | 67 |
| Scott | 26 |
| Sharkey | 9 |
| Simpson | 17 |
| Smith | 7 |
| Stone | 35 |
| Sunflower | 23 |
| Tallahatchie | 18 |
| Tate | 13 |
| Tippah | 17 |
| Tishomingo | 9 |
| Tunica | 11 |
| Union | 17 |
| Walthall | 14 |
| Warren | 41 |
| Washington | 45 |
| Wayne | 13 |
| Webster | 20 |
| Wilkinson | 6 |
| Winston | 26 |
| Yalobusha | 15 |
| Yazoo | 19 |
Publication 4130-70 (10-26)
By Donna J. Peterson, PhD, Extension Professor, Extension Administration; Tia M. Gregory, Program Manager, Human Sciences; and Molly E. Campbell, Extension Project Specialist I, Extension Administration.
The Mississippi State University Extension Service is working to ensure all web content is accessible to all users. If you need assistance accessing any of our content, please email the webteam or call 662-325-2262.
Download
P4130
2024 Mississippi Statewide Needs Assessment Survey
565.38 KB
Departments
Authors
-
 Interim Director, Ext Prof, &
- MSU - ES Administration
-
 Program Manager
- MSU Extension- Early Childhood Prog
-
 Extension Project Specialist I
- MSU - ES Administration