P2260
Are My Pine Trees Ready to Thin?
Regarding pine plantations in 2019, the most commonly encountered question from landowners is, “How do I sell my pine pulpwood?” Currently, low demand and a large surplus of pine pulpwood in Mississippi has driven prices downward and made it difficult to find buyers for pulpwood, especially on smaller acreages. For pricing information in your local area, please consult the current Mississippi Timber Price Report at http://extension.msstate.edu.
Keep in mind that pricing is dependent upon multiple variables, including site conditions, terrain, weather, haul distance, and road bonds, and these prices are intended for reference purposes only. Landowners wishing to market timber should have their timber evaluated by a professional forester before making a decision to make a sale. Contact information for registered foresters can be found at the Mississippi Board of Registration for Foresters website (https://www.borf.ms.gov/).
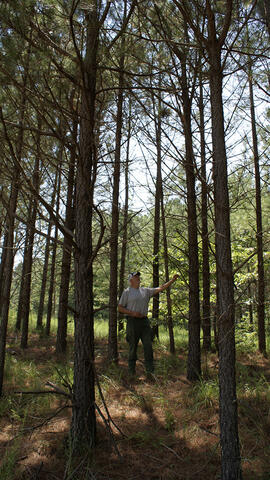
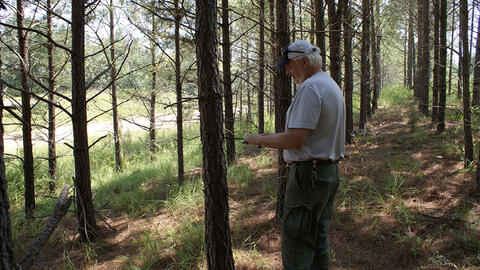
The next question private forest landowners typically ask is, “Are my pine trees ready to thin?” There is no definite answer to this question, because each pine plantation is different. Some plantations may be ready to thin as early as age 12, and some may not be ready for thinning until age 18 or older.
Many factors determine when a pine plantation is ready to be thinned: site productivity, planting density, genetics, and weed competition. Just remember, the timing of the first thinning is very important. This first thinning may affect the productivity and economics of the pine plantation for the next 20 to 30 years, so it is imperative that thinning be done at the right time.
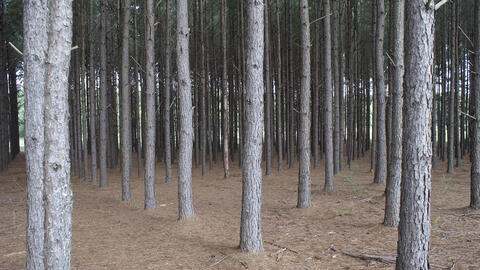
Understanding the biology of pine trees can help clarify why and when pine trees should be thinned. Pine trees do not tolerate shade. They need direct sunlight for survival and growth. As pine trees grow, they compete with each other for water, nutrients, and sunlight. Green needles in the crowns make food for tree growth. The fastest growing trees are the ones with the biggest crowns. These trees take a “dominant” position in the stand, where they receive direct sunlight from above and the side.
Since pines do not tolerate shade, their branches die from the ground up as trees get taller and lower branches become more shaded. Known as “natural pruning,” this process results in fewer and smaller branches on the lower stem and a higher quality tree. As a tree farmer, you want to grow tall trees with clean stems and well-developed crowns. An expanded, well-developed crown can make more food and lets the tree grow more quickly.
Trees are like other crops in that they don’t grow well if there are too many per acre. The number of trees per acre affects diameter growth of individual trees and, thus, the yield and growth of the entire stand. As the trees grow larger, the site can support fewer trees per acre. To maintain vigor and growth rates of the best trees, known as “crop trees,” pine plantations are thinned to a density the site can best support. When pines are thinned at the proper time and in the proper manner, landowners benefit in several ways:
- Higher quality trees can grow. Lower quality trees are removed to give crop trees more growing space. Growth is increased on fewer, higher quality trees. It takes less time for trees to reach the more valuable sawtimber size class.
- Landowners receive intermediate income. Trees that become crowded and overtopped die before final harvest. Thinning lets landowners sell and use these trees that would otherwise be lost in the “natural thinning” process.
- Health and vigor of the stand are maintained. By reducing competition and removing weak trees, remaining trees are more vigorous and less susceptible to pine beetles and other insects and diseases.
- Wildlife habitat is enhanced. Thinning lets sunlight reach the forest floor, resulting in greater production of browse for deer and other wildlife, as well as an increased diversity of habitat.
As you can see, it is to your advantage to thin your pine plantation at the appropriate time. When is the proper time to conduct your first thinning? Consider these points before you thin your pine plantation:
- Tree diameters
- Stand density
- Tree heights
- Natural pruning
- Growth rates
All five are important, but tree diameters and stand density are the most important because they influence growth rates.
Tree Diameter
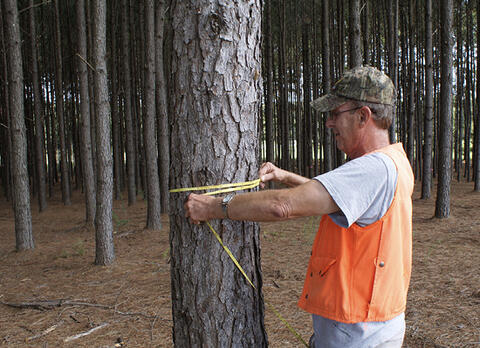
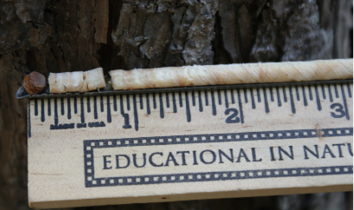
Diameter at breast height (DBH) is tree diameter of the stem 41/2 feet above ground level. You can take this measurement with a tree scale stick (Figure 1) or with a diameter-measuring tape (Figure 2).

DBH is important because trees must average at least 6 inches DBH to be sold for pulpwood. Trees smaller than 5 inches DBH are not “merchantable” and typically will not be cut. Thinning your stand before average tree size is 6 inches DBH may result in “high grading,” where only larger, faster growing, “dominant” trees are harvested. These are trees you want to leave as crop trees, not ones to harvest. When your trees average 6 inches DBH or larger, you can harvest slower growing, smaller, less vigorous trees and give crop trees more room to grow.
Stand Density
Stand density is determined by both size (DBH) and total number of trees per acre (TPA). As average size increases, the number of trees the site can support decreases. For example, at the time of tree planting, a site may easily support 600 or more tree seedlings per acre. However, as tree diameters and crowns increase in size, the amount of nutrients, soil moisture, and sunlight required for best growth also increases. Eventually, stand density (TPA and DBH) becomes too high for good growth rates. The goal of thinning is to reduce stand density by removing slow-growing, lower quality trees, thus maintaining rapid growth on straight, healthy, vigorous, and evenly spaced crop trees.
There is a simple way to determine when stand density (TPA and DBH) dictates a thinning. Cut a piece of string, stick, or bamboo to 11 feet 9 5/16 inches long. This is the radius of a 1/100-acre circle. Using either a tree scale stick or diameter-measuring tape, complete the following steps:
Step 1
Walk through your plantation and take 10 random 1/100 acre plots evenly distributed across the plantation. Record the number of trees and DBH of each tree on each plot. See the example in Table 1.
|
Plot # |
Tree DBH |
Total DBH |
# of trees |
||||||
|---|---|---|---|---|---|---|---|---|---|
|
1 |
6 |
7 |
5 |
7 |
25 |
4 |
|||
|
2 |
7 |
8 |
6 |
6 |
7 |
7 |
41 |
6 |
|
|
3 |
7 |
6 |
6 |
5 |
5 |
7 |
36 |
6 |
|
|
4 |
6 |
6 |
6 |
7 |
6 |
6 |
7 |
44 |
7 |
|
5 |
7 |
7 |
7 |
6 |
6 |
6 |
5 |
44 |
7 |
|
6 |
5 |
5 |
5 |
6 |
5 |
6 |
32 |
6 |
|
|
7 |
7 |
7 |
7 |
7 |
28 |
4 |
|||
|
8 |
7 |
7 |
6 |
6 |
5 |
31 |
5 |
||
|
9 |
7 |
6 |
6 |
5 |
5 |
29 |
5 |
||
|
10 |
7 |
7 |
7 |
21 |
3 |
||||
|
Totals |
331 |
53 |
|||||||
Average trees per acre = 53 (total # trees) x 100/10 = 530
Average DBH = 331 (total sum of DBHs) / 53 (total # trees) = 6.2 inches
Step 2
Sum the diameters of all trees across each row, and record the total number of trees on each plot.
Step 3
Sum the “total DBH” and “# of trees” columns for all the plots.
Step 4
Calculate trees per acre (TPA) as the total trees counted on all plots divided by the number of plots (10) times 100.
Step 5
Calculate average DBH (the sum of all DBHs divided by the number of trees).
Step 6
Find the average TPA and average DBH of your plantation on the Thinning Graph below.
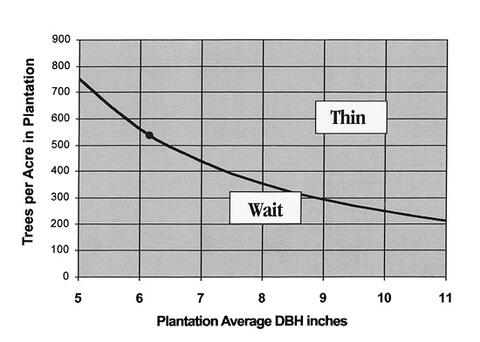
Thin/wait decision based on stand density (530 TPA and DBH 6.2 in).
Using the example of 530 TPA and 6.2 inches DBH, the graph says this is a borderline stand.
Although TPA and DBH are the two main factors that determine the need to thin, consider several other factors. When stand density indicates trees need thinning or your stand is borderline, you need to evaluate tree heights, natural pruning, and growth rate to determine exactly when to thin.
Tree Heights
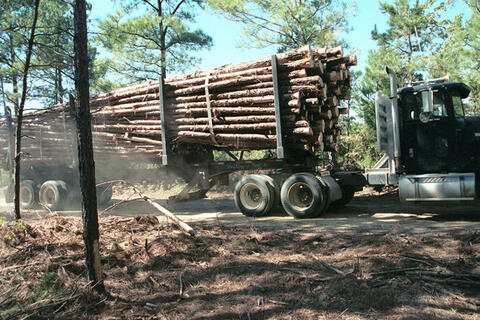
Trees should be at least 40 feet tall for thinning to be economical. Logging operations use tree-length log trucks to haul trees from the woods to the mill. If pine trees are not tall enough, timber harvesters have several problems. Short trees must be loaded in a manner known as “double-stacking,” where the tops of logs are loaded on butts of other logs (see Figure 3). Loaded in this manner, a truck can haul the maximum amount of pulpwood allowed by state law (25–27 tons depending on truck configuration). However, if the trees are less than 40 feet tall, a fully loaded truck cannot haul enough stems to be economically efficient. Consequently, hauling cost is higher, and stumpage price may be much lower. If you wait until your trees are at least 40 feet tall, you typically will not encounter this problem.
Natural Pruning
Since pines do not tolerate shade, their branches die from the ground up as trees become crowded and overtopped. These dead limbs, over time, shed or fall off. This is known as natural pruning and results in a tree of higher value with a clean stem, a well-developed crown, and wood production concentrated in the stem.
Natural pruning of lower branches to a minimum height of 18 feet should occur before you thin a pine plantation. If there are live, green limbs less than 18 feet from the ground (see Figure 4), thinning the stand could lower tree quality. After thinning, these green limbs will be exposed to sunlight and will continue to grow. Thinning too early can result in growing larger lower limbs, which will lower log quality eventually, hurt diameter growth, and reduce the value of the tree.
Growth Rates
The main objective of thinning a pine stand is to maintain high vigor and growth rates on the best trees. From an economic standpoint, when growth rates decline, it’s time to thin. The ideal situation is for crop trees to continue growing at a steady and vigorous rate.
Use an increment borer to take an increment core from trees to determine growth rates of dominant and co-dominant trees (see Figures 5 and 6). Calculate the percent annual stem growth by using increment boring and DBH measurements. Annual stem growth rate is the final criterion you should use to determine if your plantation is ready to thin.
For example, your plantation may have the DBH, heights, natural pruning, and density levels to justify a thinning. However, if tree stems are still growing at an annual rate of 10 percent, it may be wise to postpone thinning. Trees growing at this rate are vigorous, are growing wood at a satisfactory rate, and can be left for additional growing time.
| Diameter breast high (inches) | # of trees per 25-ton truckload |
|---|---|
| 5 | 298 |
| 6 | 221 |
| 7 | 183 |
| 8 | 135 |
| 9 | 115 |
| 10 | 96 |
| 11 | 77 |
| 12 | 67 |
Note: This is an approximate table for rough determination.
Difficulty attracting buyers and low harvesting efficiency may be other reasons to postpone thinning. Harvesting efficiency increases dramatically with diameter growth. For example, it takes about 298 trees 5 inches in DBH to make a truckload of pulpwood. In contrast, it takes only 221 trees 6 inches in DBH and 183 trees 7 inches in DBH to make a truckload (see Table 2). If your pine plantation is growing at an annual growth rate of 10 percent, many smaller 5- to 6-inch DBH trees may grow into 6- and 7-inch DBH trees in only a few years. The result will be higher harvest volumes per acre, higher stumpage prices, and, ultimately, a higher per-acre income from your first thinning. Just remember, income from your first thin is a relatively small portion of the overall income stream from a stand of trees. If pulp markets are depressed and opportunity for completion of a first thin arises, serious consideration should be given even to early thinning operations. In some situations, you may want to postpone thinning and, in others, you may not. Growth rate is the final determining factor but can vary by your own objectives and soil-site quality.
Decide what growth rate is acceptable to you. You may decide that, as long as trees are growing at the prime interest rate, you want to let them grow. Or, you may have already set a rate of return you want the trees to produce. An acceptable factor could range between 4 percent and 10 percent, depending on your objectives.
Are My Pine Trees Ready to Thin?
As a landowner, you can evaluate your pine plantation by using the five criteria described above and by using the Thinning Graph on page 3. You can record tree heights, natural pruning heights, and growth rates on the Field Evaluation Sheet (page 11) by measuring one sample crop tree on each 1/100 acre plot taken to determine stand density (see page 3).
|
Criteria |
Limit/minimum |
|---|---|
|
Tree DBH and stand density |
Above line on Thinning Graph |
|
Tree heights |
Above 40 feet |
|
Natural pruning |
Above 18 feet |
|
Growth rates |
Less than 10 percent |
Sample Crop Trees
Within each 1/100 acre plot, measure one crop tree for total height, natural pruning height, and radial growth. Record these measurements on the bottom half of the Field Evaluation Sheet.
Step 1
Select a crop tree nearest plot center for measurement. Crop trees are the best trees in the plantation and should be your future sawtimber. They should be above average in size (DBH) and have very few defects. Common defects include forked stems, stems deformed by fusiform rust galls, leaning trees, and trees with broken tops.
Step 2
Find the lowest branch with living pine needles attached. This is considered the first live limb, and its height above ground is called natural pruning height. You can use a height pole or a clinometer to measure natural pruning height. If you use a clinometer, follow the directions in step 3 (below) to take height to the first live limb while you are measuring total height. Remember where the first live limb is before leaving the tree to measure heights.
Step 3
Measure total tree height with a clinometer or similar height measurement tool. The following example uses a clinometer with a 66-foot scale (1 chain). Using a tape, measure 33 feet from the crop tree. Make sure you can see the tree from this point. Take a reading at the very top of the tree. This reading shows how much taller the tree is than your eye. Then, take a reading at the base of the tree to see how much lower it is than your eye. Add the two measurements to get the total. To correct for standing only half a chain (33 feet) from the crop tree, multiply the total measurement by half, or simply divide the total by 2. The result is the total tree height.
Step 4
Measure the crop tree DBH. Next, using an increment borer (see Figures 5 and 6), bore about 2 inches into the stem of the crop tree at 4 1/2 feet above ground level. Pull out the increment core for measurement. Mark the last 3 years’ growth (last three light-dark ring pairs), counting in from the bark. Measure the total width of these three ring pairs. This is called 3-year radial growth. Find the 3-year radial growth measurement and DBH on the Projected Pine Stem Growth table (see page 8). The corresponding number is the predicted future annual growth rate of the stem.
Step 5
After recording all measurements, sum total height, height to first live limb, and percent growth columns. Divide these sums by the number of crop trees measured to get averages. Compare your averages to the criteria in the appropriate tables to determine if your pine plantation is ready to thin. On the Field Evaluation Sheet Example First Thinning (page 8), average tree height is 38.7 feet, average natural pruning height is 17.5 feet, and predicted future growth rate of the stem is 17.2 percent. So, based on this example, this pine plantation would not be ready to thin.
Remember, the first thinning of your pine plantation may be the most important thing you do and will impact physical and economic growth of your pine plantation for many years. Using the services of a professional forester in evaluating your pine plantation is highly recommended.
What About My Second Thinning?
When Will It Be Ready to Thin Again?
You may be a landowner with a pine plantation that has already been thinned, and now you’re asking, “When will it be ready to thin again?” Historically, pine stands were thinned as many as three, or sometimes four, times before final harvest. Currently, thinning pulpwood market conditions often limit landowners to only a first thin before final harvesting. However, from a silvicultural perspective, subsequent thins are still beneficial albeit not economically feasible in every situation.
You can determine if your stand is ready for a second or even third thin by using the Field Evaluation Sheet (page 11). Again, take 10 random 1/100 acre plots evenly distributed across your plantation, and record all measurements as before except tree heights and natural pruning heights. These criteria were already met before your first thinning.
Using the Thinning Graph and your average DBH and TPA, determine if you need to thin or wait. Again, take crop tree radial growth measurements and, using the Projected Pine Stem Growth table, determine predicted future annual stem growth rate of your trees.
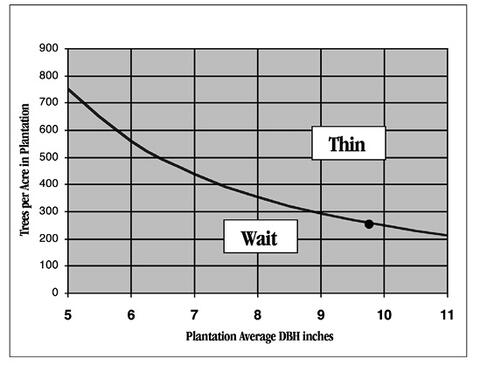
In the Field Evaluation Sheet Example Second Thinning (page 9), the pine plantation has a 9.8-inch average DBH and 270 trees per acre. The Thinning Graph shows that it is borderline. Growth measurements indicate an 11.2 percent predicted future annual stem growth rate. This stand would not be ready to thin.
Remember, second and later thinnings reduce the total number of crop trees to a smaller and smaller number. It is imperative that the very best crop trees are left in second and third thins. You may have to mark trees to be harvested and/or left with tree-marking paint. If you would like to gain hands-on experience with this process, please read MSU Extension Publication 2832 Thinning Pine Trees by the Leave-Tree Method. Again, using the services of a professional forester in evaluating and preparing your pine plantation for a second or third thinning is highly recommended.
Field Evaluation Sheet Example
First Thinning
Field evaluation: Scatter 1/100 acre plots throughout plantation. Measure all trees within an 11 feet, 9.3-inch radius (11.775 ft). Record DBH measurements for each tree on the row for the plot. Measure crop tree nearest plot center.
|
Plot # |
DBH measured to nearest inch |
Total DBH |
Total # trees |
||||||
|---|---|---|---|---|---|---|---|---|---|
|
1 |
6 |
7 |
5 |
7 |
25 |
4 |
|||
|
2 |
7 |
8 |
6 |
6 |
7 |
7 |
41 |
6 |
|
|
3 |
7 |
6 |
6 |
5 |
5 |
7 |
36 |
6 |
|
|
4 |
6 |
6 |
6 |
7 |
6 |
6 |
7 |
44 |
7 |
|
5 |
7 |
7 |
7 |
6 |
6 |
6 |
5 |
44 |
7 |
|
6 |
5 |
5 |
5 |
6 |
5 |
6 |
32 |
6 |
|
|
7 |
7 |
7 |
7 |
7 |
28 |
4 |
|||
|
8 |
7 |
7 |
6 |
6 |
5 |
31 |
5 |
||
|
9 |
7 |
6 |
6 |
5 |
5 |
29 |
5 |
||
|
10 |
7 |
7 |
7 |
21 |
3 |
||||
|
Grand total all plots |
331 |
53 |
|||||||
Average DBH = (grand total DBH)/ (grand total # trees)
331 / 53 = 6.2 inches
Is it at least 6 inches? Yes
Average # trees/acre = (grand total # trees) x (100 / # of plots)
53 x (100 / 10) = 530 trees
Find DBH and trees/acre on the Thinning Graph below.
Is the plantation too thick? Borderline
|
Plot # |
Total tree height (ft) |
Height to the first live limb (ft) |
DBH (in) |
3-year radial growth (per 0.1 in) |
Percent growth |
|---|---|---|---|---|---|
|
1 |
42 |
16 |
8 |
.7 |
13 |
|
2 |
38 |
14 |
6 |
.7 |
17 |
|
3 |
36 |
18 |
6 |
.7 |
17 |
|
4 |
42 |
17 |
4 |
.6 |
23 |
|
5 |
34 |
16 |
8 |
.9 |
17 |
|
6 |
33 |
19 |
7 |
.8 |
17 |
|
7 |
37 |
20 |
7 |
.9 |
19 |
|
8 |
42 |
15 |
6 |
.6 |
15 |
|
9 |
45 |
19 |
8 |
.9 |
17 |
|
10 |
39 |
21 |
7 |
.8 |
17 |
|
Grand total |
387 |
175 |
X |
X |
172 |
Average tree height = (total tree heights) / (# of plots)
387 / 10 = 38.7 feet
Is it at least 40 feet? No
Average height to 1st live limb = (total heights to1st limb) / (# plots)
175/10 = 17.5 feet
Is it at least 18 feet? No
Average growth rate = (total growth rates) / (# of plots)
172 / 10 = 17.2%
Is it less than 10%? No
Thinning Graph
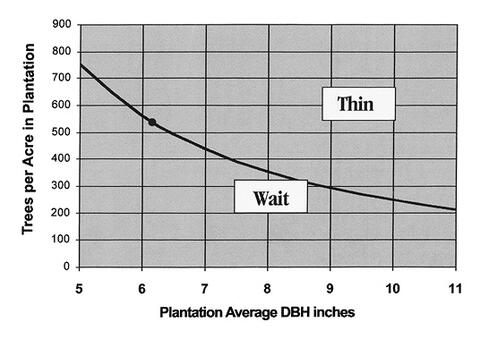
Thinning decision based on plantation density using DBH (diameter at breast height) and trees per acre.
Projected Pine Stem Growth
|
3-Year Radial Growth (inches) |
|||||||||
|---|---|---|---|---|---|---|---|---|---|
|
DBH |
0.2 |
0.3 |
0.4 |
0.5 |
0.6 |
0.7 |
0.8 |
0.9 |
1 |
|
Inches |
Stem growth rate (%/year) |
||||||||
|
4 |
7 |
11 |
15 |
19 |
23 |
27 |
32 |
37 |
42 |
|
5 |
6 |
9 |
12 |
15 |
18 |
21 |
25 |
28 |
32 |
|
6 |
5 |
7 |
10 |
12 |
15 |
17 |
20 |
23 |
26 |
|
7 |
4 |
6 |
8 |
10 |
12 |
15 |
17 |
19 |
22 |
|
8 |
3 |
5 |
7 |
9 |
11 |
13 |
15 |
17 |
19 |
|
9 |
3 |
5 |
6 |
8 |
10 |
11 |
13 |
15 |
17 |
|
10 |
3 |
4 |
6 |
7 |
9 |
10 |
12 |
13 |
15 |
|
11 |
3 |
4 |
5 |
6 |
8 |
9 |
10 |
12 |
13 |
|
12 |
2 |
3 |
5 |
6 |
7 |
8 |
10 |
11 |
12 |
Estimated future growth rate of stem using DBH and 3-year radial growth (width of the last 3 years of growth rings). Shaded area is stem growth below 10 percent.
Field Evaluation Sheet Example
Second Thinning
Field evaluation: Scatter 1/100 acre plots throughout plantation. Measure all trees within an 11 feet, 9.3-inch radius (11.775 ft). Record DBH measurements for each tree on the row for the plot. Measure crop tree nearest plot center.
|
Plot # |
DBH measured to nearest inch |
Total DBH |
Total # trees |
|||
|---|---|---|---|---|---|---|
|
1 |
9 |
8 |
10 |
27 |
3 |
|
|
2 |
8 |
8 |
16 |
2 |
||
|
3 |
11 |
7 |
13 |
31 |
3 |
|
|
4 |
9 |
8 |
11 |
11 |
39 |
4 |
|
5 |
9 |
12 |
21 |
2 |
||
|
6 |
13 |
10 |
11 |
33 |
3 |
|
|
7 |
8 |
10 |
11 |
29 |
3 |
|
|
8 |
9 |
10 |
10 |
29 |
3 |
|
|
9 |
10 |
10 |
20 |
2 |
||
|
10 |
8 |
12 |
20 |
2 |
||
|
Grand total all plots |
265 |
27 |
||||
Average DBH = (grand total DBH) / (grand total # trees)
265 / 27 = 9.8 inches
Is DBH at least 6 inches? Yes
Average trees per acre = (grand total # trees) x (100 / # of plots)
27 x (100 / 10) = 270
Find DBH and trees per acre on the Thinning Graph below.
Is the plantation too thick? Borderline
|
Plot # |
Total tree height (ft) |
Height to the first live limb (ft) |
DBH (in) |
3-year radial growth (per 0.1 in) |
Percent growth |
|---|---|---|---|---|---|
|
1 |
10 |
.8 |
12 |
||
|
2 |
8 |
.8 |
15 |
||
|
3 |
11 |
.6 |
8 |
||
|
4 |
9 |
.7 |
11 |
||
|
5 |
12 |
.7 |
8 |
||
|
6 |
10 |
.7 |
10 |
||
|
7 |
10 |
1.0 |
15 |
||
|
8 |
10 |
.8 |
15 |
||
|
9 |
10 |
.7 |
10 |
||
|
10 |
12 |
.9 |
11 |
||
|
Grand total |
X |
X |
X |
X |
112 |
Average growth rate = (total growth rates) / (# of plots)
112 / 10 = 11.2%
Is it less than 10%? No
Thinning Graph
Thinning decision based on plantation density using DBH (diameter at breast height) and trees per acre.
Projected Pine Stem Growth
|
3-Year Radial Growth (inches) |
|||||||||
|---|---|---|---|---|---|---|---|---|---|
|
DBH |
0.2 |
0.3 |
0.4 |
0.5 |
0.6 |
0.7 |
0.8 |
0.9 |
1 |
|
Inches |
Stem growth rate (%/year) |
||||||||
|
4 |
7 |
11 |
15 |
19 |
23 |
27 |
32 |
37 |
42 |
|
5 |
6 |
9 |
12 |
15 |
18 |
21 |
25 |
28 |
32 |
|
6 |
5 |
7 |
10 |
12 |
15 |
17 |
20 |
23 |
26 |
|
7 |
4 |
6 |
8 |
10 |
12 |
15 |
17 |
19 |
22 |
|
8 |
3 |
5 |
7 |
9 |
11 |
13 |
15 |
17 |
19 |
|
9 |
3 |
5 |
6 |
8 |
10 |
11 |
13 |
15 |
17 |
|
10 |
3 |
4 |
6 |
7 |
9 |
10 |
12 |
13 |
15 |
|
11 |
3 |
4 |
5 |
6 |
8 |
9 |
10 |
12 |
13 |
|
12 |
2 |
3 |
5 |
6 |
7 |
8 |
10 |
11 |
12 |
Estimated future growth rate of stem using DBH and 3-year radial growth (width of the last 3 years of growth rings). Shaded area is stem growth below 10 percent.
Reference
Self, A.B. and R.C. Parker. 2017. Thinning pine trees by the leave-tree method. Mississippi State University Extension, Publication 2832.
The information given here is for educational purposes only. References to commercial products, trade names, or suppliers are made with the understanding that no endorsement is implied and that no discrimination against other products or suppliers is intended.
Publication 2260 (POD-10-22)
Revised by Brady Self, PhD, Associate Extension Professor, Forestry, from an earlier edition by Timothy A. Traugott and Stephen Dicke, PhD, Extension Professors Emeriti, Forestry.
Download

P2260
Are My Pine Trees Ready to Thin?
9.89 MB