Mississippi MarketMaker
Vol. 13, No. 5 / The U.S. Tilapia Aquaculture Industry Has Been Slowing Down
Abstract
- This newsletter shows the overall trends in U.S. tilapia aquaculture production, landings, and imports.
- Annual aquaculture, commercial landings, and import data are compiled from the NOAA Fisheries and Urner Barry Comtell websites.
- Econometric models are estimated to measure the impacts of disasters and economic events on aquaculture production, commercial landings, and imports.
Acknowledgement
- This newsletter is a contribution of the Mississippi Agricultural and Forestry Experiment Station and the Mississippi State University Extension Service.
- This material is based upon work that is supported in part by the National Institute of Food and Agriculture, U.S. Department of Agriculture, Hatch project under accession number 081730 and
- NOAA (Office of Sea Grant, U.S. Dept. of Commerce, under Grant NA22OAR4170090, Mississippi Alabama Sea Grant Consortium).
Keywords
- Tilapia aquaculture production
- Tilapia commercial landings
- Tilapia imports
Let Us Start Our Modeling Effort!
- The NOAA Fisheries data on U.S. tilapia aquaculture production (lb/yr) and farmgate values ($/yr) are available from 1991 to 2019.
- Farmgate prices ($/lb) are imputed from farmgate values and annual production.
- The NOAA Fisheries data on U.S. tilapia commercial landings (lb/yr) and dockside values ($/yr) are available from 1973 to 2021.
- Dockside prices ($/lb) are imputed from dockside values and commercial landings.
- The Urner Barry Comtell data on the U.S. volume of tilapia imports (lb/yr) and import values ($/yr) are available from 1992 to 2022.
- Import prices ($/lb) are imputed from import values and volume of imports.
- Econometric models are estimated to determine significant production, landings, and import determinants.
U.S. Aquaculture Economic Models
- The Ordinary Least Squares (OLS) models of U.S. aquaculture consisted of the following dependent variables:
- Aquaculture production (lb/yr)
- Commercial landings (lb/yr)
- The volume of imports (lb/yr)
- The OLS models of U.S. aquaculture were estimated using the robust variance procedure of STATA-16.
- The variation inflation factor was calculated to detect the possible presence of multicollinearity.
- The marginal impacts of disaster events were computed using the margins procedure.
U.S. Aquaculture Production Economic Model
- The OLS model of U.S aquaculture production (lb/yr) assumed that annual production could be explained by the following:
- year
- deflated farmgate, dockside, and import prices ($/lb)
- recession, trade war, pandemic, and Gulf natural disasters (1 or 0)
- unemployment rate (%)
- other variables
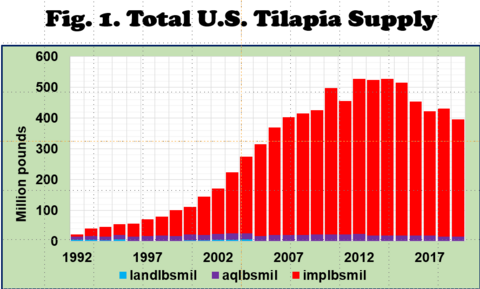
Total U.S. Tilapia Supply
- The total U.S. tilapia supply is shown in Fig. 1. It includes:
- commercial tilapia landings,
- tilapia aquaculture production, and
- tilapia imports.
- Annual tilapia supply was highest in 2012-14 at over 500 million pounds.
- The apparent per capita tilapia consumption peaked at 1.66-1.68 pounds per person. After that, it had been a downhill up to the present.
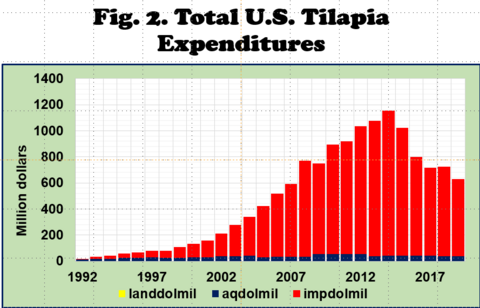
Total U.S. Tilapia Expenditures
- The total U.S. tilapia expenditure is shown in Fig. 2. It includes the following:
- farmgate values of tilapia aquaculture production
- dockside values of commercial tilapia landings and
- values of all tilapia imports
- Annual tilapia expenditures peaked in the mid-2010s, valued at $1.1 billion.
- The apparent per capita tilapia expenditure peaked in 2012-14 at $3.30-3.64 per person.
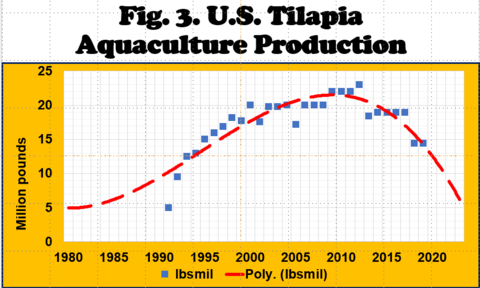
U.S. Tilapia Aquaculture Production
- Tilapia aquaculture production (lb/yr)
- Data from 1991 to 2019 were compiled from the NOAA Fisheries website.
- Tilapia’s annual aquaculture production peaked in the early 2010s.
- Since then, it has declined to about 15 million pounds per year.
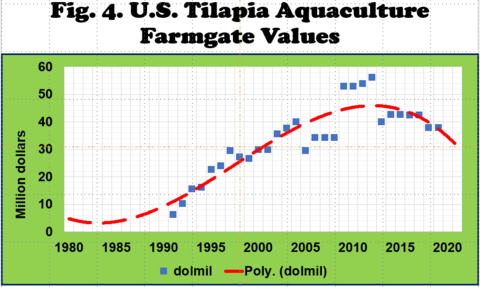
U.S. Tilapia Aquaculture Farmgate Values
- Tilapia farm-gate values ($/yr)
- Data from 1991 to 2019 were compiled from the NOAA Fisheries website.
- Annual tilapia aquaculture farmgate values peaked in the early 2010s.
- Since then, it decreased to less than $40 million per year.
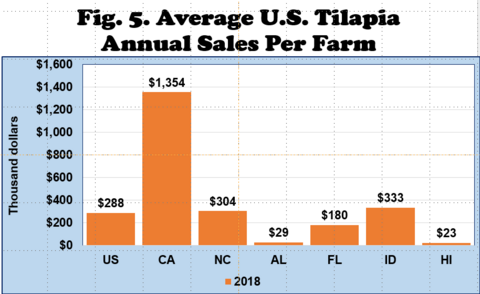
U.S. Tilapia Aquaculture Producers
- In 2013, there were 181 tilapia farms in the U.S., as compiled from the U.S. Agriculture Census website. The average annual tilapia sales per farm was $235,000 per farm.
- The number of tilapia farms fell to 137 in 2018, with a higher average annual sale of $288,000 per tilapia farm.
- In 2018, tilapia farms with reported total annual sales were in the following states:
- California ($12.2 million),
- Florida ($3.1 million),
- North Carolina ($2.4 million),
- Idaho ($2.0 million),
- Hawaii ($280,000), and
- Alabama ($172,000).
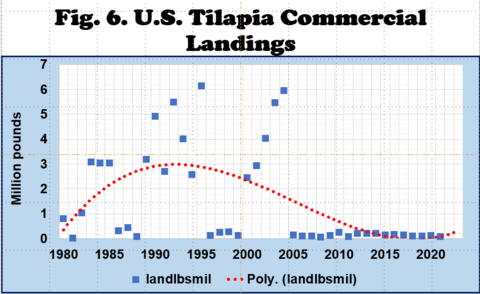
U.S. Tilapia Commercial Landings
- Annual tilapia commercial landings (lb/yr)
- Data from 1980 to 2021 were compiled from the NOAA Fisheries website.
- Tilapia annual commercial landings peaked in the early 1990s and 2000s (Fig. 6).
- Since then, it has declined to less than 100,000 pounds per year.
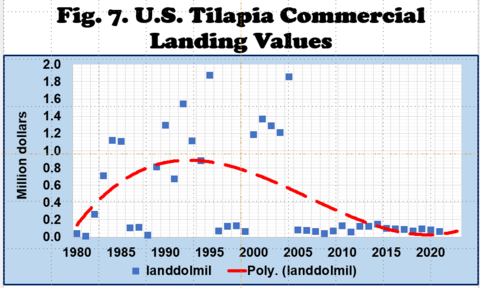
U.S. Tilapia Commercial Landing Values
- Tilapia dockside values ($/yr)
- Data from 1980 to 2021 were compiled from the NOAA Fisheries website.
- The tilapia’s annual commercial landing values peaked in the early 1990s and 2000s (Fig. 7).
- Since then, it continued to decline to about $70,000 per year.
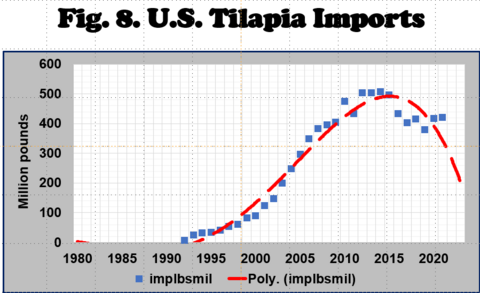
Volume of U.S. Tilapia Imports
- The volume of tilapia imports (lb/yr)
- Data from 1992 to 2022 were compiled from the Urner Barry Comtell website.
- Tilapia annual imports peaked in the mid-2010s (Fig. 8).
- Since then, it has declined to less than 400 million pounds annually.
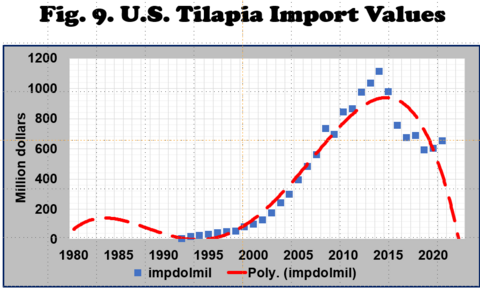
Value of U.S. Tilapia Imports
- Value of tilapia imports ($/yr)
- Data from 1992 to 2022 were compiled from the Urner Barry Comtell website.
- The tilapia annual import values peaked in the mid-2000s at over $1.1 billion (Fig. 9).
- Since then, it has declined to less than $600 million annually.
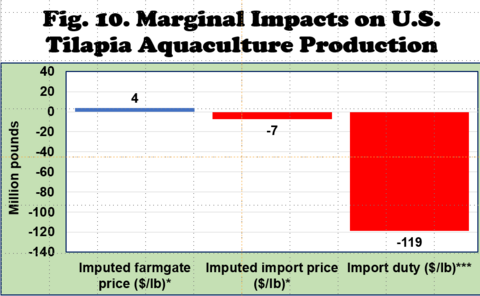
Marginal Impacts on U.S. Tilapia Aquaculture Production
- A dollar increase in imputed deflated tilapia farmgate price led to a 4-millionpound rise in tilapia aquaculture production.
- A dollar increase in imputed deflated tilapia import price led to a 7-million-pound fall in tilapia aquaculture production.
- A dollar increase in deflated tilapia import duty led to a 119-million-pound fall in tilapia aquaculture production.
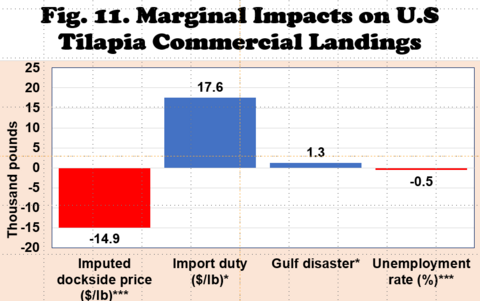
Marginal Impacts on U.S. Tilapia Commercial Landings
Significant variables affecting tilapia commercial landings (Fig 11):
- A dollar increase in imputed deflated tilapia dockside price led to a 14.9-millionpound fall in tilapia commercial landings.
- A dollar increase in deflated tilapia import duty led to a 17.6-million-pound rise in tilapia commercial landings.
- A Gulf disaster event could increase tilapia commercial landings by 1.3 million pounds (???).
- A 1% unemployment rise led to an almost 0.5-million-pound fall in commercial tilapia landings.
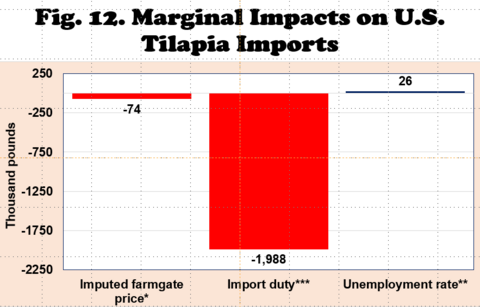
Marginal Impacts on U.S. Tilapia Imports
Significant variables affecting tilapia imports (Fig 12):
- A dollar increase in imputed deflated tilapia farmgate price led to a 74-millionpound fall in tilapia imports.
- A dollar increase in deflated tilapia import duty per pound led to an almost 2-million-pound reduction in tilapia imports.
- A 1% unemployment rise led to a 26-million-pound commercial tilapia import increase.
Summary and Implications
These variables have been shown to exert significant impacts on tilapia aquaculture production, tilapia commercial landings, and tilapia imports:
- Changes in tilapia farmgate prices,
- Changes in tilapia dockside prices,
- Changes in tilapia import prices,
- Changes in tilapia import duties,
- Occurrence of Gulf disaster event,
- Changes in the unemployment rate.
However, the magnitude and direction of impacts are still subject to further model development and testing.
My Economic Outreach on Tilapia
- Posadas, B.C. The U.S. Tilapia Aquaculture Industry. Horticulture and Marine Economics Outreach. MSU-CREC, Biloxi, MS. Virtual presentation. May 10, 2023. https://youtu.be/m59bI42mTYc.
- Posadas, B.C. U.S. Tilapia Consumption, Production, Imports, and Prices. Mississippi MarketMaker Newsletter, Vol. 10, No. 9. September 30, 2020. https://tinyurl.com/4utrhd9c.
- Posadas, B.C. Tilapia Farming and Related Businesses! Mississippi MarketMaker Newsletter, Vol. 5, No. 4. April 7, 2015. https://tinyurl.com/2af5rdd4.
Suggested Citation
Posadas, B.C. 2023. The U.S. Tilapia Aquaculture Industry Has Been Slowing Down. Horticulture and Marine Economics Outreach. MSU-CREC, Biloxi, MS. Virtual presentation. https://tinyurl.com/3hkvf3zt.
For accessibility assistance please contact Ben Posadas at ben.posadas@msstate.edu
Download
Vol. 13, No. 5 / The U.S. Tilapia Aquaculture Industry Has Been Slowing Down
2.72 MB
Filed Under
Departments
Authors
-
Ben Posadas Extension/Research Professor

- CREC-Coastal Research & Ext Center