Mississippi MarketMaker
Vol. 13, No. 2 / Has The U.S. Saltwater Shrimp Aquaculture Industry Slowed Down During The Past Decade?
Abstract
- This presentation shows the over-all trends in U.S. saltwater shrimp aquaculture production and farmgate values.
- U.S. shrimp aquaculture data are available from 1984 to 2020.
- Values beyond 2020 are predicted using econometric models developed by Dr. Posadas.
- U.S. saltwater shrimp aquaculture production index was constructed to show future growth trends in the industry.
- A scatter diagram shows the relationship between U.S. shrimp aquaculture production and deflated imputed farmgate prices.
Suggested Citation:
Posadas, Benedict C. 2023. Has the U.S. Saltwater Shrimp Aquaculture Industry Slowed Down During the Past Decade? Mississippi MarketMaker Newsletter, Vol. 13, No. 2. February 21, 2023.
Acknowledgment
This virtual presentation is a contribution of the Mississippi Agricultural and Forestry Experiment Station and the Mississippi State University Extension Service. This material is based upon work that is supported in part by the National Institute of Food and Agriculture, U.S. Department of Agriculture, Hatch project under accession number 081730 and NOAA (Office of Sea Grant, U.S. Dept. of Commerce, under Grant NA10OAR4170078, Mississippi Alabama Sea Grant Consortium).
Let Us Start Our Modeling Effort!
- The NOAA Fisheries and FAO Fish-Stat data on national aquaculture production are reported in pounds and tons per year, respectively.
- The NOAA Fisheries and FAO Fish-Stat data on national aquaculture farmgate values are reported in dollars per year.
- The national farmgate prices are imputed from the farmgate values and pounds.
- U.S. aquaculture data are available from 1984 to 2020.
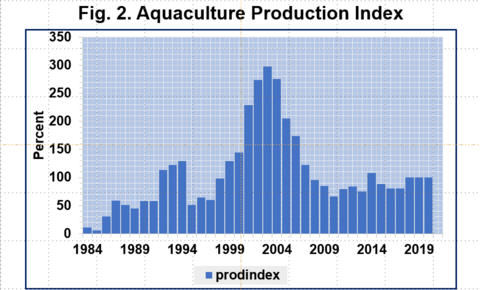
U.S. Aquaculture Production Index
- Aquaculture production index (API) is equal to current year production divided by base year production.
- The base year was the most recent annual production data in 2020.
- The API was computed for aquaculture production, farmgate value and imputed farmgate price.
U.S. Aquaculture Economic Models
- The Ordinary Least Squares (OLS) models of U.S. aquaculture consisted of the following dependent variables:
- Aquaculture production (lb/yr)
- Deflated farmgate value ($/yr)
- The OLS models of U.S. aquaculture were estimated using the robust variance procedure of STATA-16.
- The variation inflation factor was calculated to detect the possible presence of multicollinearity.
- The marginal impacts of disaster events were computed using the margins procedure.
U.S Aquaculture Production Economic Model
- The OLS model of U.S aquaculture production (lb/yr) assumed that annual production could be explained by the following:
- year
- recession, trade war, and pandemic (1 or 0)
- growth in per capita disposable income (%)
- other variables
U.S Aquaculture Farmgate Values Economic Model
- The OLS model of U.S. aquaculture farmgate values ($/yr) assumed that annual production could be explained by the following:
- year
- recession, trade war, and pandemic (1 or 0)
- aquaculture production (lb/yr)
- deflated farmgate price ($/lb)
- other variables
U.S. Saltwater Shrimp Aquaculture Producers
- The U.S. Aquaculture Census estimated that shrimp farms numbered 56 farms in 2013 and 39 farms in 2018.
- Total sales reached $43.2 M in 2013 and $45.6 M in 2018.
- In number of farms, the top three shrimp farming states in 2018 are Florida (11 farms), Hawaii (10 farms), and Texas (4 farms).
- Annual sales reported during census were 6.08 times more than the reported annual sales by NOAA Fisheries and FAO Fish-Stat in 2013 and 3.63 times more in 2018.
U.S. Saltwater Shrimp Aquaculture Production
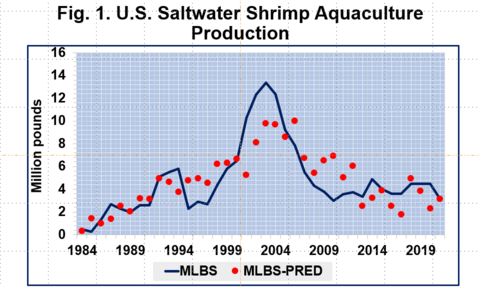
- Annual U.S. aquaculture production since 1984 is shown in Fig. 1.
- The blue curve (MLBS) shows annual saltwater shrimp aquaculture production reported by NOAA Fisheries and FAO Fish-Stat from 1984 to 2020.
- The red dots (MLBS-PRED1) are predicted annual saltwater shrimp aquaculture production using an econometric model estimated by Dr. Posadas for the years 1984 to 2021 with R-squared = 0.62.
- The U.S. saltwater shrimp aquaculture production peaked in early 2000 (Fig. 2). Since then, production declined and remained stagnant.
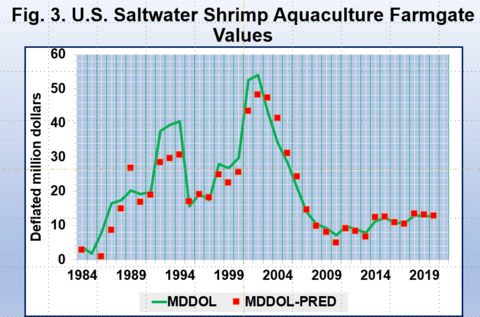
U.S. Saltwater Shrimp Aquaculture Farmgate Values
- Annual U.S. saltwater shrimp aquaculture farmgate values since 1984 is shown in Fig. 3.
- The green curve (DDMDOL) shows annual saltwater shrimp farmgate values reported by NOAA Fisheries and FAO Fish-Stat from 1984 to 2020.
- However, the 2013 and 2017 values, however, are lower than the Aquaculture Census estimates.
- The red dots (DDMDOL-PRED1) are predicted annual saltwater shrimp farmgate values using an econometric model estimated by Dr. Posadas for the years 1984 to 2020 with R-squared = 0.91.
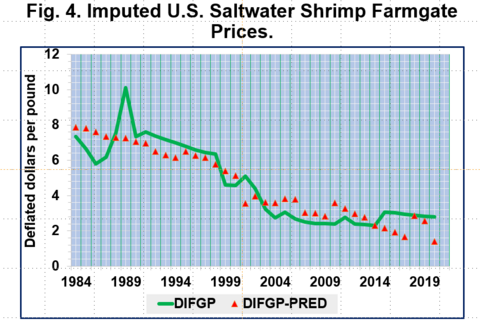
U.S. Saltwater Shrimp Aquaculture Farmgate Prices
- Annual U.S. saltwater shrimp farmgate prices imputed from production and farmgate values since 1984 are shown in Fig. 4.
- The green curve (DFGP) shows the deflated annual imputed saltwater shrimp farmgate prices from 1984 to 2020.
- The red dots (DFGP-PRED2) are predicted annual saltwater shrimp farmgate prices using an econometric model estimated by Dr. Posadas for the years 1984 to 2020 with R-squared = 0.82.
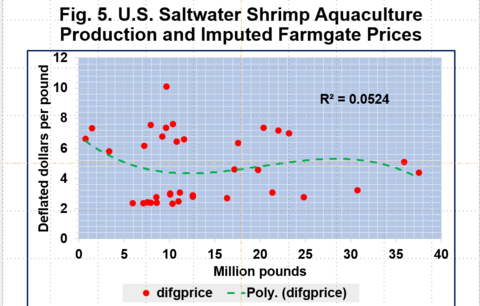
U.S. Saltwater Shrimp Aquaculture Production and Farmgate Prices
- The scatter diagram between the U.S. saltwater shrimp aquaculture production and imputed farmgate prices since 1984 is shown in Fig. 5.
- The red dots (DFGP) are the imputed saltwater shrimp farmgate prices at various levels of production from 1984 to 2020.
- The green dotted curve (Poly…DFGP) is the Excel-generated polynomial equation of predicted saltwater shrimp farmgate prices at various levels of production.
Summary and Implications
- In 2020, the global pandemic created disruptions in the marketplace and subsequently the production space.
- Recessions caused saltwater shrimp aquaculture production to decline.
- The U.S.-China trade war encouraged higher domestic shrimp aquaculture production.
- However, users are cautioned on the validity of these results due to inconsistency between reported data.
My Economic Outreach On Saltwater Shrimp
- Posadas, B.C. 2023a. Has the U.S. Saltwater Shrimp Aquaculture Industry Slowed Down During the Past Decade? HME Outreach. MSU-CREC, Virtual presentation.
- Posadas, B.C. 2023b. Has the U.S. Saltwater Shrimp Aquaculture Industry Slowed Down During the Past Decade? Mississippi MarketMaker Newsletter, Vol. 13, No. 2.
- Posadas, B.C. 2023c. Direct Impacts of Disaster Events on the Florida West Coast Commercial Shrimp Fisheries. HME Outreach, MSU-CREC, Biloxi, MS.
- Posadas, B.C. 2023d. Direct Impacts of Disaster Events on the Texas Commercial Shrimp Fisheries. HME Outreach, MSU-CREC, Biloxi, MS.
- Posadas, B.C. 2023e. Direct Impacts of Disaster Events on the Alabama Commercial Shrimp Fisheries. HME Outreach, MSU-CREC, Biloxi, MS.
- Posadas, B.C. 2023f. Direct Impacts of Disaster Events on the Mississippi Commercial Shrimp Fisheries. HME Outreach, MSU-CREC, Biloxi, MS.
- Posadas, B.C. 2023g. Direct Impacts of Disaster Events on the Louisiana Commercial Shrimp Fisheries. HME Outreach, MSU-CREC, Biloxi, MS.
- Posadas, B.C. 2023h. Direct Impacts of Disaster Events on the Gulf of Mexico Region Commercial Shrimp Fisheries. HME Outreach, MSU-CREC, Biloxi, MS.
- Posadas, B.C. 2023i. Impacts of Disaster Events on the Gulf of Mexico Region and States Commercial Landings. Oral presentation at the 2023 Bays and Bayous Symposium, Convention Center, Mobile, Alabama. January 25.
- Posadas, B.C. 2023j. Impacts of Disaster Events on the U.S. Processing and Imports of Breaded Shrimp Products. HME Outreach, MSU-CREC, Biloxi,
Download
Vol. 13, No. 2 / Has The U.S. Saltwater Shrimp Aquaculture Industry Slowed Down During The Past Decade?
1.82 MB
Filed Under
Departments
Authors
-
Ben Posadas Extension/Research Professor

- CREC-Coastal Research & Ext Center