Mississippi MarketMaker
Vol. 12, No. 11 / The Growing U.S. Clam Aquaculture Industry
Abstract
- This presentation shows overall U.S. clam aquaculture production trends and farmgate values.
- U.S. aquaculture data are available from 1983 to 2019.
- Values beyond 2019 are predicted using econometric models developed by Dr. Posadas.
Suggested Citation:
Acknowledgment
This virtual presentation is a contribution of the Mississippi Agricultural and Forestry Experiment Station and the Mississippi State University Extension Service. This material is based upon work that is supported in part by the National Institute of Food and Agriculture, U.S. Department of Agriculture, Hatch project under accession number 081730 and NOAA (Office of Sea Grant, U.S. Dept. of Commerce, under Grant NA10OAR4170078, Mississippi Alabama Sea Grant Consortium).
U.S. Clam Farms
- More than 300 farms were growing various clam species in the U.S. (2018 Census of Aquaculture).
- Hard clams are farmed mainly in Florida, Virginia, New Jersey, Massachusetts, Connecticut, and other states.
- Geoduck and Manila clams are primarily farmed in Washington.
Hard Clam Or Northern Quahog
- Hard Clam/Northern Quahog. Mercenaria mercenaria. Also known as Hard clam, Quahog, Round clam, or Chowder clam.
- U.S. farmed hard clams are a smart seafood choice because they are sustainably grown and harvested under U.S. state and federal regulations.
- Farming Methods. Clams are grown in tidal areas. They can be grown directly on the beach bottom or in mesh bags, trays, or pens that are secured to the bottom.
- Region. New England/Mid-Atlantic, Southeast.
- Source
Geoduck
- Geoduck. Panopea generosa. Also known as King Clam, Elephant Clam, Gweduck, Goeduck, Goiduck.
- Geoduck is both a wild harvest and a growing geoduck aquaculture industry, particularly in Washington State. The majority of Washington’s geoduck farming takes place in southern Puget Sound.
- Farming Methods. Geoducks are planted in PVC pipes on intertidal beaches until they are large enough to burrow into the sediment.
- Region. Alaska, West Coast.
- Source
Let us start our modeling effort!
- The NOAA Fisheries data on national aquaculture production are reported in pounds per year.
- The NOAA Fisheries data on national aquaculture farmgate values are reported in dollars per year.
- The national farmgate prices are imputed from the farmgate values and pounds of meat.
- U.S. aquaculture data are available from 1983 to 2019.
- Values beyond 2019 are predicted using econometric models developed by Dr. Posadas.
U.S. Aquaculture Economic Models
- The Ordinary Least Squares (OLS) models of U.S. aquaculture consisted of the following dependent variables:
- Aquaculture production (lb/yr)
- Deflated farmgate value ($/yr)
- The OLS models of U.S. aquaculture were estimated using the robust variance procedure of STATA-16.
- The variation inflation factor was calculated to detect the possible presence of multicollinearity.
- The marginal impacts of disaster events were computed using the margins procedure.
U.S Aquaculture Production Economic Model
- The OLS model of U.S aquaculture production (lb/yr) assumed that annual production could be explained by the following:
- year and year-squared
- recession (1 or 0)
- growth in per capita disposable income (%)
- other variables
U.S Aquaculture Farmgate Value Economic Model
- The OLS model of U.S. aquaculture farmgate value ($/yr) assumed that annual production could be explained by the following:
- year and year-squared
- recession (1 or 0)
- aquaculture production (lb/yr)
- growth in per capita disposable income (%)
- other variables
U.S. Clam Aquaculture, 2010-19
- Production (lb/yr)
- Farm-gate values ($/yr)
- Imputed farmgate prices ($/lb)
- Data were compiled from NOAA Fisheries website and reports.
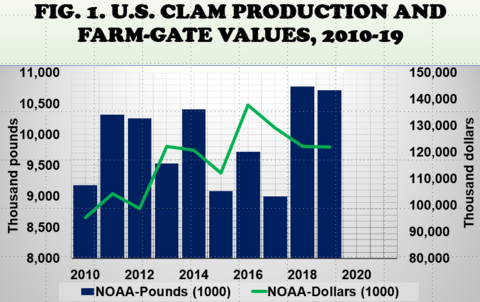
U.S. Clam Production And Farmgate Values, 2010-19
- As reported by NOAA Fisheries, NOAA-Pounds (1000) is the annual clam production in pounds.
- NOAA-Dollars (1000) is the annual clam farmgate values in dollars as reported by NOAA Fisheries.
- Annual production since 2014 averaged 9.95 million pounds (Fig. 1).
- Annual farmgate value since 2014 averaged $123.9 million (Fig. 1).
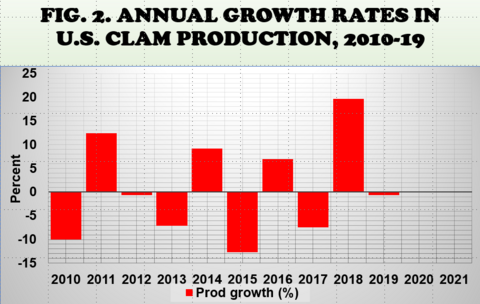
Annual Growth Rates In U.S. Clam Production, 2010-19
- Production growth is the annual growth rate in yearly clam production in percent.
- The annual production growth rate since 2014 averaged 2.53 percent (Fig. 2).
- The Annual deflated farmgate value growth rate since 2014 averaged -1.07 percent.
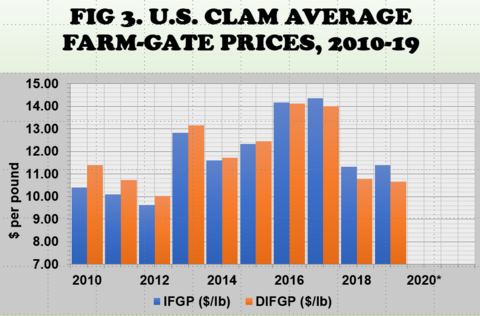
U.S. Clam Average Farmgate Prices, 2010-19
- Wholesale clam prices are reported by Urner Barry Comtell in dollars per bushel.
- The imputed farmgate price (IFGP) is expressed in dollars per pound.
- The deflated imputed farmgate price (DIFGP) is IFGP divided by the consumer price index (Fig. 3).
- The imputed farmgate price (IFGP) since 2014 averaged $12.53 per pound.
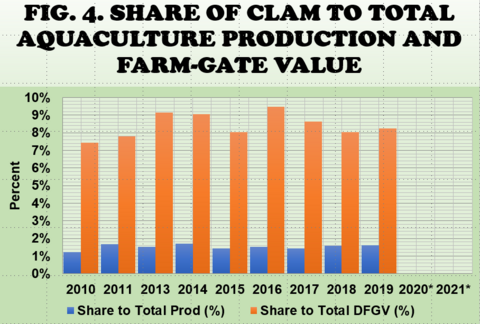
Share Of Clam To Total Aquaculture Production And Farmgate Value
- Share to total is the percent contribution of clam production or farmgate value to total U.S. aquaculture production or farmgate value.
- Share to total U.S. aquaculture production of clam production since 2014 averaged 1.6 percent (Fig. 4).
- Share to total U.S. farmgate value of clam aquaculture since 2014 averaged 8.6 percent (Fig. 4).
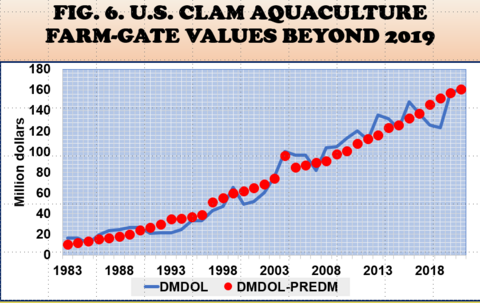
U.S. Clam Aquaculture, 1983 To 2021
- Production (lb/yr)
- Farm-gate values ($/yr)
- Imputed farmgate prices ($/lb)
- Data from 1983 to 2019 were compiled from the NOAA Fisheries website and reports (Fig. 5 & 6).
- Values from 2020 to 2021 were predicted using econometric models developed by Dr. Posadas (Fig. 5 & 6).
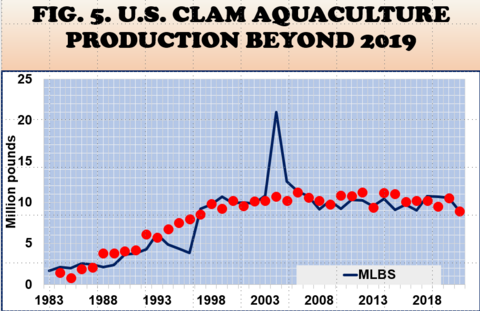
U.S. Clam Aquaculture Production Beyond 2019
- The estimated OLS equation of clam aquaculture production explained 72 percent of the variations in annual clam production.
- Time is a significant determinant of annual clam production.
- Recession is a negative but not significant determinant of annual clam production.
- The growth in per capita disposable income is a positive and significant determinant of annual clam production.
U.S. Clam Aquaculture Farmgate Values Beyond 2019
- The estimated OLS equation of clam aquaculture production explained 94 percent of the variations in annual clam farmgate values.
- Time is a significant determinant of annual clam farmgate values.
- Recession is a negative but not significant determinant of annual clam farmgate values.
- Annual clam production is a positive and significant determinant of annual clam farmgate values.
Marginal Impacts Of Recessions
- Recessions caused clam production to fall by an average of -0.19 million pounds per year, and
- Deflated farmgate values to decline by an average of -$0.58 million per year.
Summary And Implications
- Why is annual clam production predicted to be lower in 2020 and 2021?
- In 2020, the global pandemic created disruptions in the marketplace and production space.
- Recessions disrupted domestic production and markets of farmed clams.
My Economic Outreach On Clams
- Posadas, B.C. 2022a. The Growing U.S. Clam Aquaculture Industry. HME Outreach. MSU-CREC, Biloxi, MS. Virtual presentation.
- Posadas, B.C. 2022b. U.S Processing Production of Clam Products. HME Outreach. MSU-CREC, Biloxi, MS. Virtual presentation.
- Posadas, B.C. 2022c. The Growing U.S. Clam Aquaculture Industry. Mississippi MarketMaker Newsletter, Vol. 12, No. 11. November 15, 2022.
- Posadas, B.C. 2022d. U.S Supply of Clam Products. HME Outreach. MSU-CREC, Biloxi, MS. Virtual presentation.
Download
Vol. 12, No. 11 / The Growing U.S. Clam Aquaculture Industry
2.02 MB
Filed Under
Departments
Authors
-
Ben Posadas Extension/Research Professor

- CREC-Coastal Research & Ext Center