P4174
Mississippi Agricultural Land Market: Recent Transaction Trends
Agricultural and forest land are essential components of the rural economy throughout the southern United States. These lands support crop and livestock production, timber, recreation, and long-term investment opportunities.
In recent years, there has been growing discussion that demand for agricultural land isn’t coming solely from producers. From media reports and even casual conversations with neighbors, we often hear about large businesses purchasing large tracts of farmland or significant parcels being sold to developers. Despite these stories and the concerns, there is little concrete information about how frequently non-producer buyers participate in the agricultural land market.
As regional demand for agricultural land continues to evolve, understanding who is buying land and how land-use patterns are shifting is increasingly important for producers, lenders, Extension agents, and policymakers. The goal of this publication is to provide an overview of recent agricultural land transactions in Mississippi, offering insights into the makeup of market participants and key emerging trends in agricultural land markets.
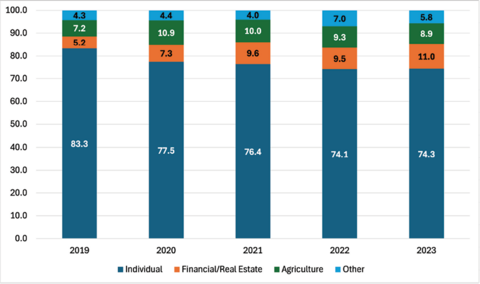
Types of Buyers Participating in Mississippi Agricultural Land Markets
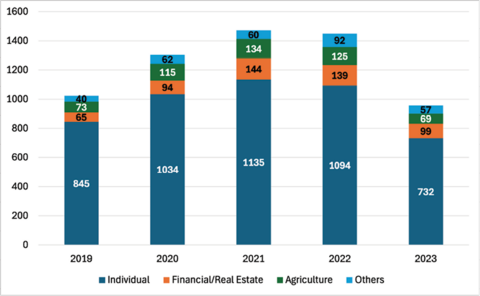
Our data is based on agricultural land transactions from January 2019 through the first half of 2023. Buyers of agricultural property are categorized into four groups:
- individuals and general partnerships (GPs)
- financial and real estate businesses
- non-individual/non-GP agricultural businesses
- other industries
As shown in Figure 1, farmland transactions are predominantly carried out by individuals and general partnerships, represented by the dark blue bars. This group consistently accounts for roughly 70–80% of total transactions across all years. Financial and real estate businesses, shown in orange, have increased their presence over time; although their overall share remains relatively small, it rose from 6% in 2019 to 10% in the first half of 2023. Non-individual, non-GP agricultural businesses, depicted in green, comprised approximately 7–9% of transactions during the period. Finally, all other businesses—shown in light blue and including construction, warehousing, and other non-agricultural industries—accounted for about 4–6% of total agricultural land transactions.
Transactions Across Different Agricultural Land Types
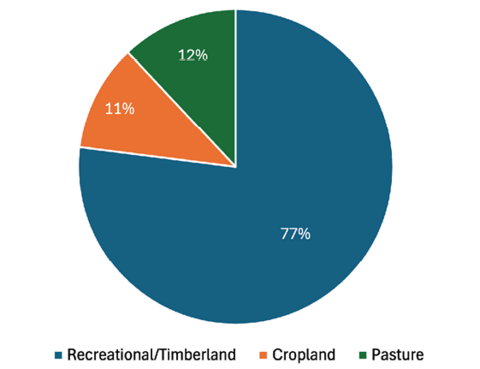
We examined three different land types: cropland, pasture, and recreational/timberland.
In Figure 2, we observe that most land transactions involve recreational or timberland, which made up 77% of all agricultural land purchases from 2019 to early 2023. Timberland dominates rural areas across much of the South, with its large share of transactions reflecting both its availability and appeal to investors. Cropland accounted for 11% of agricultural land transactions, while pasture comprised the remaining 12% of transactions.
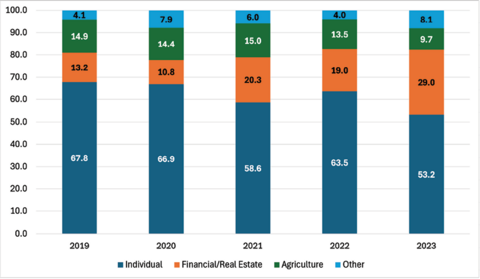
Cropland
Cropland transaction data shows the most notable shift toward investor participation, as shown in Figure 3. Between 2019 and early 2023:
- Individual buyers’ market share decreased from about 68% to 53%.
- The share of non-individual/non-GP agricultural business transactions fell from 15% to roughly 10%.
- The share of transactions from financial and real estate buyers increased sharply from 13% to 29%, more than doubling.
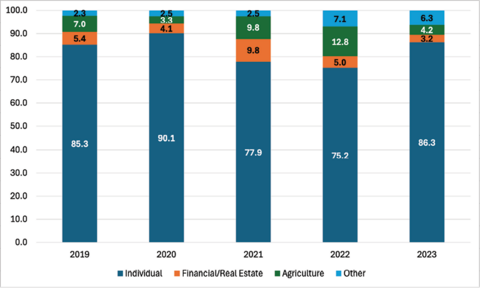
Pasture
Pasture remains the most stable and producer-driven category, as shown in Figure 4:
- Individuals consistently accounted for 85–86% of all pasture purchases.
- The share of non-individual/non-GP agricultural business transactions declined modestly from 7% to 4%.
- The share of transactions from financial/real estate buyers decreased slightly from 5% to 3%.
Recreational/Timberland
Recreational/timberland also experienced some shifts over the years, as shown in Figure 5:
- Financial and real estate buyers increased from 5% to 11%.
- The share of non-individual/non-GP agricultural businesses also rose modestly from 7% to 9%.
- Individuals continued to represent the majority of land buyers, although their share declined slightly as investors increased their activity.
Overall Market Shifts and Implications
The most significant trend observed in agricultural land markets in Mississippi is the growing presence of financial and real estate businesses, particularly in cropland and recreation/timberland.
- Cropland has the most diversified buyer pool and shows the most notable shift toward investor participation. Representation of both individual/GP producers and non-individual agribusinesses shrunk significantly over the years.
- Pasture remains the most stable and producer-driven category, reflecting the long-term nature of livestock operations and the prevalence of family ranching across the southern region.
- Recreational and timberland buyers are still dominated by individuals, but less traditional buyers have made modest gains in market share. Notably, the share of financial and real estate developers doubled over the 2019–2023 period.
Increasing participation of different groups can result in new capital entering rural land markets, increased land valuation, and potential for diversified land uses. However, possible challenges should be considered, including higher land prices, greater competition for limited cropland, and potential barriers for small, beginning, and socially disadvantaged farmers.
Monitoring these patterns can help Extension professionals, rural leaders, lenders, and policymakers respond proactively to ensure that land markets remain accessible and supportive of agricultural communities.
Publication 4174 (POD-02-26)
By Hudu Abukari, Graduate Student; Kevin Kim, PhD, Assistant Professor; Ayoung Kim, PhD, Assistant Professor; Brian Mills, PhD, Associate Professor; and Steven Martin, PhD, Professor, Agricultural Economics.
The Mississippi State University Extension Service is working to ensure all web content is accessible to all users. If you need assistance accessing any of our content, please email the webteam or call 662-325-2262.
Download

P4174
Mississippi Agricultural Land Market: Recent Transaction Trends
611.07 KB
Departments
Authors
-
 Graduate Research Assistant
- Agricultural Economics
-
Assistant Professor
- Agricultural Economics
-
Associate Professor
- Agricultural Economics
-
 Extension Professor
- Delta Research and Extension Center