Introduction
Mississippi marine regulatory agencies needed updated estimates of the seafood industry's economic contributions to manage state marine resources effectively. This need became urgent after the massive damage from the natural and technological disasters that hit the seafood industry. State regulatory agencies expressed a greater need for additional information on the economic contributions of the seafood industry, by sector and by species landed, processed, distributed, and consumed in Mississippi. At a Producer Advisory Council Meeting (CREC, 2007), the American Shrimp Processors Association requested up-to-date estimates for the seafood industry by species. Recent conversations with state regulatory agency officials indicate their need for updated estimates of the state seafood industry's economic contributions by major species. This up-to-date information is essential in their marketing and legislative campaigns.
This publication presents the techniques and estimates of the economic contribution of the Mississippi seafood industry by dominant species, sector, and type of contribution in 2023. The different sectors of the Mississippi seafood industry include seafood harvesting, processing, wholesaling, importing, and retailing. The major seafood species covered are shrimp, oysters, crabs, and finfish. The types of economic contributions include sales, employment, income, and value added.
2009 Breakdown by Major Species
The 2009 Mississippi seafood industry contributed $275.59 million in sales and provided 6,342 jobs in harvesting, processing, wholesaling, fish markets, and restaurants. The commercial-harvesting sector contributed $60.86 million, or 22.1 percent of the industry's total sales. The seafood-processing sector accounted for $78.91 million, or 28.6 percent of total industry sales. The seafood wholesaling sector generated additional sales of $10.45 million, or 3.8 percent of the industry's total. Fish markets generated $18.1 million, or 6.6 percent of the entire industry. Seafood restaurants accounted for $107.28 million, or 38.9 percent of total sales.
The first attempt was to break down the total estimates of the economic contributions of the Mississippi seafood industry in 2009 by major species, as reported by NOAA Fisheries (2026a). The Mississippi commercial shrimp industry contributed $141.77 million in sales to the state economy in 2009. This economic output created 3,091 jobs and generated a total personal income of $57.44 million. The commercial shrimp industry's contribution to indirect business tax collections reached $6.73 million (Posadas, 2014).
The total economic output of the Mississippi commercial oyster industry reached $23.72 million in sales in 2009. This economic output created 562 jobs and generated $9 million in annual income. The commercial oyster industry contributed about $1.15 million to indirect business tax collections.
In 2009, the Mississippi commercial crab industry created a total economic output of $8.18 million. This economic output created 244 jobs and generated a total personal income of $3.55 million. This industry contributed about $0.52 million to indirect business tax collections.
The Mississippi commercial finfish industry in 2009 generated a total economic output of $101.91 million. This economic output created 2,445 jobs and generated a total personal income of $57.44 million. The commercial finfish industry's contribution to the indirect business tax collections reached $4.68 million in 2009.
2015 Breakdown by Major Species
The breakdown was updated by major species using the total estimates of the economic contributions of the Mississippi seafood industry in 2015, which NOAA Fisheries (2026a) reported. In 2015, the entire Mississippi seafood industry contributed $465.4 million in sales to the state economy, created 9,491 jobs, and generated $186 million in personal income. Commercial harvesting contributed $107.1 million (23% of sales contribution). The seafood-processing sector accounted for $138 million in sales(29.6% of total sales). Seafood imports accounted for $0.5 million (0.1% of total sales contribution). Seafood wholesaling accounted for $19 million in sales (4.1% of total sales contribution). Seafood retailing generated $200.8 million in sales (43.1% of total sales).
The 2015 estimates by major species covered shrimp, oysters, crabs, and finfish. The oyster and crab species were combined to protect the confidentiality of the sources, especially when the number of producers is fewer than three (Posadas, 2018).
The entire shrimp industry in 2015 contributed $215.4 million in sales, created 4,276 jobs, and generated a total personal income of $88.5 million. Processing (38%), retailing (45.9%), landings (9.1%), and wholesaling (6.6%) were the most significant components of the state shrimp industry in 2015.
Processing data on oysters and crabs were combined in 2015 to prevent the disclosure of confidential data reported by seafood processors in Mississippi. The combined oyster and crab industry added $35 million in sales, created 831 jobs, and generated a total personal income of $14.8 million. Retailing (69.7%), processing (11.4%), harvesting (9.7%), and wholesaling (9.1%) were the most significant parts of the state oyster and crab industry in 2015.
The entire Mississippi finfish industry in 2015 contributed $215 million in sales, created 4,384 jobs, and generated a total personal income of $82.6 million. Harvesting (39.1%), retailing (36%), and processing (24.2%) were the largest sectors of the state finfish industry in 2015.
2020 Breakdown by Major Species
The breakdown was updated by major species and the total estimates of the economic contributions of the Mississippi seafood industry in 2020, as reported by NOAA Fisheries (2026a). In 2020, the entire Mississippi seafood industry contributed $347 million in sales to the state economy, created 6,460 jobs, generated $137 million in personal income, and produced value added amounting to $204 million. Commercial harvesting contributed $83 million (24% of sales contribution). The seafood-processing sector accounted for $108 million in sales (31% of total sales). Seafood imports accounted for $3 million (1% of total sales contribution). Seafood wholesaling accounted for $14 million in sales (4% of total sales contribution). Seafood retailing generated $139 million in sales (40% of total sales).
The 2020 estimates by major species covered shrimp, oysters, crabs, and finfish. The oyster and crab species were combined to protect the confidentiality of the sources, especially when the number of producers is fewer than three business establishments (Posadas, 2023).
The entire shrimp industry in 2020 contributed $166.8 million in sales, created 2,995 jobs, generated a total personal income of $67.0 million, and produced $99.1 million in value-added contribution. Processing (38.4%), retailing (41.2%), landings (12.4%), and wholesaling (6.3%) were the most significant components of the state shrimp industry in 2020.
Processing values of oysters and crabs were combined in 2020 to prevent the disclosure of confidential data reported by seafood processors in Mississippi. The combined oyster and crab industry added $24.6 million in sales, created 542 jobs, generated a total personal income of $10.4 million, and produced $15.2 million in value-added contributions. Retailing (69.0%), processing (12.7%), harvesting (8.7%), and wholesaling (9.6%) were the most significant parts of the state oyster and crab industry in 2020.
The entire Mississippi finfish industry in 2020 contributed $155.5 million in sales, created 2,923 jobs, generated a total personal income of $59.5 million, and produced $89.4 million in value-added contribution. Harvesting (38.5%), retailing (34.6%), and processing (26.2%) were the largest sectors of the state finfish industry in 2020.
Estimating Economic Contributions by Major Species
Economic contribution is defined as the gross changes in a region's existing economy that can be attributed to a given industry, event, or policy (Watson et al., 2007). This publication calculates the total economic activity for four major seafood species that are harvested, processed, traded, and handled by different sectors of the Mississippi seafood industry.
The NOAA Fisheries model estimated four types of economic contributions: employment, income, total value added, and output or sales. Estimates of the indirect tax contribution of the Mississippi seafood industry were not reported in the 2023 statewide results of the NOAA Fisheries model. Economic contributions were determined by sector, including harvesting, processing, importing, wholesaling, and retailing. However, the estimates were not broken down by major seafood species. The 2023 statewide results of the NOAA Fisheries economic model for Mississippi were used to determine the 2023 economic contributions of the state seafood industry by sector, dominant species, and type of contribution.
Seafood Production Sectors
The 2023 total economic contributions of Mississippi's commercial-harvesting and seafood-processing sectors were broken down by significant species using the 2023 dockside values and processing-plant-gate or wholesale values reported by NOAA Fisheries.
Mississippi commercial harvesting contributions in 2023 were split according to the 2023 total state commercial landing values for each of the four major species (NOAA Fisheries, 2026b). Shrimp landings contributed 15.61 percent of total dockside values in Mississippi in 2023 (Fig. 1). Brown and white shrimp are the primary species that state commercial shrimpers harvest. No oyster landings were reported in 2023. The state public oyster reefs have been closed since 2019 due to massive damage from the prolonged openings of the Bonnet Carré Spillway in 2019. Crabs added 3.88 percent to total ex-vessel values. Finfish species contributed most of Mississippi's total landing value (80.5%) in 2023. Almost all the finfish dockside values consisted of menhaden landings, contributing 78.7 percent of the statewide dockside values.
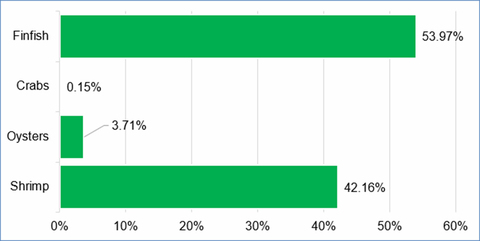
Total contributions of Mississippi seafood processing in 2023 were distributed according to the 2023 total plant-gate values of the processed products for each of the four major species provided by NOAA Fisheries (personal communication, July 7, 2026). Processed shrimp products contributed 42.1 percent of Mississippi's total plant-gate values of seafood processing in 2023 (Fig. 2). Oysters added 3.7 percent to processed seafood products' total plant-gate values. Crabs added 0.15 percent to total plant-gate values. Finfish species contributed 53.9 percent to the total plant-gate values in Mississippi in 2023.
Figure 1. Percent distribution of Mississippi commercial landings values by major species in 2023. Source: NOAA Fisheries (2026).
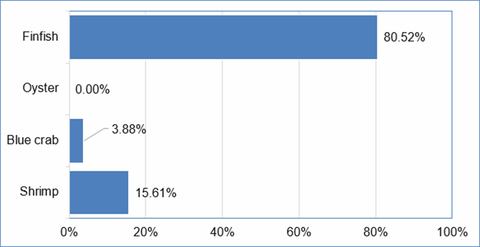
Figure 2. Percent distribution of Mississippi seafood processing plant-gate values by major species in 2023. Source: NOAA Fisheries (personal communication, July 7, 2026).
Seafood Distribution Sectors
The 2023 total economic contributions of seafood wholesaling were separated according to the expenditure shares of each of the four major species reported by these sectors in a 2011 survey of Mississippi seafood wholesalers. The 2011 wholesale sales values were the only data available for wholesaler seafood transactions broken down by major species in Mississippi. Among seafood wholesalers, shrimp products made up 74.8 percent of their total purchases of Mississippi seafood products in 2011. Oysters accounted for 15.2 percent of total seafood purchases by seafood wholesalers in 2011. Crab purchases accounted for 1.7 percent of total seafood purchases by seafood wholesalers in 2011. Finfish species contributed 8.3 percent more to total wholesale seafood purchases in Mississippi in 2011.
NOAA Fisheries combined the contributions of seafood restaurants and seafood and fish markets under seafood retailing in 2023. Total seafood expenditures on individual species by seafood restaurants and seafood and fish markets were merged under seafood retailing based on the 2011 survey of Mississippi seafood and fish markets and the 2009 survey of Mississippi seafood restaurants.
Results of the 2011 survey of Mississippi seafood restaurants for transactions in January–December 2009 were the only available seafood expenditure data for these establishments broken down by major seafood species (Posadas et al., 2016). Results of the January–December 2011 survey transactions by Mississippi seafood markets were the only expenditure data on seafood transactions broken down by major species. These survey data, however, are now outdated, and any further breakdown of economic impact estimation will require updated expenditure surveys of wholesale, retail, and restaurant sales transactions of seafood products in the state.
Among seafood-retailing establishments only, shrimp products made up 49.3 percent of their total purchases of seafood products in Mississippi in 2009. Oysters added 7.1 percent to seafood purchases by seafood markets and restaurants. Crabs accounted for 5.1 percent of total seafood purchases. Finfish species contributed 38.5 percent more to their total seafood purchases in Mississippi.
Shrimp purchases were assumed to consist mostly of Mississippi seafood imports in 2023. Seafood importers were not included in the 2011 survey of seafood wholesalers and retailers. It is important to note the lack of data on seafood importers and the older survey data on seafood wholesalers, fish markets, and seafood restaurants. These data limitations reduce the accuracy of the estimates of the breakdown of total economic contributions by sector, major seafood species, and type of contribution.
Estimates of Economic Contributions by Major Species
Total Economic Contributions of the Seafood Industry
In 2023, the entire Mississippi seafood industry contributed $228.9 million in sales to the state economy, created 3,513 jobs, generated a total personal income of $89.1 million, and added $115.5 million in value-added to the state gross regional product. Table 1 shows the NOAA Fisheries (2026a) estimates of the total economic contributions of the entire Mississippi seafood industry by sector and type in 2023. Commercial harvesting contributed $57.2 million (25% of total sales contribution). The seafood-processing sector added sales of $77 million (33.6% of the total sales contribution). Seafood imports added $4.6 million (2% of the total sales contribution). Seafood wholesaling produced sales of $11.5 million (5% of the total sales contribution). Seafood retailing generated $78.5 million in sales (34.3% of the total sales contribution).
Table 1. Economic contributions of the Mississippi seafood industry in 2023 | ||||
| Sector | Sales contributions (T$) | Job contributions (Jobs) | Income contributions (T$) | Value added contributions (T$) |
| Commercial harvesters | 57,250 | 879 | 18,363 | 26,084 |
| Seafood processors & dealers | 77,012 | 743 | 30,468 | 38,177 |
| Seafood importers | 4,631 | 12 | 742 | 1,412 |
| Seafood wholesalers & distributors | 11,500 | 90 | 4,058 | 5,113 |
| Seafood retailing | 78,515 | 1,789 | 35,537 | 44,720 |
| Total | 228,909 | 3,513 | 89,168 | 115,506 |
Economic Contributions of the Shrimp Industry
Table 2 shows the breakdown of the Mississippi commercial shrimp industry's contributions to the state economy by sector and type in 2023. The shrimp industry contributed $93.5 million in sales, created 1,414 jobs, generated a total personal income of $37.1 million, and added $47.5 million in value-added contributions to the state economy. Processing (34.7%), retailing (41.4%), harvesting (9.7%), and wholesaling (9.2%) were the largest components of the state shrimp industry in 2023.
Table 2. Economic contributions of the Mississippi shrimp industry in 2023 | ||||
| Sector | Sales contributions (M$) | Job contributions | Income contributions (M$) | Value-added contributions (M$) |
| Commercial harvesters | 9.1 | 140 | 2.9 | 4.1 |
| Seafood processors & dealers | 32.5 | 313 | 12.8 | 16.1 |
| Seafood importers | 4.6 | 12 | 0.7 | 1.4 |
| Seafood wholesalers & distributors | 8.6 | 67 | 3.0 | 3.8 |
| Seafood retailing | 38.7 | 882 | 17.5 | 22.0 |
| Total | 93.5 | 1,414 | 37.1 | 47.5 |
Economic Contributions of the Oyster Industry
Table 3 presents the breakdown of the Mississippi commercial oyster industry's contributions to the state economy by sector and type in 2023. The oyster industry added $10.2 million in sales, created 168 jobs, generated a total personal income of $4.3 million, and added $5.4 million in value-added contributions to the state economy. Retailing (54.7%), processing (28.2%), and wholesaling (17.2%) were the most significant parts of the state oyster and crab industry in 2023. No oyster harvesting was reported from 2019 to 2023 due to the 2019 Bonnet Carré Spillway disaster.
Table 3. Economic contributions of the Mississippi oyster industry in 2023 | ||||
| Sector | Sales contributions (M$) | Job contributions | Income contributions (M$) | Value-added contributions (M$) |
| Commercial harvesters | 0.0 | 0 | 0.0 | 0.0 |
| Seafood processors & dealers | 2.9 | 28 | 1.1 | 1.4 |
| Seafood importers | 0.0 | 0 | 0.0 | 0.0 |
| Seafood wholesalers & distributors | 1.7 | 14 | 0.6 | 0.8 |
| Seafood retailing | 5.5 | 126 | 2.5 | 3.2 |
| Total | 10.2 | 168 | 4.3 | 5.4 |
Economic Contributions of the Crab Industry
Table 4 presents the breakdown of the Mississippi commercial crab industry's contributions to the state economy by sector and type in 2023. The crab industry added $5.5 million in sales, created 112 jobs, generated a total personal income of $2.3 million, and added $3.0 million in value-added contributions to the state economy. Retailing (39.4%) and harvesting (11.5%) were the most significant parts of the state crab industry in 2023.
Table 4. Economic contributions of the Mississippi crab industry in 2023 | ||||
| Sector | Sales contributions (M$) | Job contributions | Income contributions (M$) | Value-added contributions (M$) |
| Commercial harvesters | 1.2 | 18 | 0.4 | 0.5 |
| Seafood processors & dealers | 0.1 | 1 | 0.0 | 0.1 |
| Seafood importers | 0.0 | 0 | 0.0 | 0.0 |
| Seafood wholesalers & distributors | 0.2 | 1 | 0.1 | 0.1 |
| Seafood retailing | 4.0 | 91 | 1.8 | 2.3 |
| Total | 5.5 | 112 | 2.3 | 3.0 |
Economic Contributions of the Finfish Industry
Table 5 illustrates the breakdown of the contributions of the Mississippi commercial-finfish industry to the state economy by sector and type in 2023. The entire finfish industry contributed $119.8 million in sales, created 1,819 jobs, generated a total personal income of $45.5 million, and added $59.7 million in value-added contributions to the state economy. Harvesting (39.2%), retailing (25.3%), and processing (34.7%) were the largest sectors of the state finfish industry in 2023.
Table 5. Economic contributions of the Mississippi finfish industry in 2023 | ||||
| Sector | Sales contributions (M$) | Job contributions | Income contributions (M$) | Value-added contributions (M$) |
| Commercial harvesters | 47.0 | 722 | 15.1 | 21.4 |
| Seafood processors & dealers | 41.6 | 401 | 16.4 | 20.6 |
| Seafood importers | 0.0 | 0 | 0.0 | 0.0 |
| Seafood wholesalers & distributors | 1.0 | 7 | 0.3 | 0.4 |
| Seafood retailing | 30.3 | 689 | 13.7 | 17.2 |
| Total | 119.8 | 1,819 | 45.5 | 59.7 |
Summary and Implications
This publication presents the most recent estimates of the economic contributions to the Mississippi seafood industry. The estimates include four types of economic contributions: employment, income, total value added, and output or sales. Economic contributions were divided by sector, including harvesting, processing, importing, wholesaling, and retailing. However, estimates were not itemized by major seafood species.
The 2023 total economic contributions of the Mississippi commercial-harvesting and seafood-processing sectors were broken down by major species using the 2023 ex-vessel, dockside, or landing values, and processing plant-gate or wholesale values. The 2023 Mississippi commercial harvesting contributions were split according to the 2023 total state commercial landing values of each of the four major species. The 2023 total contributions of Mississippi seafood processing were divided according to the 2023 state total plant-gate values of processed products for each of the four major species.
The 2023 total economic contributions of seafood wholesaling were separated according to the expenditure shares on each of the four major species reported in the 2011 survey of Mississippi seafood wholesalers. The total seafood expenditures by seafood restaurants and seafood and fish markets were merged under seafood retailing based on the 2011 survey of Mississippi seafood and fish markets and the 2009 survey of Mississippi seafood restaurants. However, the results of these seafood establishment surveys are now outdated, and any further breakdown of future economic estimates will require updated establishment surveys of the expenditures by wholesalers, retailers, and restaurants on seafood products.
The entire Mississippi seafood industry contributed $228.9 million in sales to the state economy, created 3,513 jobs, generated a total personal income of $89.1 million, and added $115.5 million in value-added contributions to the state economy. Commercial harvesting contributed $57.2 million (25% of total sales contribution). The seafood-processing sector added sales of $77 million (33.6% of the total sales contributions). Seafood imports added $4.6 million (2% of the total sales contribution). Seafood wholesaling produced sales of $11.5 million (5% of the total sales contribution). Seafood retailing generated $78.5 million in sales (34.3% of the total sales contribution).
Mississippi's commercial shrimp industry contributed $93.5 million in sales, created 1,414 jobs, generated a total personal income of $37.1 million, and added $47.5 million in value-added contributions to the state economy. Processing (34.7%), retailing (41.4%), harvesting (9.7%), and wholesaling (9.2%) were the largest components of the state shrimp industry in 2023.
The oyster industry added $10.2 million in sales, created 168 jobs, generated a total personal income of $4.3 million, and added $5.4 million in value-added contributions to the state economy. Retailing (54.7%), processing (28.2%), and wholesaling (17.2%) were the most significant parts of the state oyster industry in 2023. No oyster harvesting was reported since 2019 due to the Bonnet Carré Spill disaster.
The Mississippi commercial crab industry added $5.5 million in sales, created 112 jobs, generated a total personal income of $2.3 million, and added $3.0 million in value-added contributions to the state economy. Retailing (39.4%) and harvesting (11.5%) were the most significant parts of the state crab industry in 2023.
The Mississippi commercial-finfish industry contributed $119.8 million in sales, created 1,819 jobs, generated a total personal income of $45.5 million, and added $59.7 million in value-added contributions to the state economy. Harvesting (39.2%), retailing (25.3%), and processing (34.7%) were the largest sectors of the state finfish industry in 2023.
Literature Cited
CREC. 2017. Producer Advisory Council Meeting: Commodity Group Session Notes. Mississippi State University, Coastal Research and Extension Center, Biloxi, Mississippi.
NOAA Fisheries. 2026a. Fisheries Economics of the United States. National Oceanic and Atmospheric Administration, Sustainable Fisheries. Last accessed: July 20, 2026.
NOAA Fisheries. 2026b. Commercial Fisheries Statistics. National Oceanic and Atmospheric Administration. Last accessed: July 20, 2026.
Posadas, B. C. 2014. Economic Impacts of the Mississippi Seafood Industry by Major Species in 2009. Mississippi Agricultural and Forestry Experiment Station Bulletin 1209, Mississippi State, Mississippi.
Posadas, B. C. 2018. Economic Impacts of the Mississippi Seafood Industry by Major Species in 2015. Mississippi State University Extension Publication 3194, Mississippi State, Mississippi. Last retrieved: July 27, 2023.
Posadas, B. C. 2023. Economic Contributions of the Mississippi Seafood Industry by Major Species in 2020. Mississippi State University Extension Publication 3954, Mississippi State, Mississippi. Last retrieved: July 30, 2026.
Posadas, B. C., A. K. Seymour, and R. A. Posadas. 2016. Survey of Seafood Products Handled by Mississippi Restaurants. Mississippi Agricultural and Forestry Experiment Station Bulletin 1219, Mississippi State, Mississippi.
Watson, P., J. Wilson, D. Thilmany, and S. Winter. 2007. Determining Economic Contributions and Impacts: What is the difference and why do we care? Journal of Regional Analysis & Policy, 37(2): 140-146.
Keywords
Economic contributions, Mississippi seafood industry, by major species.
Suggested Citation
Posadas, Benedict C. 2026. Economic Contributions of the Mississippi Seafood Industry by Major Species in 2023. Vol. 16, No. 8. Mississippi State University Extension and Mississippi-Alabama Grant Publication MASGP-26-059-8. August 12, 2026. 12 pp. https://extension.msstate.edu/newsletters/mississippi-marketmaker.
Acknowledgements
This newsletter is a contribution of the Mississippi Agricultural and Forestry Experiment Station and the Mississippi State University Extension Service. This material is based on work supported in part by the National Institute of Food and Agriculture, U.S. Department of Agriculture, Hatch project under accession number 100004, and the Mississippi-Alabama Sea Grant Consortium, National Oceanic and Atmospheric Administration, U.S. Department of Commerce, and the states of Alabama and Mississippi - federal grant number NA24OARX417C0155-T1-01. The statements, findings, conclusions, and recommendations are those of the authors and do not necessarily reflect the views of any of these funders.
Download
Vol. 16, No. 8 / Economic Contributions of the Mississippi Seafood Industry by Major Species in 2023
565.74 KB