Abstract
- This newsletter examines the annual calculated duties and revenue impacts of tariffs on U.S. seafood imports from 1989 to 2025.
- The average rates of calculated duties imposed on major countries of origin are compiled in 2018, 2024, and 2025.
- This newsletter also identifies the major countries of origin subject to the highest calculated duties in 2018, 2024, and 2025.
Keywords
- Seafood imports, calculated duties, and countries of origin.
Suggested Citation
- Posadas, Benedict C. 2026. Direct Revenue Impacts of Tariffs on U.S. Seafood Imports. Vol. 16, No. 4. Mississippi State University Extension and Mississippi-Alabama Grant Publication MASGP-26-059-4. March 31, 2026. https://extension.msstate.edu/newsletters/mississippi-marketmaker.
Methods
- The direct revenue impacts of all U.S. seafood imports are the sum of the calculated duties imposed on imported products.
- Annual data on calculated duties on U.S. seafood imports are compiled from the NOAA Fisheries website from 1989 to 2025.
- The calculated duties on major countries of origin are compared in 2018, 2024, and 2025.
- Source of raw data: https://www.fisheries.noaa.gov/foss.
Calculated Duties on U.S. Seafood Imports, 1989-2025
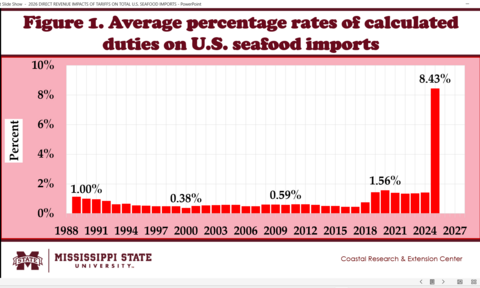
- Fig. 1 shows the average percentage rates of calculated duties on the total U.S. imports since 1989.
- The average rates of calculated duties on U.S. seafood imports were generally below 1% from 1989 to 2017.
- After the US-China trade war began in July 2018, the average rate rose to about 1.5%.
- In 2025, the average percentage rate of calculated duties was about 8.43%.
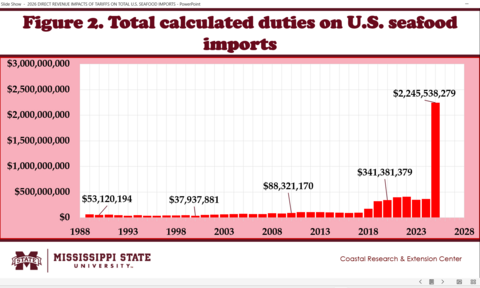
- Figure 2 shows the total calculated duties on U.S. seafood imports since 1989.
- Between 1989 and 2017, calculated duties ranged from $35 to $100 million per year.
- After the U.S.-China trade war began in July 2018, calculated annual duties rose to $319.27 million in 2019 and peaked in 2022 at $407.29 million.
- The total calculated duties of total U.S. seafood imports in 2025 reached $2.24 billion, more than five times the previous peak in 2022.
Average Percentage Rate of Calculated Duties on U.S. Seafood Imports, 2025
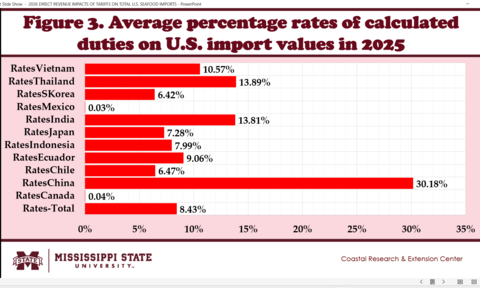
- In 2025, the average percentage rate of calculated duties on U.S. import values was 8.43% (Fig. 3).
- China levied an average rate of 30.18%.
- Thailand got an average rate of 13.89%.
- India received an average rate of 13.81%.
- Vietnam received an average rate of 10.57%.
- Ecuador imposed an average rate of 9.06%.
- Indonesia levied an average rate of 7.99%.
- Japan got an average rate of 7.28%.
- Chile got an average rate of 6.47%.
- South Korea received an average rate of 6.42%.
- Canada got an average rate of 0.04%.
- Mexico imposed an average rate of 0.03%.
Calculated Duties on U.S. Seafood Imports, 2018
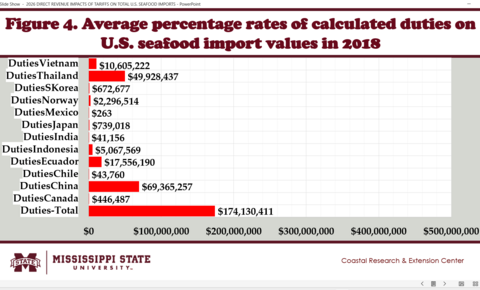
- In 2018, the total calculated duties imposed on all U.S. seafood imports reached $174.13 million (Figure 4).
- The bulk of duties collected from U.S. imports in 2018 was imposed on China, accounting for 39.84% of the total, or $69.36 million.
- U.S. seafood imports from Thailand accounted for 28.67% of total imports, or $49.92 million, in 2018.
- U.S. imports from Ecuador were subject to calculated duties amounting to 10.08% of the total, or $17.55 million, in 2018.
Calculated Duties on U.S. Seafood Imports, 2024
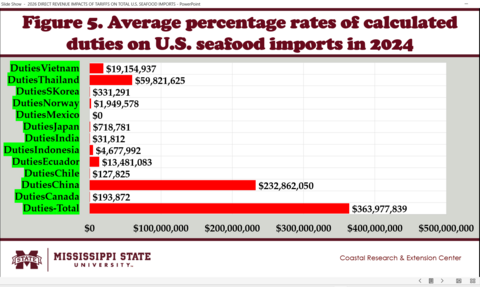
- In 2024, the total calculated duties imposed on all U.S. seafood imports reached $363.97 million (Fig. 5).
- The bulk of duties collected from U.S. imports in 2024 was imposed on China, accounting for 63.98% of the total, or $232.86 million.
- U.S. seafood imports from Thailand accounted for 16.44% of total imports, or $59.81 million, in 2024.
- U.S. imports from Vietnam were subject to calculated duties amounting to 5.26% of the total, or $19.14 million, in 2024.
Calculated Duties on U.S. Seafood Imports, 2025
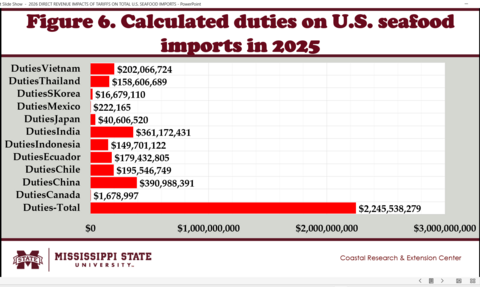
- In 2025, the total calculated duties imposed on all U.S. seafood imports reached $2.245 billion (Fig. 6).
- The bulk of duties collected from U.S. imports in 2025 was imposed on China, accounting for 17.41% of the total, or $390.98 million.
- U.S. imports from India were subject to calculated duties amounting to 16.18% of the total, or $361.17 million, in 2025.
- U.S. seafood imports from Vietnam accounted for 9.00% of the total, or $202.06 million, in 2025.
- U.S. seafood imports from Chile accounted for 8.71% of total imports, or $195.54 million, in 2025.
- U.S. seafood imports from Ecuador accounted for 7.99% of total imports, or $179.43 million, in 2025.
- U.S. imports from Thailand were subject to calculated duties amounting to 7.06% of the total, or $158.60 million, in 2025.
- U.S. seafood imports from Indonesia were levied with calculated duties amounting to 6.67% of the total, or $149.70 million, in 2025.
Summary, Limitations, and Implications
- The average rates of calculated duties on U.S. seafood imports were generally below 1% from 1989 to 2017.
- After the start of the US-China trade war in July 2018, the average rate of calculated duties on U.S. seafood imports rose to about 1.5%.
- In 2025, the average percentage rate of calculated duties on U.S. seafood imports was about 8.43%.
- The bulk of duties collected from U.S. imports in 2025 was imposed on China, accounting for 17.41% of the total, or $390.98 million.
- U.S. imports from India were subject to calculated duties amounting to 16.18% of the total, or $361.17 million, in 2025.
- U.S. seafood imports from Vietnam accounted for 9.00% of the total calculated duties, or $202.06 million, in 2025.
- U.S. seafood imports from Chile accounted for 8.71% of the total calculated duties, or $195.54 million, in 2025.
- U.S. seafood imports from Ecuador accounted for 7.99% of the total calculated duties, or $179.43 million, in 2025.
- U.S. imports from Thailand were subject to calculated duties amounting to 7.06% of the total, or $158.60 million, in 2025.
- U.S. seafood imports from Indonesia were levied with calculated duties amounting to 6.67% of the total, or $149.70 million, in 2025.
Acknowledgements
- This newsletter is a contribution of the Mississippi Agricultural and Forestry Experiment Station and the Mississippi State University Extension Service.
- This material is based on work supported in part by the National Institute of Food and Agriculture, U.S. Department of Agriculture, Hatch project under accession number 100004, and
- Mississippi-Alabama Sea Grant Consortium using federal funds under Grant NA24OARX417C0155-T1-01 from the National Sea Grant Office, NOAA, U.S. Dept. of Commerce.
- The statements, findings, conclusions, and recommendations are those of the author and do not necessarily reflect the views of the National Sea Grant Program, NOAA, U.S. Department of Commerce, or any official USDA or U.S. Government determination or policy.
Download

Vol. 16, No. 4 / Direct Revenue Impacts of Tariffs on U.S. Seafood Imports
1.02 MB