ABSTRACT
- This newsletter shows the long-term yearly U.S. seafood imports from 1972 to 2025.
- It highlights the top 10 countries of origin for U.S. seafood imports in 2018, 2024, and 2025.
KEYWORDS
- Seafood imports, countries of origin.
SUGGESTED CITATION
- Posadas, Benedict C. 2026. U.S. Seafood Imports and Major Countries of Origin. Vol. 16, No. 3. Mississippi State University Extension and Mississippi-Alabama Grant Publication MASGP-26-059-3. March 20, 2026.
METHODS
- Annual data on U.S. seafood imports are compiled from the NOAA Fisheries website from 1972 to 2025.
- The top 10 countries of origin for U.S. seafood imports in 2018, 2024, and 2025 were identified by total import values.
- Source of raw data
U.S. SEAFOOD IMPORT VALUES
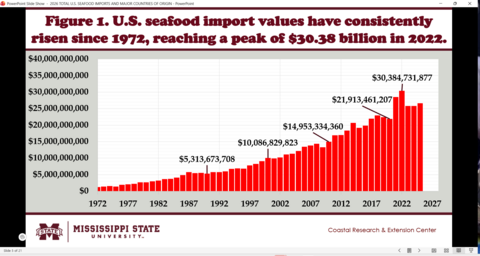
- Figure 1 shows the annual U.S. seafood import values from 1972 to 2025.
- Between 1972 and 1989, annual seafood imports were about $5 billion or less, doubling to more than $10 billion in 2000, and rose to almost $15 billion in 2010.
- After the U.S.-China trade war started in July 2018, annual U.S. seafood imports rose to $22.9 million in 2019 and reached a peak in 2022 at $30.38 billion.
- Between 2023 and 2025, annual U.S. seafood imports were above $25 billion.
U.S. SEAFOOD IMPORT VOLUMES
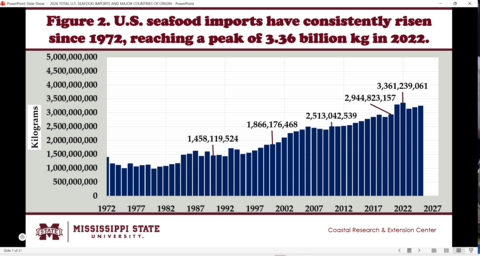
- Figure 2 shows the annual U.S. seafood imports from 1972 to 2025.
- Between 1972 and 1989, annual seafood imports were about 1.5 billion or fewer kilograms, rose to more than 1.86 billion kilograms in 2000, and rose to more than 2.51 billion kilograms in 2010.
- After the U.S.-China trade war started in July 2018, annual U.S. seafood imports rose to 2.85 billion kilograms in 2019 and reached a peak in 2022 at 3.36 billion kilograms.
- Between 2023 and 2025, annual U.S. seafood imports were about 3.20 billion kilograms.
COUNTRIES OF ORIGIN OF U.S. SEAFOOD IMPORT VALUES
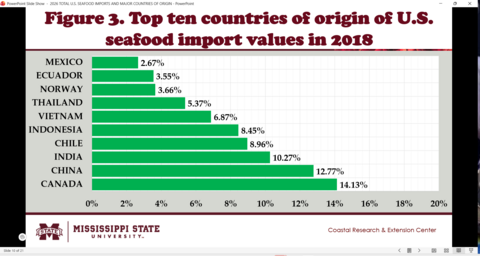
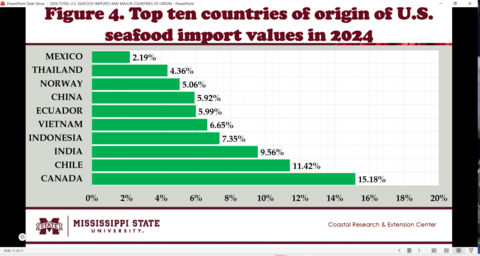
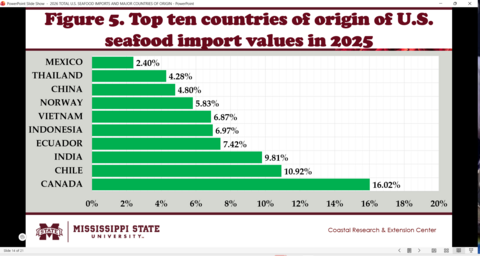
- Canada supplied the most imported seafood products - 14.13% or $3.28 billion in 2018,15.18% or $3.97 billion in 2024, and 16.02% or 4.26 billion in 2025.
- The share of China in U.S. seafood imports fell from 12.77% in 2018 ($2.96 billion) to 5.92% in 2024 ($1.54 billion) and 4.80% in 2025 ($1.278 billion).
- Chile ranked as the second-largest supplier of imported seafood products, rising from 8.96% or $2.05 billion in 2018 to 11.42% or $2.95 billion in 2024, and 10.92% or $2.90 billion in 2025.
- India remained the third major supplier of imported seafood products – 10.27% or $2.35 billion in 2018, 9.56% or $2.46 billion in 2024, and 9.81% or $2.61 billion in 2025.
- Indonesia rose to the 4th major supplier of imported seafood products – 8.45% or $1.93 billion in 2018, 7.35% or $1.89 billion in 2024 - but fell to 5th with 6.97% or $1.85 billion in 2025.
- Ecuador rose from the 9th-largest supplier of imported seafood products – 3.55% or $0.81 billion in 2018 - to 6th with 5.99% or $1.54 billion in 2024, and 4th with 7.42% or $1.97 billion in 2025.
- Norway also rose from the 8th-largest supplier of imported seafood products – 3.66% or $0.83 billion in 2018 - to 5.06% or $1.30 billion in 2024, and 5.83% or $1.55 billion in 2025.
- Vietnam supplied imported seafood products amounting to 6.87% or $1.57 billion in 2018, 6.65% or $1.71 billion in 2024, and 6.87% or $1.82 billion in 2025.
- Thailand supplied imported seafood products reaching 5.37% or $1.23 billion in 2018, to 2.36% or $1.12 billion in 2024, and 4.28% or $1.14 billion in 2025.
- Mexico was the 10th-largest country of origin in 2018, with 2.67% or $0.61 billion, and in 2024, with 2.19% or $0.56 billion, and in 2025, with 2.40% or $0.63 billion.
SUMMARY, LIMITATIONS, AND IMPLICATIONS
- U.S. seafood import values have consistently risen since 1972, reaching a peak of $30.38 billion in 2022.
- U.S. seafood import values have been rising since 1972, reaching a peak of 3.36 billion kg in 2022.
- The top five seafood suppliers to the U.S in 2025 are Canada, Chile, India, Ecuador, and Indonesia.
- The next five suppliers of seafood products to the U.S. are Vietnam, Norway, China, Thailand, and Mexico.
ACKNOWLEDGEMENTS
- This newsletter is a contribution of the Mississippi Agricultural and Forestry Experiment Station and the Mississippi State University Extension Service.
- This material is based on work supported in part by the National Institute of Food and Agriculture, U.S. Department of Agriculture, Hatch project under accession number 100004, and
- Mississippi-Alabama Sea Grant Consortium using federal funds under Grant NA24OARX417C0155-T1-01 from the National Sea Grant Office, NOAA, U.S. Dept. of Commerce.
- The statements, findings, conclusions, and recommendations are those of the author and do not necessarily reflect the views of the National Sea Grant Program, NOAA, U.S. Department of Commerce, or any official USDA or U.S. Government determination or policy.
Download

Vol. 16, No. 3 / U.S. Seafood Imports and Major Countries of Origin
965.69 KB