ABSTRACT
The average annual plant-gate values of selected processed fishery products in the US are compiled for the period 2020 to 2023. The total number of jobs, wages, salaries, and earnings of workers and owners of seafood processing businesses in the US is compiled for the period 2001 to 2025. The contributions of the Gulf of America region and the state of Mississippi to the number of jobs, wages, salaries, and earnings of workers and owners of seafood processing businesses are computed from 2020 to 2025. It also compares the socioeconomic characteristics of workers and owners in the US seafood processing industry in 2016, 2020, and 2024. The gross regional product of the US seafood processing industry was compiled from 2020 to 2025. The industry requirements for the Gulf of Mexico and Mississippi seafood processing industries were compiled in 2025.
KEYWORDS
Seafood processing, jobs, incomes, socioeconomic characteristics.
SUGGESTED CITATION
Posadas, Benedict C. 2026. Jobs, Incomes, and Socioeconomic Characteristics of the Seafood Processing Industry. Vol. 16, No. 1. Mississippi State University Extension and Mississippi-Alabama Grant Publication MASGP-26-058-1. February 17, 2026.
SEAFOOD PROCESSING
- Seafood product preparation and packaging comprise establishments primarily engaged in one or more of the following:
- canning seafood (including soup),
- smoking, salting, and drying seafood,
- eviscerating fresh fish by removing heads, fins, scales, bones, and entrails,
- shucking and packing fresh shellfish,
- processing marine fats and oils, and
- freezing seafood.
- Establishments known as "floating factory ships" that gather and process seafood into canned products are included in this industry.
- Source: US Bureau of Census
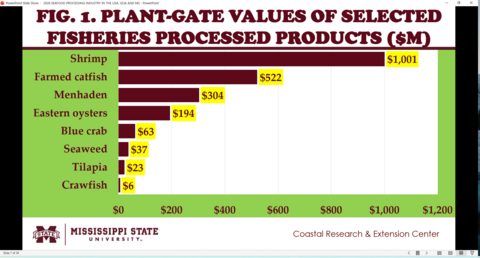
PLANT-GATE VALUES OF SELECTED FISHERIES PROCESSED PRODUCTS IN THE US
- Processed shrimp products – breaded and others - averaged $1 billion from 2020 to 2023.
- Farmed catfish products – dressed and others - added an average of $522 million during the past four years.
- Menhaden meal, oil, and others added $304 million since 2020.
- Processed oyster products – shucked, canned, and others averaged $194 million since 2020.
- Blue crab products averaged $63 million since 2020.
- Processed seaweed products averaged $37 million from 2020 to 2023.
- Tilapia fillets averaged $23 million during the last four years.
- Processed crawfish products have averaged $6 million since 2020.
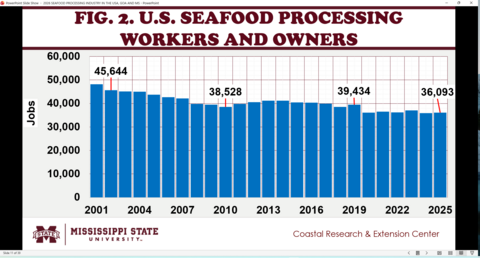
SEAFOOD PROCESSING WORKERS AND OWNERS
- Includes QCEW Employees, Non-QCEW Employees, Self-Employed, and Extended Proprietors. QCEW - Quarterly Census of Employment and Wages.
- The US seafood processing industry has directly provided about 36,000 jobs per year since 2020.
- The Gulf of America region (AL, FL, LA, MS, and TX) accounted for about 23.5 percent of all seafood processing jobs during the period.
- Mississippi added about 5.6 percent of all the seafood processing jobs since 2020.
- Recent NOAA Fisheries estimates of the total employment impacts of the US seafood processing industry, including seafood imports in 2023, reached over 118,000 jobs. This estimate includes the direct, indirect, and induced employment impacts.
- If seafood imports are excluded, however, recent NOAA Fisheries estimates of the total employment impacts of the US seafood processing industry in 2023 reached over 54,000 jobs. This estimate includes the direct, indirect, and induced employment impacts.
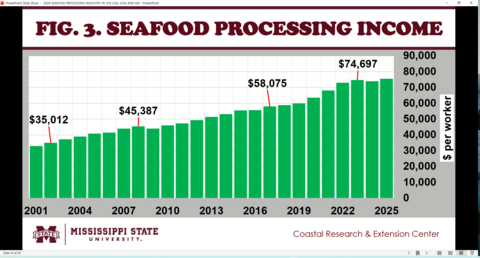
SEAFOOD PROCESSING INCOME
- Includes wages, salaries, supplements, and proprietor income of QCEW Employees, Non-QCEW Employees, Self-Employed, and Extended Proprietors. QCEW - Quarterly Census of Employment and Wages.
- The combined wages, salaries, and proprietor earnings of the US seafood processing industry averaged more than $71,000 per person since 2020.
- The annual pay of seafood processing workers and owners in the Gulf of America region averaged more than $45,000 per person, or 69.3 percent of the national average.
- Mississippi seafood processing workers and owners received an average of $43,000 since 2020, which is equivalent to 61.3 percent of the national average.
SOCIO-DEMOGRAPHIC CHARACTERISTICS OF WORKERS AND OWNERS
- Includes Gender, Race, and Age - sources of raw data: Lightcast (2016, 2021, 2026).
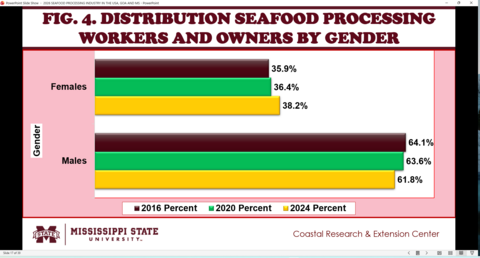
SEAFOOD PROCESSING WORKERS AND OWNERS BY GENDER
- The majority of workers and owners in US seafood processing businesses are male (Fig. 4).
- The percentage of males declined from 64.1% in 2016 to 63.6% in 2020 and 61.8% in 2024.
- The US seafood industry hired more females, from 35.9% in 2016 to 36.4% in 2020 and 38.2% in 2025.
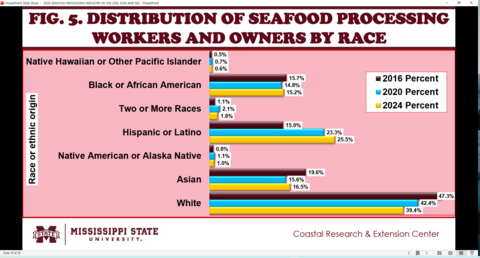
SEAFOOD PROCESSING WORKERS AND OWNERS BY RACE
- The proportion of Whites among US seafood processing workers and owners decreased from 47.3% in 2016 to 42.4% in 2020 and 39.4% in 2024.
- Hispanic workers and owners comprised 25.5% in 2024, from 23.3% in 2020, and 15.0% in 2016.
- Asian workers and owners fell from 19.6% in 2016 to 15.6% in 2020 and 16.5% in 2024.
- Black or African American workers and owners increased by 15.2% in 2024, from 14.8% in 2020 and 15.7% in 2016.
- The remaining workers and owners of the US seafood processing industry are shown in Fig. 5.
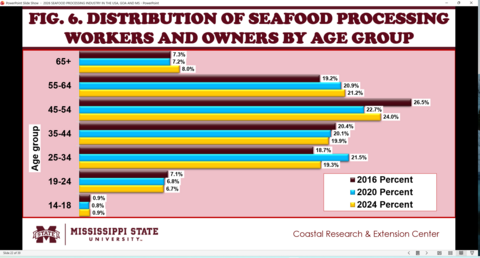
SEAFOOD PROCESSING WORKERS AND OWNERS BY AGE GROUP
- The 65 years old and above workers and owners comprised 7.3% in 2026, 7.2% in 2020, and 8.0% in 2024.
- One out of five workers and owners was 55-64 years old, about 19.2% in 2016, 20.9% in 2020, and 21.2% in 2024.
- The 45-54-year-old group increased by 26.5% in 2016, 22.7% in 2020, and 24.0% in 2024.
- The 35-44-year-old age group accounted for 20.4% in 2016, 20.1% in 2020, and 19.9% in 2024 of all US seafood processing workers and owners.
- The 25-34-year-old group accounted for 18.7% in 2016, 21.5% in 2020, and 19.3% in 2024 among all US seafood processing workers and owners.
- The youngest workers and owners comprised the rest of the workforce in the US seafood processing industry (Fig. 6).
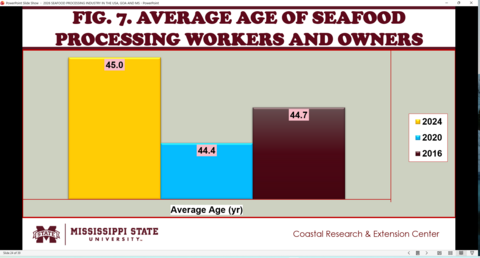
- US seafood processing workers and owners are slowly aging, from 44.7 years old in 2016 to 45.0 years old in 2024 (Fig. 7)
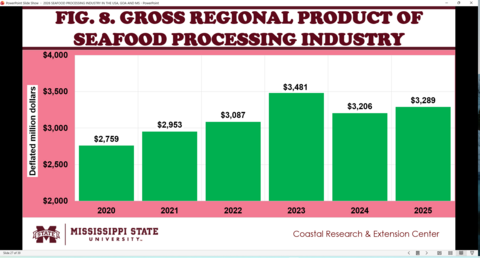
GROSS REGIONAL PRODUCT OF SEAFOOD PROCESSING INDUSTRY
- Measures the final market value of all goods and services produced in a region.
- Includes total industry earnings, profits (property income), and taxes on production and imports, less subsidies. Source of raw data: Lightcast (2026).
- The US seafood processing industry has slowly recovered from the impacts of the COVID-19 pandemic, which started in March 2020.
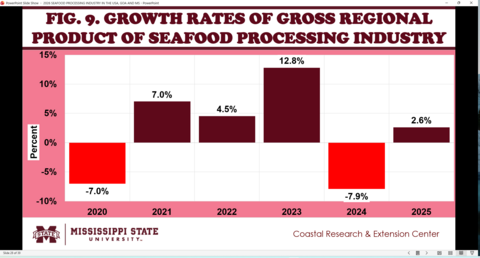
- Its gross regional product rose from $2.75 billion in 2020 to $3.48 billion in 2023, then fell slightly to $3.28 billion in 2025 (Fig. 8).
- However, the gross regional product of the US seafood processing industry shrank in 2020 (-7.0%) and in 2024 (-7.9%), as shown in Fig. 9.
- Recent NOAA Fisheries estimates of the total economic contribution of the US seafood processing industry in 2023, including seafood imports, reached $16.09 billion for sales impacts, $5.07 billion for income impacts, and $7.06 billion for value-added impacts.
- However, if seafood imports are excluded, recent NOAA Fisheries estimates of the total economic contribution of the US seafood processing industry in 2023 reached $7.45 billion for sales impacts, $2.35 billion for income impacts, and $3.26 billion for value-added impacts.
INDUSTRY REQUIREMENTS OF THE SEAFOOD PROCESSING INDUSTRY
- Summarizes an industry's supply chain by identifying its purchases from other industries and estimating if they are sourced locally or from outside the region—source of raw data: Lightcast (2026)
- Gulf of America region:
- Total demand in 2025—$2.37 billion
- Percent of purchases met in the region in 2025—70%
- Percent of purchases met by imports in 2025—30%
- Mississippi:
- Total demand in 2025—$108.67 million
- Percent of purchases met in the region in 2025—79%
- Percent of purchases met by imports in 2025—21%
SUMMARY, LIMITATIONS, AND IMPLICATIONS
- Processed shrimp products, breaded and others, averaged $1 billion from 2020 to 2023.
- Farmed catfish products, dressed and others,added an average of $522 million during the past four years.
- Menhaden meal, oil, and others have added $304 million since 2020.
- Processed oyster products, shucked, canned, and others, averaged $194 million since 2020.
- Blue crab products averaged $63 million since 2020.
- Processed seaweed products averaged $37 million from 2020 to 2023.
- Tilapia fillets averaged $23 million during the last four years.
- Processed crawfish products have averaged $6 million since 2020.
- The US seafood processing industry has directly provided about 36,000 jobs per year since 2020.
- The Gulf of America region and Mississippi accounted for 23.5% and 5.6% of all seafood processing jobs since 2020, respectively.
- The combined wages, salaries, and proprietor earnings of the US seafood processing industry averaged more than $71,000 per person since 2020.
- The annual income of seafood processing workers and owners in the Gulf of America region and in Mississippi is 69.3% and 61.3% of the national average, respectively.
- The majority of workers and owners in US seafood processing businesses are male, but the proportion declined from 2016 to 2024.
- The majority of the workers and owners in the US seafood processing industry are Whites, but the percentage declined from 2016 to 2024.
- US seafood processing workers and owners are slowly aging, from 44.7 years old in 2016 to 45.0 years old in 2024.
- The US seafood processing industry has slowly recovered from the impacts of the COVID-19 pandemic, which started in March 2020.
- The 2025 industry requirement of the seafood processing industry is met by imports in the Gulf of America region–30% and in the state of Mississippi–21%.
ACKNOWLEDGEMENT
- This newsletter is a contribution of the Mississippi Agricultural and Forestry Experiment Station and the Mississippi State University Extension Service.
- This material is based on work supported in part by the National Institute of Food and Agriculture, US Department of Agriculture, Hatch project under accession number 100004.
- Any opinions, findings, conclusions, or recommendations expressed in this publication are those of the author and should not be construed to represent any official USDA or US Government determination or policy.
MISSISSIPPI NEWSLETTERS SEAFOOD PROCESSING
- Mississippi MarketMaker. Vol. 15, No. 4 / The Demographic Profiles of US, Gulf States, and Mississippi Seafood Processing Workers and Owners. March 25, 2025.
- Mississippi MarketMaker. Vol. 14, No. 9 / Economic Contributions of Mississippi Seafood Processing. September 18, 2024
- Mississippi MarketMaker. Vol. 11, No. 5 / Number, Wages, Salaries, and Earnings, and Socioeconomic Characteristics of Seafood Processing Workers and Owners. May 11, 2021
- Mississippi MarketMaker. Vol. 10 No. 1 / Seafood Processing. January 21, 2020
- Mississippi MarketMaker. Vol. 7 No. 20 | Seafood Processing Employment and Incomes in the Gulf of Mexico and the United States. October 25, 2017
YOUTUBE VIDEOS ON SEAFOOD PROCESSING
- 2026-09 SEAFOOD PROCESSING INDUSTRY IN THE USA, GOA, AND MS
- 2025-06 THE CHANGING DEMOGRAPHIC PROFILES OF US GULF MS SEAFOOD PROCESSING
- 2024-19 ECONOMIC IMPACTS OF MISSISSIPPI SEAFOOD PROCESSING INDUSTRY
- 2023 US ATLANTIC SALMON PROCESSING INDUSTRY
- 2023 US OYSTER PROCESSING INDUSTRY
- 2023 TOTAL SUPPLY OF BREADED SHRIMP PRODUCTS
- More YouTube videos at Seafood Economics Outreach
Download

Vol. 16, No. 1 / Jobs, Incomes, and Socioeconomic Characteristics of the Seafood Processing Industry
1.86 MB
Authors
-
 Extension/Research Professor
- CREC-Coastal Research & Ext Center