Abstract
- This newsletter examines the monthly selected U.S. shrimp imports and calculated duties from January 2023 to January 2026.
- The average shrimp import prices are imputed from the values and volumes of selected shrimp imports.
- This newsletter explores the impacts on the imputed average prices of selected U.S. shrimp imports by calculated duties and selected economic factors.
Keywords
- Shrimp imports, calculated duties, and price impacts.
Suggested Citation
Posadas, Benedict C. 2026. Price Impacts of Tariffs on U.S. Imports of Farmed, Peeled, and Frozen Warmwater Shrimp. Vol. 16, No. 5. Mississippi State University Extension and Mississippi-Alabama Grant Publication MASGP-26-059-5. April 23, 2026. https://extension.msstate.edu/newsletters/mississippi-marketmaker.
Methods
- Monthly data on selected U.S. shrimp imports are compiled from the NOAA Fisheries website from January 2023 to January 2026.
- The calculated duties on selected U.S. shrimp imports are summarized monthly since January 2023.
- An econometric model is estimated to measure the impacts of calculated duties on the imputed average prices of selected U.S. shrimp products.
- Source of raw data: https://www.fisheries.noaa.gov/foss.
U.S. Seafood Trade Model
- The econometric model of the U.S. SEAFOOD TRADE assumes that import prices could be explained by:
- Year,
- Month,
- Average calculated duties (%),
- Volume of imports (kg),
- Other variables.
- Year,
- The Ordinary Least Squares (OLS) model of U.S. SEAFOOD TRADE consists of the following dependent variables:
- Deflated imputed average import price ($/kg).
- The OLS model of U.S. seafood trade is estimated using the robust variance procedure in Stata 19.
- The variation inflation factor is calculated to detect the possible presence of multicollinearity.
- The marginal impacts are computed using the margins procedure.
U.S. Imports of Farmed-Peeled-Frozen Warmwater Shrimp
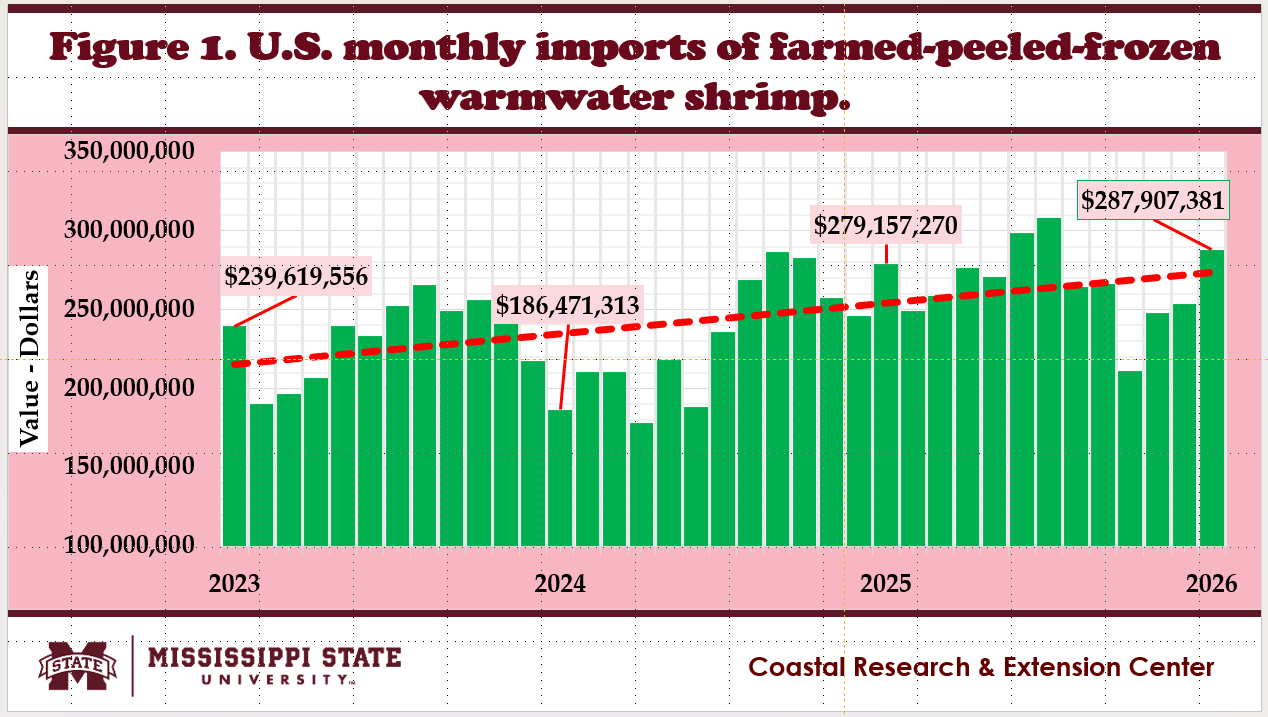
- Figure 1 shows the monthly U.S. farmed-peeled-frozen warmwater shrimp (MFPFWS) import values from January 2023 to January 2026.
- Overall, the average MFPFWS import values rose from $232.5 million in 2023 to $230.8 million in 2024 and to $267.1 million in 2025.
- Very large fluctuations in MFPFWS import values were observed, with averages of 10.5% in 2023, 16.4% in 2024, and 9.4% in 2025.
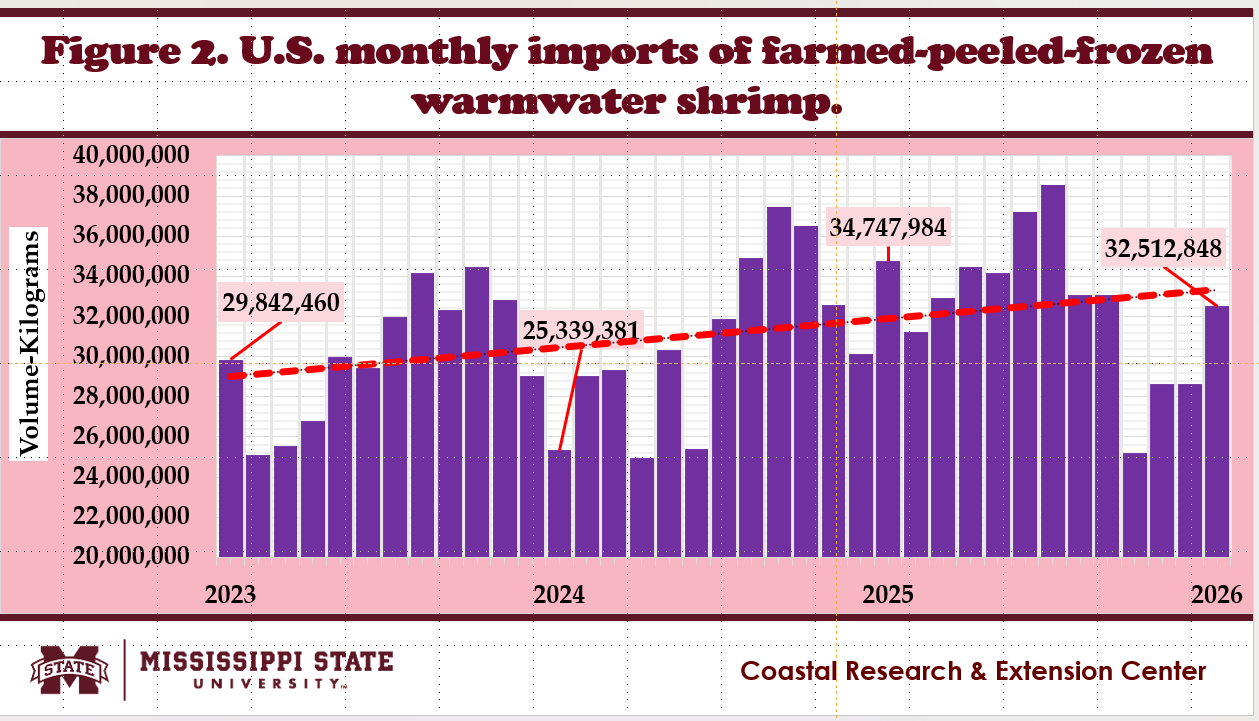
- Figure 2 shows the monthly U.S. farmed-peeled-frozen warmwater shrimp (MFPFWS) import volumes from January 2023 to January 2026.
- Overall, the average MFPFWS import volumes increased from 30.2 million kg in 2023 to 30.6 million kg in 2024 and to 32.6 million kg in 2025.
- Similarly, huge variations in MFPFWS import volumes were observed, averaging 10.5% in 2023, 13.8% in 2024, and 11.0% in 2025.
Calculated Duties on U.S. Imports of Farmed-Peeled-Frozen Warmwater Shrimp
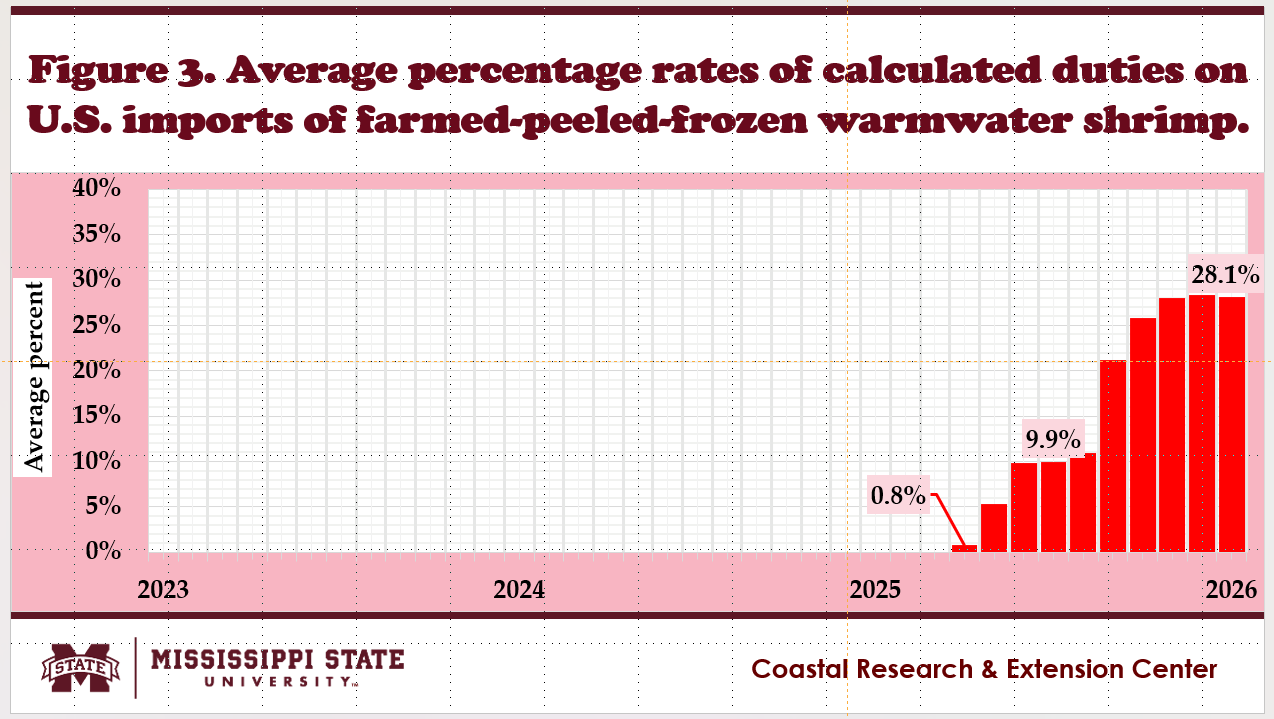
- Figure 3 shows the average rates of calculated duties on the monthly U.S. farmed-peeled-frozen warmwater shrimp (MFPFWS) import volumes from April to January 2026.
- No calculated duties were reported on U.S. MFPFWS imports before April 2025.
- The average rate of calculated duties on U.S. MFPFWS started at 0.8% in April 2025, rose to 9.9% in June 2025, and peaked at 28.4% in December 2025.
- In 2025, the average percentage rate of calculated duties on U.S. MFPFWS imports was 12.95% or $1.10 per kg.
Imputed-Average-Deflated Prices of U.S. Imports of Farmed-Peeled-Frozen Warmwater Shrimp
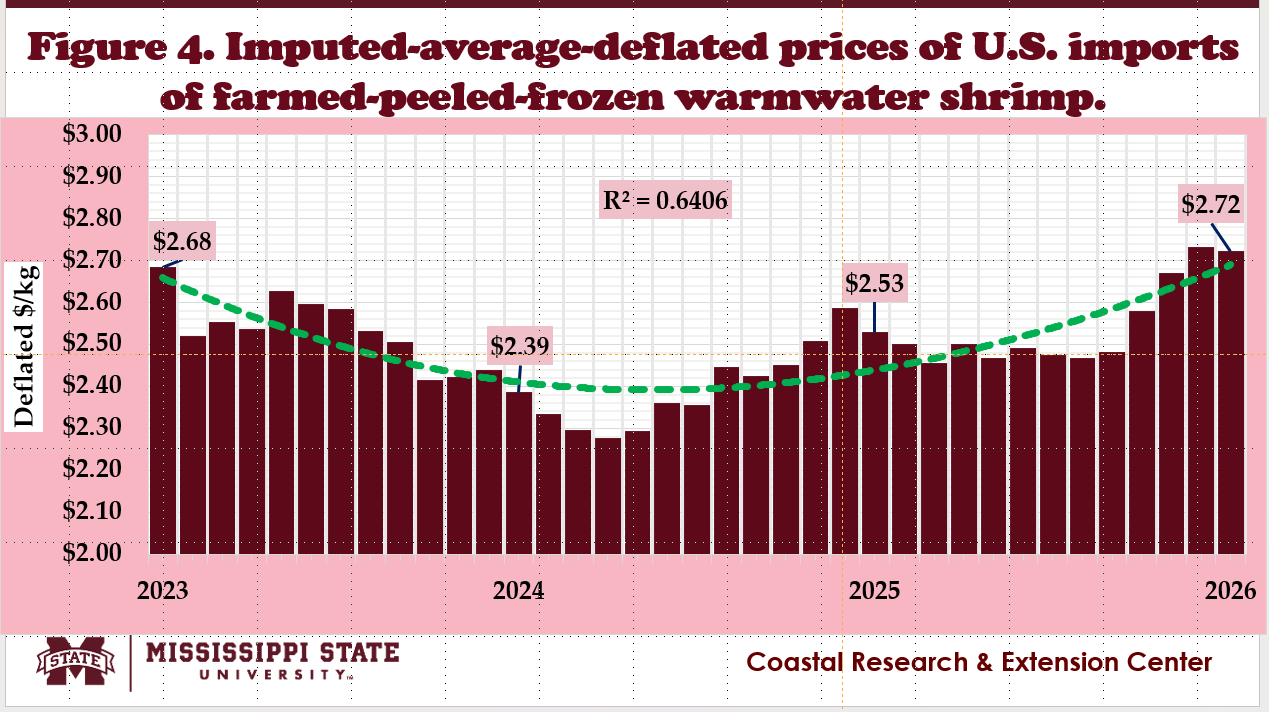
- Figure 4 shows the imputed-average-deflated prices of U.S. farmed-peeled-frozen warmwater shrimp (MFPFWS) imports since January 2023.
- In 2023, the imputed-average-deflated import prices averaged $2.53/kg, fell to $2.39/kg in 2024, and rose to $2.54/kg in 2025.
- Limited fluctuations in MFPFWS import prices were observed, averaging 3.3% in 2023, 3.9% in 2024, and 3.9% in 2025.
Imputed-Average-Deflated Prices and Calculated Duties of U.S. Imports of Farmed-Peeled-Frozen Warmwater Shrimp
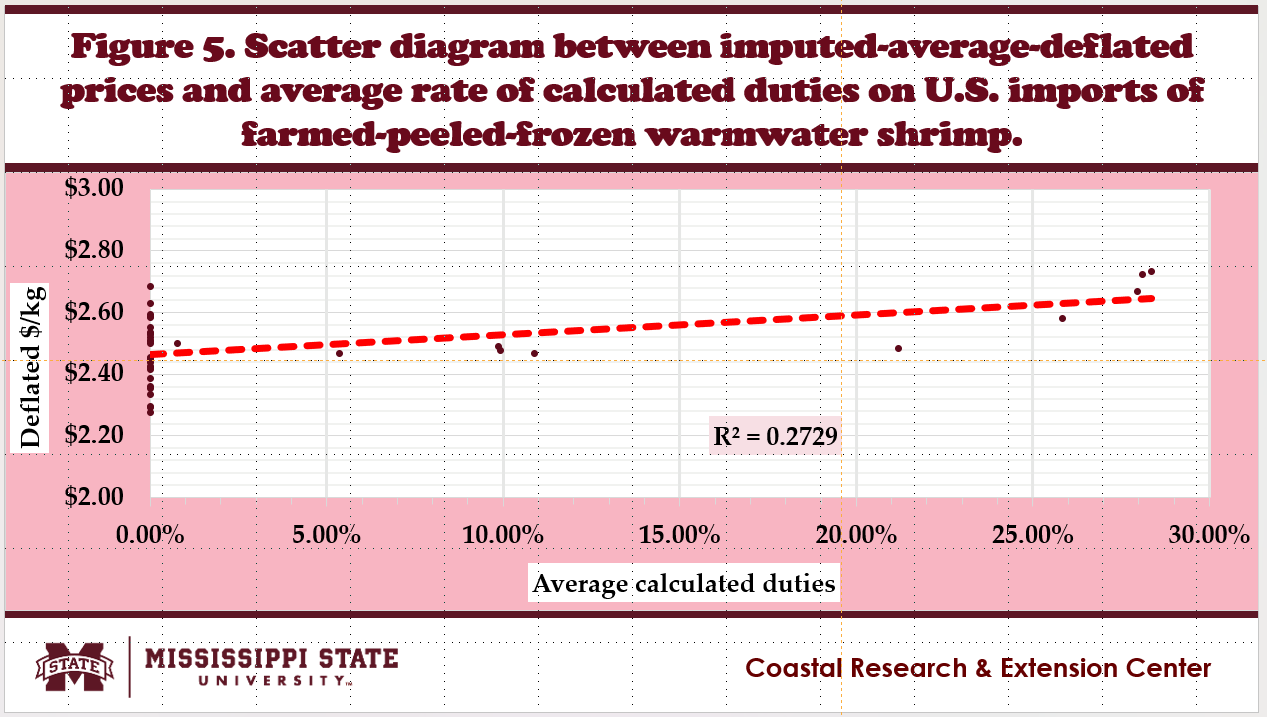
- Figure 5 shows the scatter diagram between the imputed-average-deflated prices and the average rate of calculated duties on U.S. MFPFWS imports.
- The graphical relationship indicates that the imputed-average-deflated prices rose at higher average rates of duty calculated for recent U.S. MFPFWS imports.
Imputed-Average-Deflated Prices and Volume of U.S. Imports of Farmed-Peeled-Frozen Warmwater Shrimp
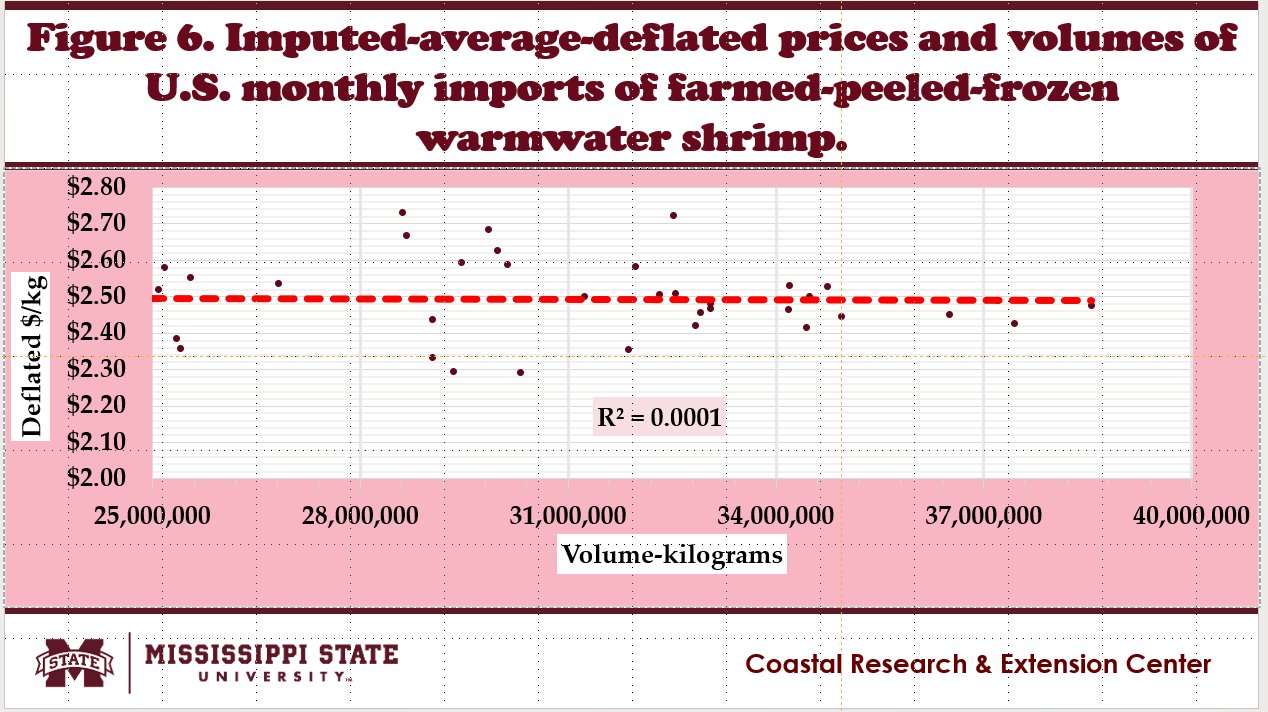
- Figure 6 shows the scatter diagram between the imputed-average-deflated prices and volume of U.S. MFPFWS imports.
- The graphical relationship indicates that the imputed-average-deflated import prices did not respond to higher volumes of U.S. MFPFWS imports.
Direct Impacts on Imputed Average Deflated Prices of U.S. Farmed-Peeled-Frozen Warmwater Shrimp
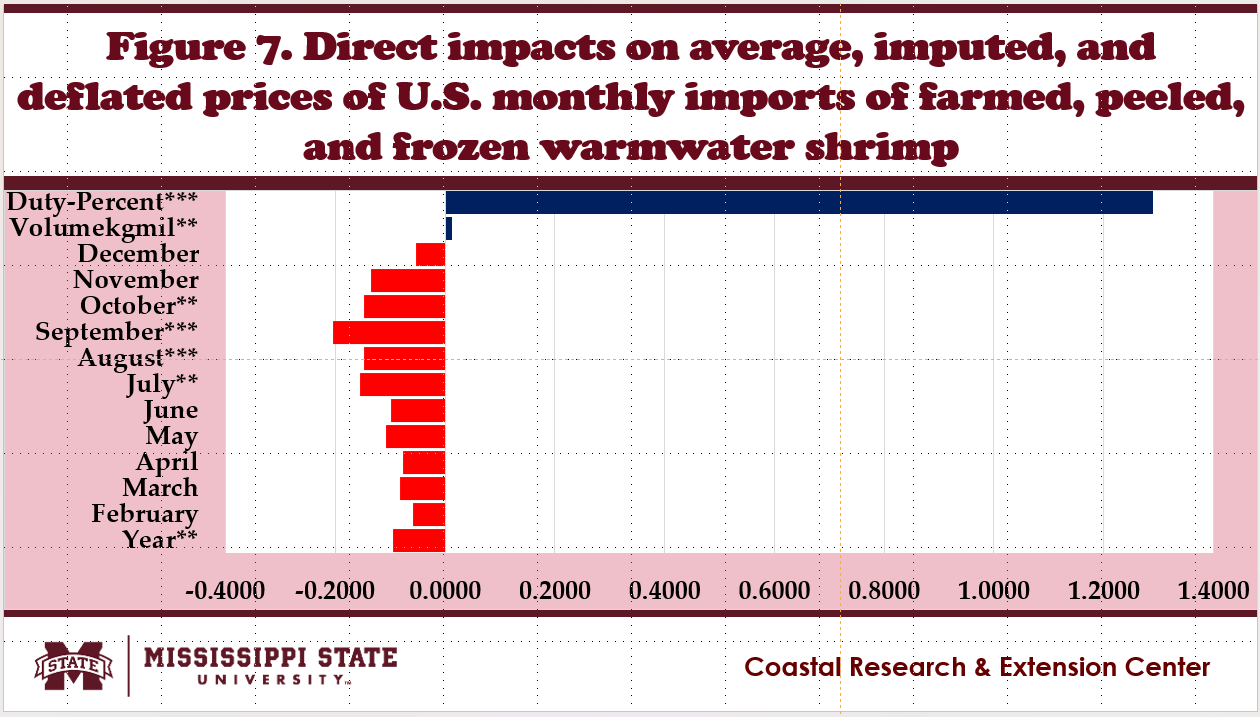
- Figure 7 shows the results of the econometric model on imputed-average-deflated prices of U.S. MFPFWS imports.
- Imputed-average-deflated prices of U.S. MFPFWS imports significantly decreased over time.
- Imputed-average-deflated prices of U.S. MFPFWS imports are significantly higher at higher average rates of calculated duties.
- Imputed-average-deflated prices significantly rose at higher volumes of U.S. MFPFWS imports.
- Lower imputed-average-deflated prices for U.S. MFPFWS imports were observed in October, September, August, and July.
Summary, Limitations, and Implications
- Over time, imputed-average-deflated prices of U.S. MFPFWS imports fell.
- Lower imputed-average-deflated prices for U.S. MFPFWS imports were observed in October, September, August, and July.
- Expansion in the volume of U.S. MFPFWS imports led to higher imputed-average-deflated prices.
- Higher average rates of calculated duties drove the imputed-average-deflated prices of U.S. MFPFWS imports to increase.
Acknowledgements
- This newsletter is a contribution of the Mississippi Agricultural and Forestry Experiment Station and the Mississippi State University Extension Service.
- This material is based on work supported in part by the National Institute of Food and Agriculture, U.S. Department of Agriculture, Hatch project under accession number 100004, and
- The Mississippi-Alabama Sea Grant Consortium, National Oceanic and Atmospheric Administration, U.S. Department of Commerce, and the states of Alabama and Mississippi. Federal grant number NA24OARX417C0155-T1-01.
- The statements, findings, conclusions, and recommendations are those of the authors and do not necessarily reflect the views of any of these funders.
Download

Price Impacts of Tariffs on U.S. Imports of Farmed, Peeled, and Frozen Warmwater Shrimp
1.06 MB
Filed Under
Authors
-
 Extension/Research Professor
- CREC-Coastal Research & Ext Center