ABSTRACT
- Data reported by NOAA Fisheries showed that the U.S. has imported salmon products since 1972. Calculated duties on salmon imports started in 1989.
- This newsletter examines the revenue impacts of tariffs and identifies the types of U.S. salmon imports since 1989.
- It shows the long-term annual U.S. salmon imports, the major countries of origin, and the types of U.S. salmon imports.
- It also summarizes the annually calculated duties on salmon imports and their impacts on import prices.
KEYWORDS
- Salmon imports, calculated duties, and major countries of origin.
SUGGESTED CITATION
Posadas, Benedict C. 2025. Tariffs on U.S. Salmon Imports: Direct Revenues and Price Impacts. Vol. 15, No. 10. Mississippi State University Extension and Mississippi-Alabama Sea Grant Publication MASGP-25-058-10. October 22, 2025. Mississippi Markets Newsletter.
U.S. PER CAPITA SALMON CONSUMPTION
AI Overview
- In 2022, U.S. per capita salmon consumption was an estimated 3.22 pounds, making it the second most consumed fish after shrimp.
- This figure comes from the National Fisheries Institute and represents an increase from previous years, likely driven by health trends and the availability of convenient options like ready-to-cook salmon.
METHODS
- The direct revenue impacts of U.S. salmon imports are the sum of the calculated duties imposed on imported salmon products.
- Annual data on U.S. salmon imports are compiled from the NOAA Fisheries website from January 1972 to July 2025.
- The annual duties calculated on salmon imports are compiled by primary type of salmon product and country of origin.
- An econometric model is estimated to measure the impacts of calculated duties on deflated imputed prices of U.S. salmon imports.
- Source of raw data: https://www.fisheries.noaa.gov/foss.
- The econometric model of U.S. SALMON IMPORT PRICE ($/lb) assumes that the deflated imputed average import price could be explained by:
- Year,
- Calculated duty (%),
- Country of origin (46 countries),
- Product type (37 products),
- Quantity of imports,
- Other variables.
- The Ordinary Least Squares (OLS) model of U.S. SALMON IMPORT PRICE consists of the following dependent variable:
- Deflated imputed average import price ($/lb).
- The OLS model of U.S. salmon import price is estimated by using the robust variance procedure of STATA-19.
- The variation inflation factor is calculated to detect the possible presence of multicollinearity.
- The marginal impacts are computed using the margins procedure.
TOTAL U.S. SALMON IMPORT VALUES
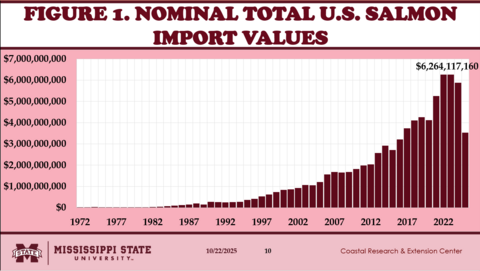
- The total U.S. salmon import values since 1972 are shown in Figure 1.
- Import values consistently rose from 1972, reaching their peak in 2023 at $6.264 billion.
- The total import value from January to July 2025 reached $3.528 billion.
COUNTRIES OF ORIGIN OF U.S. SALMON IMPORT VALUES
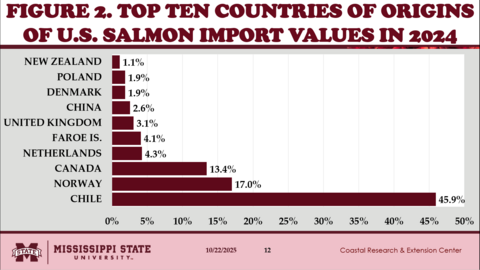
- Figure 2 shows the major countries of origin of total U.S. salmon imports in 2024.
- Chile supplied 49.5% of U.S. salmon imports in 2024.
- Norway provided 17.0% of U.S. salmon imports in 2024.
- Canada sold 13.4% of U.S. salmon imports in 2024.
- The Netherlands provided 4.3% of U.S. salmon imports in 2024.
- The Faroe Islands sold 4.1% of U.S. salmon imports in 2024.
- The United Kingdom shipped 3.1% of U.S. salmon imports in 2024.
- China (2.6%), Denmark (1.9%), Poland (1.9%), and New Zealand supplied some of the U.S. salmon imports in 2024.
MAJOR TYPES OF PRODUCTS OF U.S. SALMON IMPORT VALUES
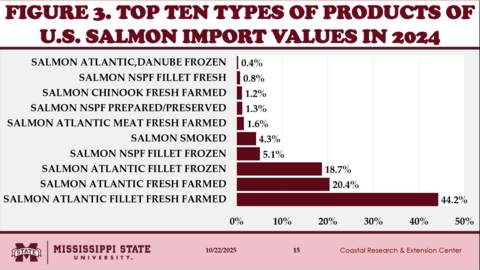
- Figure 3 shows the significant products of U.S. salmon imports in 2024.
- Fresh farmed Atlantic salmon fillets accounted for 44.2% of U.S. salmon import values in 2024.
- Fresh farmed Atlantic salmon added 20.4% of U.S. salmon import values in 2024.
- Frozen Atlantic salmon fillets accounted for 18.7% of U.S. salmon import values in 2024.
- Frozen salmon NSPF fillets added 5.1% of U.S. salmon import values in 2024.
- Smoked salmon accounted for 4.3% of U.S. salmon import values in 2024.
- Fresh farmed Atlantic salmon meat added 1.6% to U.S. salmon import values in 2024.
- Other types of U.S. salmon imports included the following:
- Prepared/Preserved salmon NSPF,
- Fresh, farmed Chinook salmon,
- Fresh salmon fillet NSPF, and Frozen Danube Atlantic salmon.
CALCULATED DUTIES ON U.S. SALMON IMPORTS
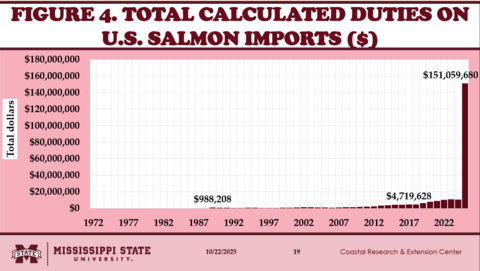
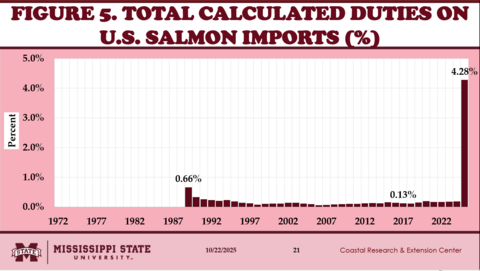
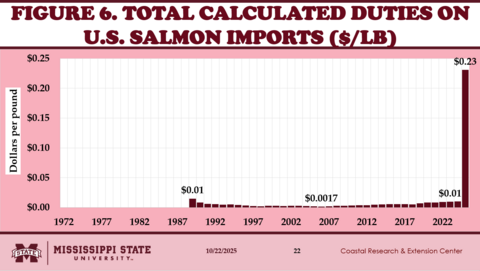
- Figures 4-6 show the calculated duties (total, percentage, and average) on the total U.S. salmon imports since 1989.
- In 1989, the total calculated duties reached $988,208, rose to $4.719 million in 2017, and $151.059 million during the first half of 2025 (Fig. 4).
- Initially, the average calculated duties were 0.66% in 1989, fell to 0.13% in 2017, and surged to 4.28% during the first half of 2025 (Fig. 5).
- Calculated duties averaged $0.01 per pound in 1989, fell to $0.0017 per pound in 2017, and rose to $0.23 per pound during the first half of 2025 (Fig. 6).
- The average calculated duties on U.S. salmon imports during the past three years continuously increased to $0.0098 in 2023, $0.0101 in 2024, and $0.2309 per pound in 2025.
CALCULATED DUTIES ON U.S. SALMON IMPORTS FROM TOP TEN COUNTRIES OF ORIGIN
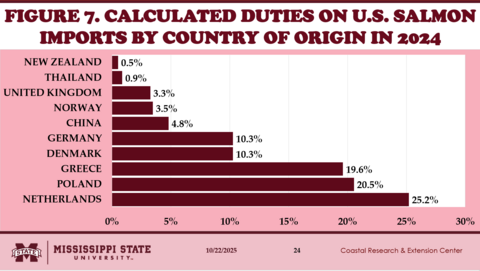
- Figure 7 shows the total calculated duties from the top ten countries of origin in 2024.
- Salmon imports from the Netherlands were imposed an average of 25.2% calculated duties in 2024.
- Salmon imports from Poland were subjected to an average of 20.5% calculated duties in 2024.
- An average of 19.6% calculated duties in 2024 was levied on Salmon imports from Greece.
- Salmon imports from Denmark and Germany were imposed an average calculated duty of 10.3% in 2024.
CALCULATED DUTIES ON U.S. SALMON IMPORTS BY PRODUCT TYPE
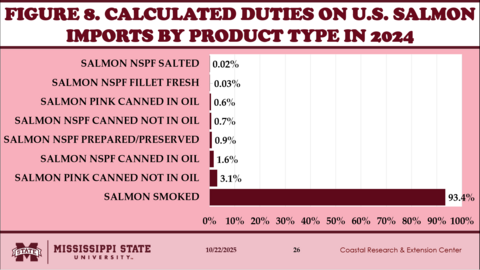
- Figure 8 shows the total calculated duties by major products of U.S. salmon imports in 2024.
- Smoked salmon accounted for 93.4% of the total calculated duties on U.S. salmon imports in 2024.
- Canned Pink salmon, not in oil, accounted for 3.1% of the total calculated duties on U.S. salmon imports in 2024.
- Canned Salmon NSPF in oil accounted for 1.6% of the total calculated duties on U.S. salmon imports in 2024.
IMPUTED PRICES OF U.S. SALMON IMPORTS
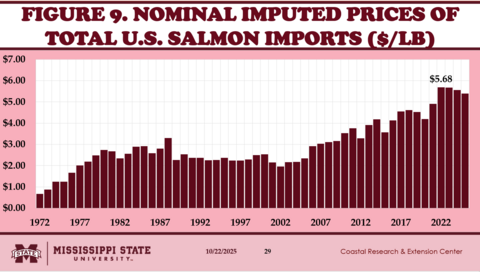
- Figure 9 shows the nominal imputed average prices of U.S. salmon imports since 1972.
- Since 1972, the nominal import prices have continued to rise, fluctuating between $2.00 and $3.00 per pound from 1977 to 2007.
- Since then, it rose, reaching its peak in 2022 at $5.68 per pound.
- The imputed average prices of U.S. salmon imports, however, fell from 2023 to 2025 in both nominal and deflated terms.
- The imputed average prices of U.S. salmon imports continuously fell to:
- $5.67 per pound in 2023,
- $5.56 per pound in 2024, and
- $5.39 per pound in 2025.
RESULTS OF THE ECONOMETRIC MODEL ON DEFLATED IMPUTED AVERAGE PRICES OF U.S. SALMON IMPORTS
- In 2024, the total U.S. salmon imports reached $5.88 billion. The total calculated duties were $10.71 million, with an average calculated duty of 0.84% and $0.06 per pound of salmon imports.
- During the first six months of 2025, the total U.S. salmon imports reached $3.52 billion, the total calculated duties were $151.05 million, and the average calculated duties were 5.28% and $0.33 per pound of salmon imports.
- Econometric results showed that higher calculated duties led to significantly lower deflated average imputed prices of U.S. salmon imports.
- Significantly lower average imputed prices of the following U.S. salmon imports were observed on:
- Fresh farmed Atlantic salmon,
- Fresh wild Atlantic salmon,
- Fresh Atlantic salmon, Danube,
- Fresh farmed Coho salmon, and
- Fresh Pink salmon.
- Significantly higher average imputed prices of the following U.S. salmon imports were observed on:
- Fresh wild Chinook salmon, Danube,
- Frozen Chinook salmon,
- Canned salmon NSPF in oil,
- Prepared/Preserved Salmon NSPF,
- Canned Pink salmon in oil, and
- Smoked salmon.
SUMMARY, LIMITATIONS, AND IMPLICATIONS
- Import values consistently rose from 1972, reaching their peak in 2023 at $6.264 billion. The total import value from January to July 2025 reached $3.528 billion.
- Chile supplied 49.5% of U.S. salmon imports in 2024. Norway provided 17.0% of U.S. salmon imports in 2024. Canada sold 13.4% of U.S. salmon imports in 2024. The Netherlands provided 4.3% of U.S. salmon imports in 2024. The Faroe Islands sold 4.1% of U.S. salmon imports in 2024. The United Kingdom shipped 3.1% of U.S. salmon imports in 2024.
- Fresh farmed Atlantic salmon fillets accounted for 44.2% of U.S. salmon import values in 2024. Fresh farmed Atlantic salmon added 20.4% of U.S. salmon import values in 2024. Frozen Atlantic salmon fillets added 18.7% of U.S. salmon import values in 2024. Frozen salmon NSPF fillets added 5.1% of U.S. salmon import values in 2024. Smoked salmon accounted for 4.3% of U.S. salmon import values in 2024. Fresh farmed Atlantic salmon meat added 1.6% to U.S. salmon import values in 2024.
- In 1989, the total calculated duties reached $988,208, rose to $4.719 million in 2017, and $151.059 million during the first half of 2025. Initially, the average calculated duties were 0.66% in 1989, fell to 0.13% in 2017, and surged to 4.28% during the first half of 2025. Calculated duties averaged $0.01 per pound in 1989, fell to $0.0017 per pound in 2017, and rose to $0.23 per pound during the first half of 2025. The average calculated duties on U.S. salmon imports during the past three years continuously increased to $0.0098 in 2023, $0.0101 in 2024, and $0.2309 per pound in 2025.
- Salmon imports from the Netherlands were imposed an average of 25.2% calculated duties in 2024. Salmon imports from Poland were subjected to an average of 20.5% calculated duties in 2024. An average of 19.6% calculated duties in 2024 was levied on Salmon imports from Greece. Salmon imports from Denmark and Germany were subject to an average calculated duty of 10.3% in 2024.
- Smoked salmon accounted for 93.4% of the total calculated duties on U.S. salmon imports in 2024. Canned Pink salmon, not in oil, accounted for 3.1% of the total calculated duties on U.S. salmon imports in 2024. Canned Salmon NSPF in oil accounted for 1.6% of the total calculated duties on U.S. salmon imports in 2024.
- Since 1972, the nominal import prices have continued to rise, fluctuating between $2.00 and $3.00 per pound from 1977 to 2007. Since then, they rose, reaching their peak in 2022 at $5.68 per pound. The imputed average prices of U.S. salmon imports, however, fell from 2023 to 2025 in both nominal and deflated terms. The imputed average prices of U.S. salmon imports continuously fell to $5.67 per pound in 2023, $5.56 per pound in 2024, and $5.39 per pound in 2025.
ACKNOWLEDGEMENT
- This newsletter is a contribution of the Mississippi Agricultural and Forestry Experiment Station and the Mississippi State University Extension Service. This material is based upon work supported in part by the National Institute of Food and Agriculture, U.S. Department of Agriculture, Hatch project under accession number 100004. Any opinions, findings, conclusions, or recommendations expressed in this publication are those of the author. They should not be construed to represent any official USDA or U.S. Government determination or policy.
- This work was supported in part by the Mississippi-Alabama Sea Grant Consortium, National Oceanic and Atmospheric Administration, U.S. Department of Commerce, and the states of Alabama and Mississippi—federal grant number NA24OARX417C0155-T1-01. The statements, findings, conclusions, and recommendations are those of the authors and do not necessarily reflect the views of any of these funders.
ADDITIONAL MATERIAL
Posadas, Benedict C. 2025. Tariffs on U.S. Salmon Imports: Direct Revenues and Price Impacts. Informational virtual presentation. Horticulture and Marine Economics Outreach, Vol. 2025, No. 35. Mississippi State University, Coastal Research and Extension Center, Biloxi, MS. https://youtu.be/frSjAGPLoA0.
Download

Vol. 15, No. 10 / Tariffs on U.S. Salmon Imports: Direct Revenues and Price Impacts
1.41 MB
Authors
-
 Extension/Research Professor
- CREC-Coastal Research & Ext Center