P3011
Water: Availability and Use
Water Availability: A Global View
Water covers about 71 percent of Earth’s surface, but about 97 percent of Earth’s water is saltwater. Of the roughly 3 percent that is freshwater, almost all is stored in ice, glaciers, and groundwater. Rivers and lakes—the sources people can see most easily—hold less than one-half of 1 percent of all water on Earth.
Water availability means the amount of water that is physically accessible and the suitability of that water for its intended use. Both quantity and quality can change over time because of natural events, human activities, land use, and changing demand. Water availability also depends on the wells, reservoirs, treatment systems, pipes, canals, and other infrastructure needed to reach and deliver it.
Water scarcity occurs when the usable supply cannot meet the needs of people, farms, businesses, and ecosystems. Physical scarcity can develop where supplies are naturally limited, vary by season, or decline because withdrawals exceed replenishment. Economic scarcity occurs when water exists but inadequate infrastructure, institutions, or financial resources limit access to it. In either case, changes in demand, drought, water quality, and climate can alter how much water is available.
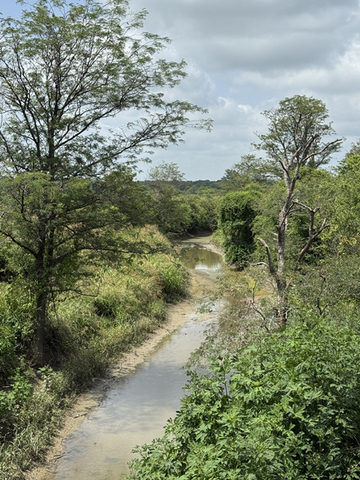
The same basic questions about water apply at every scale: How much usable water is available? When and where is it available? How much is being removed, and how much returns to the local environment?
Water Use in the United States
Water demand and use in the United States come from several sectors, including crop irrigation, thermoelectric power generation, public supply, industry, aquaculture, mining, livestock, and homes with their own wells. Two measurements help explain how these uses affect water availability.
A water withdrawal is water removed from a groundwater or surface-water source for a particular use. Consumptive use is the part of that withdrawal that evaporates, is taken up by plants, becomes part of a product, is consumed by people or livestock, or is otherwise removed from the immediate water system. The remainder may return to a river, lake, or aquifer, although its temperature or quality may have changed.
The U.S. Geological Survey (USGS) now estimates crop irrigation, thermoelectric power, and public supply using monthly watershed-scale models. The current national analysis covers water years 2010–2020. These three modeled categories account for most U.S. withdrawals, but they do not include every water-use category reported in earlier comprehensive inventories.
National totals also conceal strong regional patterns. Crop irrigation dominates withdrawals across much of the West, while thermoelectric power is the largest use in much of the East. The balance between groundwater and surface water also varies with local supplies and the purpose for which the water is used. Mississippi follows its own pattern, shaped by abundant surface water, productive aquifers, industry, and the irrigation needs of agriculture.
Water Use in Mississippi
Mississippi relies on both surface water and groundwater. Rainfall replenishes streams, rivers, lakes, and reservoirs, and some water moves through soil and geologic layers to recharge aquifers. An aquifer is a layer of sand, gravel, or rock that stores and transmits enough groundwater to supply wells. Groundwater and streams can also exchange water over time. Pumping near a stream can reduce groundwater discharge to the stream or draw stream water toward the aquifer, while high river stages can help recharge groundwater where local conditions allow.
The most complete statewide water-use inventory covers 2015 (refer to Figure 2). That year, withdrawals in Mississippi averaged about 2.69 billion gallons per day. Nearly all of the water was fresh, and about 84 percent came from groundwater.
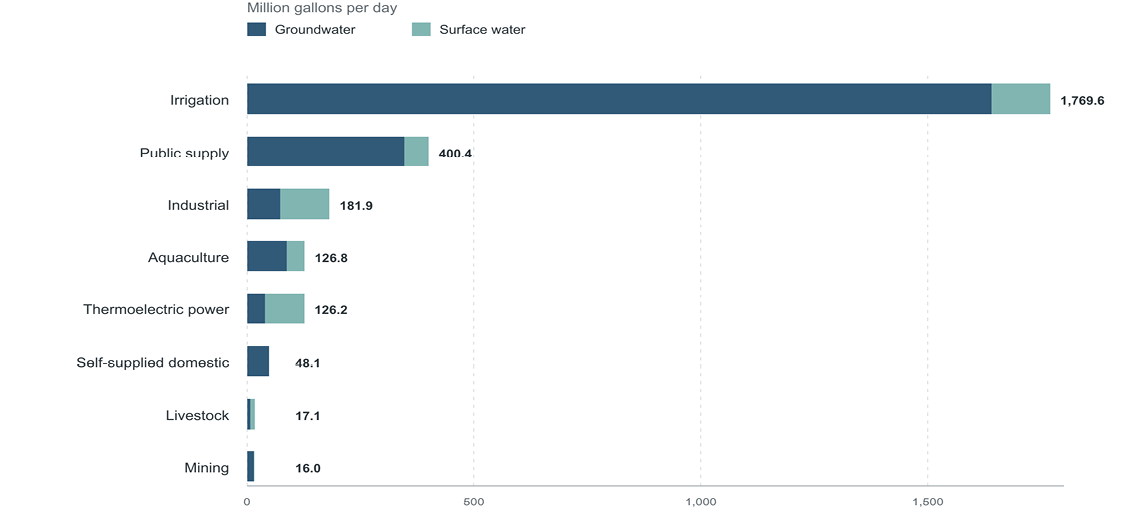
Irrigation was the largest use, accounting for about 1.77 billion gallons per day, or 66 percent of the statewide total. About 93 percent of irrigation withdrawals came from groundwater. Public supply was the second-largest category at about 400 million gallons per day, followed by self-supplied industry at about 182 million gallons per day. Aquaculture and thermoelectric power each accounted for about 126 million gallons per day. Smaller amounts supported homes with private wells, livestock, and mining.
The mix of water sources varies by use. Groundwater supplied about 87 percent of public-supply withdrawals and all reported withdrawals for homes with private wells. Industry and thermoelectric power relied more heavily on surface water. These differences matter because a large river and a heavily pumped aquifer respond differently to withdrawals, drought, and seasonal demand.
Emerging industrial uses, including data centers, can create new local water demands and classification questions. Depending on the source, their withdrawals may appear under public supply or self-supplied industry rather than as a separate category.
Water use is also concentrated geographically. Much of Mississippi’s irrigation occurs in the Delta, where producers depend heavily on the Mississippi River Valley alluvial aquifer. Statewide totals can therefore mask pressure on a particular water source. Conditions in the Delta show how abundant water resources and localized groundwater decline can exist within the same state.
The Mississippi Delta Region: A Closer Look
Mississippi’s Delta region is the broad, flat floodplain in the northwestern part of the state. It lies within the much larger Mississippi Alluvial Plain, which extends into portions of seven states. Beneath the Mississippi Delta, layers of sand and gravel form the Mississippi River Valley alluvial aquifer. The aquifer can supply large volumes of water to wells and has helped make irrigated production of soybeans, corn, cotton, rice, and other crops possible across the region.
Most irrigation water pumped in the Delta comes from this aquifer. Some of that water is replenished as rainfall, rivers, and streams recharge the groundwater system, but replenishment varies by place and season. During a dry growing season, crop demand and pumping can increase at the same time that recharge is limited. Where withdrawals repeatedly exceed replenishment, groundwater levels decline.
The Yazoo Mississippi Delta Joint Water Management District has measured groundwater levels across the region for more than four decades. A preliminary analysis of measurements from roughly 450 to 500 monitoring sites found that average groundwater levels declined across about 65 percent of the Delta between 1981 and 2023. About 10 percent of the region experienced an average decline of at least one-half foot per year. The greatest long-term declines have been concentrated in the central Delta.
Groundwater levels do not fall at the same rate every year. Wet growing seasons can reduce irrigation demand, while rainfall outside the growing season and high river stages can increase recharge. These conditions, along with growing adoption of conservation practices and irrigation efficiency techniques, contributed to stable or rising water levels in parts of the Delta during several recent years. A short-term rise, however, does not by itself mean that the aquifer has recovered from its long-term decline.
Groundwater and surface water are also connected. When groundwater levels fall, streams may supply more water to the aquifer and receive less groundwater as baseflow. This interaction can reduce streamflow during dry periods and shows why the condition of the aquifer cannot be considered separately from the Delta’s rivers and streams.
Continued monitoring and improved groundwater models help water managers distinguish seasonal changes from long-term trends and evaluate how pumping and recharge affect different parts of the Delta. Maintaining irrigation and a dependable water supply over time will require continued conservation efforts, greater irrigation efficiency, and coordinated management of groundwater and surface water.
Water Availability Includes Water Quality
Water is available for use only when its quality is suitable for that use. Drinking water, irrigation water, industrial process water, and aquatic habitat each have their own water quality standards. Water that can support one purpose may require treatment before it can serve another.
Surface water and groundwater face different pathways of contamination. Runoff can carry soil, nutrients, microorganisms, and chemicals into streams, lakes, and reservoirs. Materials spilled or applied at the land surface may also move through the soil and reach groundwater. Some groundwater contains naturally occurring minerals or other constituents that affect taste, staining, treatment needs, or suitability for a particular crop or industrial process.
Water quantity and quality also influence each other. Lower streamflow can leave less water available to dilute some contaminants. Pumping can change how groundwater moves and, in some settings, draw water with different chemistry, such as more mineralized or saline water, toward a well. Treatment can make a source usable, but additional treatment requires infrastructure, energy, maintenance, and financial resources. Protecting a source before its quality declines is often more practical than relying on treatment alone.
Public water systems monitor and treat water under drinking-water requirements. Owners of private wells are responsible for the safety of their household water and should maintain the well and arrange appropriate testing. Farms, industries, communities, and households can help protect water sources through careful storage and handling of fuels, fertilizers, pesticides, waste, and other potential contaminants. Local conditions and the intended water use should guide testing and treatment decisions.
Conserving Water at Multiple Scales
Water conservation works best when the response matches the scale and source of use. In Mississippi, that means giving particular attention to irrigation in the Delta while also improving public systems, industrial processes, and everyday water use across the state. On farms, efficient irrigation begins with measuring and managing water so applications better match crop need, soil conditions, equipment capacity, labor, cost, and available sources.
Public water systems and communities also play a large role. Utilities can identify leaks, replace failing lines, maintain meters, track seasonal demand, and plan infrastructure with future water availability in mind. Communities can protect drinking-water sources and coordinate land-use and infrastructure decisions across groundwater and surface-water systems. Industries and other large facilities can examine cooling and production processes, recirculate water, and use reclaimed water where water quality and infrastructure allow.
Households contribute through direct water use—the water used for drinking, cooking, bathing, cleaning, and outdoor watering. Repairing leaks, choosing efficient fixtures and appliances, and matching landscape watering to plant needs and weather can reduce demand and household costs. These actions matter most as part of a wider effort that also addresses irrigation, utilities, industries, and public infrastructure.
Water use also occurs indirectly through the goods and services people buy. The water used to grow food, produce fiber, manufacture equipment, or make other products is sometimes called virtual water. A water-footprint total is only a starting point; its meaning depends on where and when the water was used, whether it came from rainfall, groundwater, or surface water, and whether the source was readily replenished or already under stress. Reducing food and material waste, extending the useful life of products, and seeking credible information about production practices can reduce some indirect demand without assuming that local purchasing automatically uses less water.
What to Remember
- Water availability depends on quantity, quality, location, timing, infrastructure, energy, access, and cost.
- Groundwater and surface water are connected. Changes in pumping, recharge, and streamflow can affect both parts of the water system.
- Withdrawals measure water taken from a source; consumptive use measures the portion unavailable for immediate reuse.
- Mississippi has substantial water resources, but conditions are uneven. Concentrated groundwater pumping has contributed to long-term decline across much of the Delta aquifer.
- Wet years can stabilize groundwater levels for a time without resolving a long-term imbalance between withdrawals and replenishment.
- A dependable water supply requires monitoring, efficient use, maintained infrastructure, source protection, and coordinated management of groundwater and surface water.
References
Dieter, C. A., Linsey, K. S., Caldwell, R. R., Harris, M. A., Ivahnenko, T. I., Lovelace, J. K., Maupin, M. A., & Barber, N. L. (2018). Estimated use of water in the United States county-level data for 2015 (Version 2.0) [Data set]. U.S. Geological Survey.
Medalie, L., Galanter, A. E., Martinez, A. J., Archer, A. A., Luukkonen, C. L., Harris, M. A., & Haynes, J. V. (2025). Water use across the conterminous United States, water years 2010–20 (U.S. Geological Survey Professional Paper 1894-D). U.S. Geological Survey.
Mississippi Department of Environmental Quality, U.S. Geological Survey, & Yazoo Mississippi Delta Joint Water Management District. (2023). Status and trends: Mississippi River Valley alluvial aquifer in the Mississippi Delta, spring 2023 [Handout].
U.S. Environmental Protection Agency. (n.d.). Private drinking water wells.
U.S. Geological Survey. (n.d.). How much water is there on Earth? Water Science School.
UN-Water. (n.d.). Water scarcity.
Publication 3011 (POD-08-26)
By Beth Baker, PhD, Associate Extension Professor and Assistant Director; Caleb Aldridge, former Research Associate; Austin Omer, former Extension Associate; and Mark Hill, Extension Associate, Wildlife, Fisheries, and Aquaculture.
The Mississippi State University Extension Service is working to ensure all web content is accessible to all users. If you need assistance accessing any of our content, please email the webteam or call 662-325-2262.
Download
P3011
Water: Availability and Use
641.61 KB
Departments
Authors
-
 Assoc Professor & Assistant Di
- Wildlife, Fisheries & Aquaculture
-
 Extension Associate I
- Wildlife, Fisheries & Aquaculture