ABSTRACT
- This newsletter examines the revenue impacts of tariffs and identifies the types of U.S. oyster imports. It shows the long-term annual U.S. oyster imports and the primary countries of origin of U.S. oyster imports. It also summarizes the calculated duties on oyster imports per year and their impact on import prices.
KEYWORDS
- Oyster imports, calculated duties, and major countries of origin.
SUGGESTED CITATION
- Posadas, Benedict C. 2025. Tariffs on U.S. Oyster Imports: Direct Revenues and Impacts on Prices. Vol. 15, No. 9. Mississippi State University Extension and Mississippi-Alabama Sea Grant Publication MASGP-25-058-9. August 14, 2025. Mississippi MarketMaker Newsletters.
METHODS
- The direct revenue impacts of U.S. oyster imports are the sum of the calculated duties imposed on imported oyster products.
- Annual data on U.S. oyster imports are compiled from the NOAA Fisheries website from January 1972 to April 2025. NOAA Fisheries.
- The calculated duties on oyster imports are summarized per year per country of origin.
- An econometric model is estimated to measure the impacts of calculated duties on the prices of imported oyster products.
- The econometric model of U.S. Oyster Import Price (dollars per pound) assumes that import prices could be explained by:
- Year,
- Calculated duty (%),
- Type of oyster product (1 or 0),
- Country of origin (1 or 0),
- Other variables
- The Ordinary Least Squares (OLS) model of U.S. Oyster Import Price consists of the following dependent variable:
- Deflated imputed average import price (dollars per pound).
- The OLS model of U.S. oyster import price is estimated by using the robust variance procedure of STATA-18.
- The variation inflation factor is calculated to detect the possible presence of multicollinearity.
- The marginal impacts are computed using the margins procedure.
TYPES U.S. OYSTER IMPORTS
- Oysters Canned
- Oysters Canned Smoked
- Oysters Dried/Salted/Brine Farmed
- Oysters Dried/Salted/Brine Wild
- Oysters Fresh/Frozen
- Oysters Frozen Farmed
- Oysters Frozen Wild
- Oysters Frozen/Dried/Salted/Brine Farmed
- Oysters Frozen/Dried/Salted/Brine Wild
- Oyster Juice Canned
- Oysters Live/Fresh Farmed
- Oysters Live/Fresh Wild
- Oysters Live/Fresh/Frozen/Dried/Salted/Brine
- Oysters Live/Fresh/Frozen/Dried/Salted/Brine Farmed
- Oysters Live/Fresh/Frozen/Dried/Salted/Brine Wild
- Oyster Products Prepared Dinners
- Oyster Seed
- Oysters, Oyster Juice Preparations For Soup
TOTAL U.S. OYSTER IMPORT VALUES AND VOLUMES
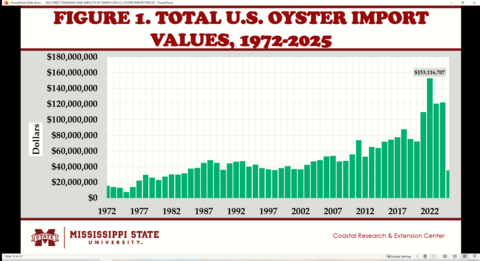
- Fig. 1 shows the total U.S. oyster import values since 1972.
- Nominal import values consistently rose from 1972, reaching their peak in 2022 at $153 million.
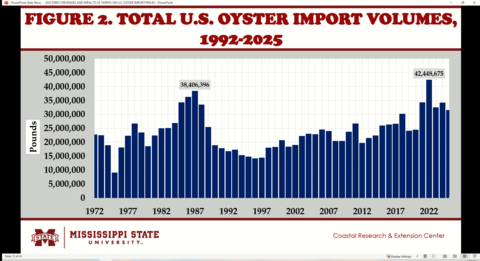
- Fig. 2 shows the total U.S. oyster import volumes since 1972.
- Import volumes rose from 1972, reaching their first peak in 1987 at 38 million pounds.
- Lower import volumes were observed, ranging from 15 to 30 million pounds per year from 1989 to 2020.
- A second peak was seen in 2022, reaching 42 million pounds.
COUNTRIES OF ORIGIN OF U.S. OYSTER IMPORT VALUES
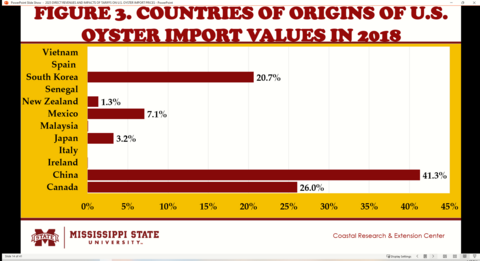
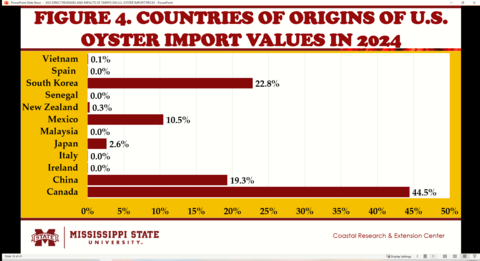
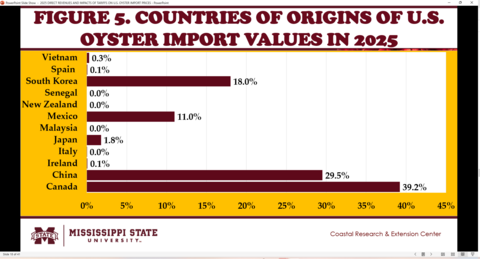
- Figures 3 to 5 show the major countries of origin of total U.S. oyster imports in 2018, 2024, and Jan-Apr 2025.
- China supplied 41.3% of U.S. oyster imports in 2018.
- The U.S.-China trade war since 2018 reduced China’s share to 19.3% in 2024 and 29.5% in 2025.
- Canada provided 26.0% of U.S. oyster imports in 2018, 44.5% in 2024, and 39.2% in 2025.
- South Korea sold 20.7% of U.S. oyster imports in 2018, 22.8% in 2024, and 18.0% in 2025.
- Mexico shipped 7.1% of U.S. oyster imports in 2018, 10.5% in 2024, and 11.0% in 2025.
- Japan provided 3.2% of U.S. oyster imports in 2018, 2.6% in 2024, and 1.8% in 2025.
- New Zealand’s share was 1.3% of U.S. oyster imports in 2018, 0.3% in 2024, and none in 2025.
- Limited oyster imports came from Ireland, Italy, Malaysia, Senegal, Spain, and Vietnam.
MAJOR PRODUCT FORMS OF U.S. OYSTER IMPORT VALUES
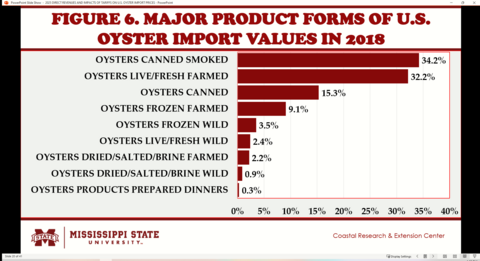
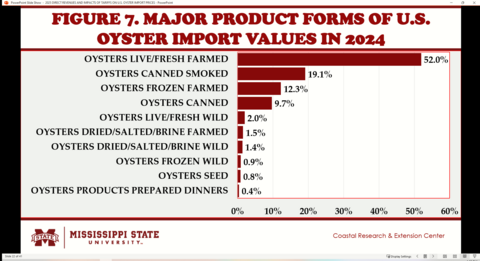
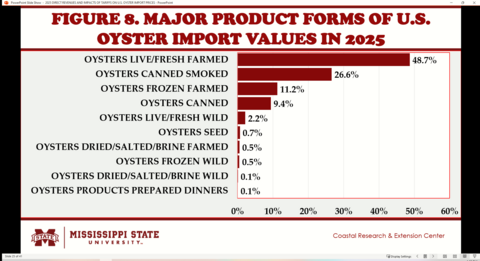
- Figures 6 to 8 show the primary product forms of total U.S. oyster imports in 2018, 2024, and Jan-Apr 2025.
- In 2018, 34.2% of total U.S. oyster imports consisted of canned smoked oysters. Canned smoked oysters ranked second in total U.S. oyster imports in 2024 at 19.1% and 26.6% in 2025.
- Canned oysters added 15.3% to total U.S. oyster imports in 2018, 9.7% in 2024, and 9.4% in 2025.
- In 2018, 32.2% of total U.S. oyster imports consisted of live or fresh farmed oysters. Live or fresh farmed oysters ranked first in total U.S. oyster imports in 2024 at 52.0% and 48.7% in 2025.
- Frozen farmed oysters added 9.1% to total U.S. oyster imports in 2018, 12.3% in 2024, and 11.2% in 2025.
- In 2018, 2.4% of total U.S. oyster imports consisted of live or fresh wild oysters. Live or fresh wild oysters added 2.0% to total U.S. oyster imports in 2024, and 2.2% in 2025.
- Frozen wild oysters added 3.5% to total U.S. oyster imports in 2018, 0.9% in 2024, and 0.5% in 2025.
CALCULATED DUTIES ON U.S. OYSTER IMPORTS
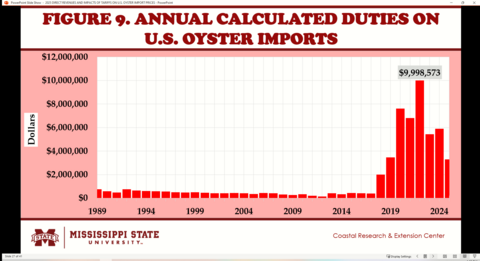
- Fig. 9 shows the calculated duties on the total U.S. oyster imports since 1989.
- Significant amounts of duties were collected from U.S. oyster imports when the U.S.-China trade war started in July 2018.
- Total calculated duties reached their peak in 2022 at $9.99 million.
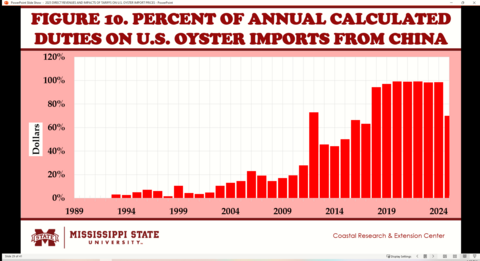
- Fig. 10 shows the percentage of annual calculated duties on the total U.S. oyster imports imposed on China since 1989.
- Since July 2018, nearly all U.S. oyster import duties have targeted China.
IMPUTED AVERAGE PRICES OF U.S. OYSTER IMPORTS
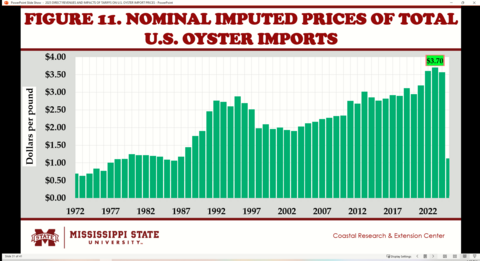
- Fig. 11 shows the nominal imputed prices of U.S. oyster imports since 1972.
- Since 1972, the nominal import price continued to rise, reaching its first peak at over $2.50 per pound in the 1990s.
- From 1998, the imputed price rose, reaching its second peak at over $3.70 per pound in 2023.
IMPACTS OF CALCULATED DUTIES ON IMPUTED AVERAGE PRICES OF U.S. OYSTER IMPORTS FROM CHINA
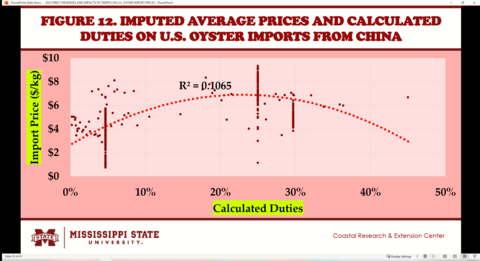
- Fig. 12 shows the scatter diagram between imputed prices and calculated duties on U.S. oyster imports from China since 1989.
- The graph indicates that nominal imputed prices rose at lower but fell at higher calculated duties on U.S. oyster imports from China since 1989.
- These results indicate that the tariff burdens on U.S. oyster imports are partially passed on to U.S. importers at lower tariff rates but are absorbed mainly by Chinese exporters at higher tariff rates.
IMPACTS OF CALCULATED DUTIES ON IMPUTED AVERAGE PRICES OF TOTAL U.S. OYSTER IMPORTS
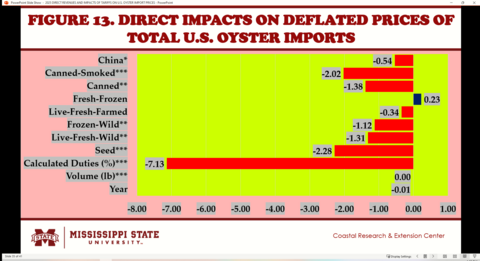
- Fig. 13 shows the results of the econometric model of deflated imputed prices of U.S. oyster imports.
- Deflated import prices of U.S. oyster imports did not fall significantly over time.
- Deflated import prices of U.S. oyster imports significantly declined at higher volumes of oyster imports.
- Deflated import prices of U.S. oyster imports significantly declined at higher calculated duties.
- Deflated import prices of U.S. oyster imports are lower for canned, frozen-wild, live-fresh-wild, and seed oysters as compared to frozen-farmed oysters.
- Deflated import prices of fresh-frozen and live-fresh farmed U.S. oyster imports are not significantly different from frozen-farmed oysters.
- Deflated import prices of U.S. oyster imports are lower for imports from China.
SUMMARY, LIMITATIONS, AND IMPLICATIONS
- China supplied 41.3% of U.S. oyster imports in 2018. The U.S.-China trade war, which began in 2018, reduced China’s share to 19.3% in 2024 and 29.5% in 2025. Chinese oyster imports mainly consisted of canned oyster products.
- Canada provided 26.0% of U.S. oyster imports in 2018, 44.5% in 2024, and 39.2% in 2025.
- South Korea sold 20.7% of U.S. oyster imports in 2018, 22.8% in 2024, and 18.0% in 2025.
- Mexico shipped 7.1% of U.S. oyster imports in 2018, 10.5% in 2024, and 11.0% in 2025.
- In 2018, 34.2% of total U.S. oyster imports consisted of canned smoked oysters. Canned smoked oysters ranked second in total U.S. oyster imports in 2024 at 19.1% and 26.6% in 2025.
- Canned oysters added 15.3% to total U.S. oyster imports in 2018, 9.7% in 2024, and 9.4% in 2025.
- In 2018, 32.2% of total U.S. oyster imports consisted of live or fresh farmed oysters. Live or fresh farmed oysters ranked first in total U.S. oyster imports in 2024 at 52.0% and 48.7% in 2025.
- Frozen farmed oysters added 9.1% to total U.S. oyster imports in 2018, 12.3% in 2024, and 11.2% in 2025.
- In 2018, 2.4% of total U.S. oyster imports consisted of live or fresh wild oysters. Live or fresh wild oysters added 2.0% to total U.S. oyster imports in 2024, and 2.2% in 2025.
- Frozen wild oysters added 3.5% to total U.S. oyster imports in 2018, 0.9% in 2024, and 0.5% in 2025.
- In 2024, 0.8% of total U.S. oyster imports consisted of oyster seed. Oyster seed added 0.7% to total U.S. oyster imports in 2025.
- Deflated import prices of U.S. oyster imports did not fall significantly over time.
- Deflated import prices of U.S. oyster imports significantly declined at higher volumes of oyster imports.
- Deflated import prices of U.S. oyster imports significantly declined at higher calculated duties.
- Deflated import prices of U.S. oyster imports are lower for canned, frozen-wild, live-fresh-wild, and seed oysters as compared to frozen-farmed oysters.
- Deflated import prices of fresh-frozen and live-fresh farmed U.S. oyster imports are not significantly different from frozen-farmed oysters.
- Deflated import prices of U.S. oyster imports are lower for imports from China.
ACKNOWLEDGEMENT
- This newsletter is a contribution of the Mississippi Agricultural and Forestry Experiment Station and the Mississippi State University Extension Service. This material is based upon work supported in part by the National Institute of Food and Agriculture, U.S. Department of Agriculture, Hatch project under accession number 100004. Any opinions, findings, conclusions, or recommendations expressed in this publication are those of the author. They should not be construed to represent any official USDA or U.S. Government determination or policy.
- This work was supported in part by the Mississippi-Alabama Sea Grant Consortium, National Oceanic and Atmospheric Administration, U.S. Department of Commerce, and the states of Alabama and Mississippi—federal grant number NA24OARX417C0155-T1-01. The statements, findings, conclusions, and recommendations are those of the authors and do not necessarily reflect the views of any of these funders.
ADDITIONAL MATERIAL
- Posadas, Benedict C. 2025. Tariffs on U.S. Oyster Imports: Direct Revenues and Impacts on Prices. Informational virtual presentation. Horticulture and Marine Economics Outreach, Vol. 2025, No. 19. Mississippi State University, Coastal Research and Extension Center, Biloxi, MS. YouTube Video.
Download

Vol. 15, No. 9 / Tariffs on U.S. Oyster Imports: Direct Revenues and Impacts on Prices
2.76 MB
Filed Under
Authors
-
 Extension/Research Professor
- CREC-Coastal Research & Ext Center