ABSTRACT
- Data reported by NOAA Fisheries showed that the U.S. has imported mussel products since 1989.
- This presentation shows the long-term annual U.S. mussel imports since 1989. It identifies the recent major countries of origin and types of U.S. mussel imports.
- Calculated duties on mussel imports started in 2018. It examines the annually calculated duties, revenue impacts of tariffs, and their impacts on the import prices of U.S. mussel imports.
KEYWORDS
- Mussel imports, calculated duties, and major countries of origin.
SUGGESTED CITATION
Posadas, Benedict C. 2025. Tariffs on U.S. Mussel Imports: Direct Revenues and Price Impacts. Vol. 15, No. 11. Mississippi State University Extension and Mississippi-Alabama Sea Grant Publication MASGP-25-058-11. November 7, 2025. https://extension.msstate.edu/newsletters/mississippi-marketmaker.
U.S. PER CAPITA MUSSEL CONSUMPTION
- As of 2018, U.S. per capita mussel consumption was an estimated 0.15 live pounds or 68.03 grams.
- This number was likely lower during the pandemic but was expected to recover with population growth.
- There are many dishes involving mussels all over the world; however, the four countries of Spain, Denmark, Belgium, and France have a per capita consumption of 3.08 kilograms or 6.61 pounds per year.
- Compared to the rest of Europe, the average consumption is 200 grams or 0.44 pounds per year.
- Source: AI Overview.

Blue Mussel. Mytilus edulis.
Length - 2 to 4 inches at maturity; can grow up to 8 inches.
Region - Alaska, New England/Mid-Atlantic, Southeast, West Coast.
Source: https://www.fisheries.noaa.gov/species/blue-mussel.
METHODS
- The direct revenue impacts of U.S. mussel imports are the sum of the calculated duties imposed on imported mussel products.
- Annual data on U.S. mussel imports are compiled from the NOAA Fisheries website from January 1989 to July 2025.
- The annual calculated duties on mussel imports are compiled per major type of mussel product and country of origin.
- An econometric model is estimated to measure the impacts of calculated duties on deflated imputed prices of U.S. mussel imports.
- Source of raw data: https://www.fisheries.noaa.gov/foss.
- The econometric model of U.S. MUSSEL IMPORT PRICE ($/lb) assumes that the deflated imputed average import price could be explained by:
- Year,
- Calculated duty (%),
- Country of origin (46 countries),
- Product type (37 products),
- Quantity of imports,
- Other variables.
- The Ordinary Least Squares (OLS) model of U.S. MUSSEL IMPORT PRICE consists of the following dependent variable:
- Deflated imputed average import price ($/lb).
- The OLS model of U.S. MUSSEL IMPORT PRICE is estimated by using the robust variance procedure of STATA-19.
- The variation inflation factor is calculated to detect the possible presence of multicollinearity.
The marginal impacts are computed using the margins procedure.
TOTAL U.S. MUSSEL IMPORT VALUES
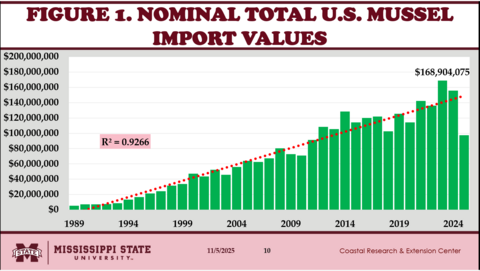
- The U.S. mussel import values generally rose from 1989, reaching their peak in 2023 at $168.90 million (Fig. 1).
- U.S. commercial mussel landings peaked in 2016 at $13.89 million.
- U.S. commercial mussel aquaculture production in 2023 reached $22.61 million.
- Drops in import values were observed during the recession and the COVID-19 years.
- The total import values from January to July 2025 reached $97.47 million.
- The U.S. commercial mussel landings peaked in 2016 at $13.89 million.
- The U.S. commercial mussel aquaculture production in 2023 reached $22.61 million.
- The U.S. mussel market is heavily import-dependent, with domestic supply covering less than 25% of import value in 2023.
- Growth in aquaculture is promising, but it is insufficient to offset declining wild harvests or rising import demand.
COUNTRIES OF ORIGIN OF U.S. MUSSEL IMPORT VALUES
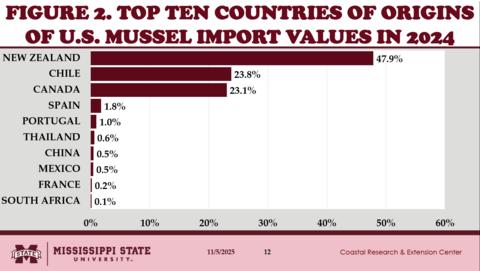
- Figure 2 shows the major countries of origin of total U.S. mussel imports in 2024.
- New Zealand supplied 47.9% of U.S. mussel import values.
- Chile provided 23.8% of U.S. mussel import values.
- Canada sold 23.1% of U.S. mussel import values.
- Some mussels were imported from these countries:
- Spain, Portugal, Thailand, China, Mexico, France, and South Africa.
MAJOR TYPES OF PRODUCTS OF U.S. MUSSEL IMPORT VALUES
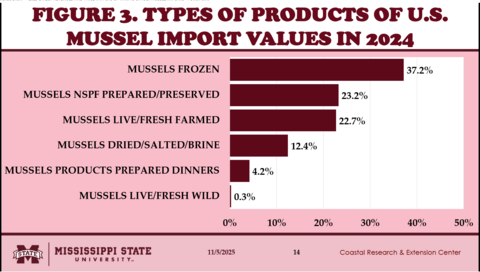
- Frozen mussels accounted for 37.2% of U.S. mussel import values in 2024 (Fig. 3).
- New Zealand supplied 94.2% of frozen U.S. mussel import values.
- Chile sold 4.6% of frozen U.S. mussel import values.
- South Africa added 0.4% of frozen U.S. mussel import values.
- Mexico accounted for 0.4% of frozen U.S. mussel import values.
- Greece sold 0.3% of frozen U.S. mussel import values.
- Live/Fresh farmed mussels added 22.7% of U.S. mussel import values in 2024.
- Canada supplied 89.1% of U.S. live/fresh mussel import values.
- New Zealand sold 9.2% of U.S. live/fresh mussel import values.
- Mexico added 1.4% to U.S. live/fresh mussel import values.
- Italy accounted for 0.3% U.S. live/fresh mussel import values.
- Prepared/Preserved NSPF mussels increased U.S. mussel import values in 2024 by 23.2%.
- Dried/Salted/Brine mussels added 12.4% of U.S. mussel import values in 2024.
- Prepared mussel products dinners accounted for 4.2% of U.S. mussel import values in 2024.
Live/Fresh wild mussels increased U.S. mussel import values in 2024 by 0.3%.
CALCULATED DUTIES ON U.S. MUSSEL IMPORTS
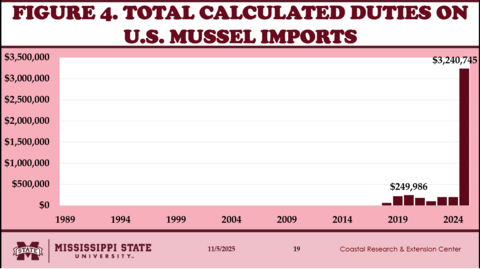
- In 2018, the total calculated duties reached $60,918, rose to $203,421 in 2024, and $3.24 million during the first half of 2025 (Fig. 4).
- In 2024, China was subjected to 100% of all calculated duties on U.S. mussel imports, amounting to $203,421.
Initially, the average calculated duties were 0.06% in 2018, rose to 0.20% in 2020, fell to 0.13% in 2021 and 2024, and surged to 3.32% during the first half of 2025.
CALCULATED DUTIES ON U.S. MUSSEL IMPORTS FROM PRIMARY COUNTRIES OF ORIGIN
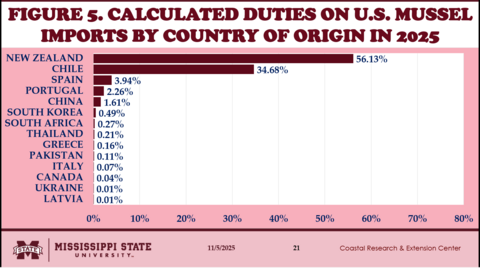
- Figure 5 shows the total calculated duties from major countries of origin in 2025.
- Mussel imports from New Zealand accounted imposed 53.13% of the total calculated duties.
- Mussel imports from Chile were subjected to an average of 34.68% total calculated duties.
About 3.94% of the total calculated duties were levied on mussel imports from Spain.
CALCULATED DUTIES ON U.S. MUSSEL IMPORTS BY PRODUCT TYPE
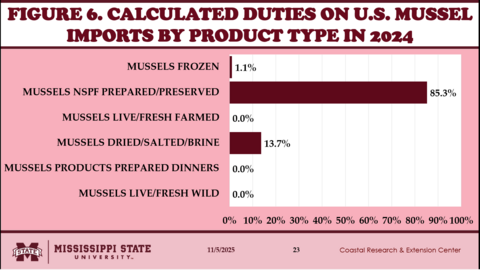
- Figure 6 shows the total calculated duties by major products of U.S. mussel import values in 2024.
- Prepared/Preserved NSPF mussel accounted for 85.3% of the total calculated duties on U.S. mussel import values.
- Dried/Salted/Brine mussel added 13.7% of the total calculated duties on U.S. mussel import values.
- Frozen mussels accounted for 1.1% of the total calculated duties on U.S. mussel import values.
IMPUTED PRICES OF U.S. MUSSEL IMPORTS
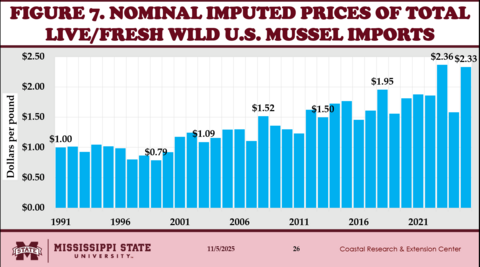
Figure 7 shows the nominal imputed average prices of live/fresh wild U.S. mussel imports since 1991.
- From 1991 to 2000, the nominal import prices of live/fresh wild U.S. mussel imports fluctuated between $0.79 and $1.00 per pound.
- The nominal import prices of live/fresh wild U.S. mussel imports from 2001 to 2022 varied from $1.09 to $1.95 per pound.
- Nominal import prices of live/fresh wild U.S. mussel imports peak in 2023 at $2.36 per pound but decline to $2.33 per pound in 2025.
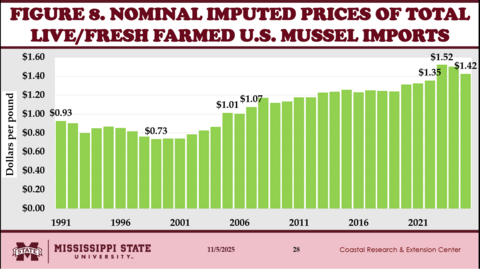
- Figure 8 shows the nominal imputed average prices of live/fresh farmed U.S. mussel imports since 1991.
- From 1991 to 2006, the nominal import prices of live/fresh wild U.S. mussel imports fluctuated between $0.73 and $1.01 per pound.
- The nominal import prices of live/fresh wild U.S. mussel imports from 2007 to 2022 varied from $1.07 to $1.35 per pound.
- Nominal import prices of live/fresh wild U.S. mussel imports peak in 2023 at $1.52 per pound but fell to $1.42 per pound in 2025.
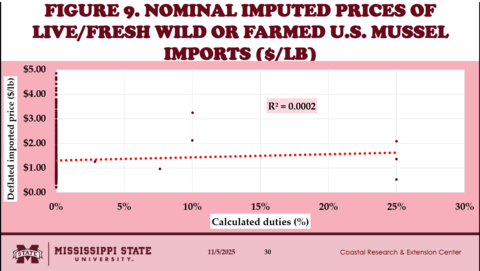
RESULTS OF THE ECONOMETRIC MODEL ON LIVE OR FRESH, WILD OR FARMED U.S. MUSSEL IMPORTS
- Higher calculated duties led to no significant differences on deflated average imputed prices of live/fresh, live/fresh wild, and live/fresh farmed U.S. mussel imports.
- Calculated duties had no significant effects on the deflated average imputed prices of live/fresh, live/fresh wild, and live/fresh farmed U.S. mussel imports.
- Higher quantities of U.S. imports of live/fresh, live/fresh wild, and live/fresh farmed mussels forced the deflated average imputed prices to decline significantly.
Live/Fresh mussel imports from New Zealand and South Korea had significantly higher deflated average imputed prices.
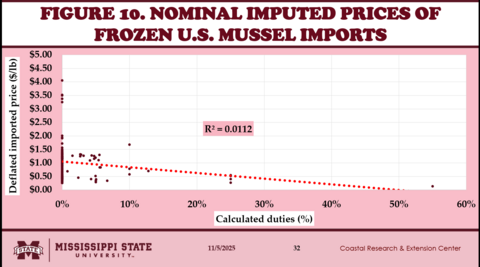
RESULTS OF THE ECONOMETRIC MODEL ON FROZEN U.S. MUSSEL IMPORTS
- Higher calculated duties led to significantly lower deflated average imputed prices of frozen U.S. mussel imports.
- Higher quantities of U.S. imports of frozen farmed mussels did not have any significant effects on the deflated average imputed prices.
- Significant differences were observed in deflated average imputed prices of frozen mussel imports from many countries of origin.
SUMMARY, LIMITATIONS, AND IMPLICATIONS
- Import values generally rose from 1989, reaching their peak in 2023 at $168.90 million. Drops in import values were observed during the recession and the COVID-19 pandemic.
- The U.S. commercial mussel landings peaked in 2016 at $13.89 million. The U.S. commercial mussel aquaculture production in 2023 reached $22.61 million.
- The U.S. mussel market is heavily import-dependent, with domestic supply covering less than 25% of import value in 2023. Growth in aquaculture is promising, but it is insufficient to offset declining wild harvests or rising import demand.
- The total import values from January to July 2025 reached $97.47 million.
- New Zealand supplied 47.9% of U.S. mussel import values in 2024. Chile provided 23.8%. Canada sold 23.1%.
- Frozen mussels accounted for 37.2% of U.S. mussel import values in 2024. New Zealand supplied 94.2% of frozen U.S. mussel import values.
- Live/Fresh farmed mussels added 22.7% of U.S. mussel import values in 2024. Canada supplied 89.1% of U.S. live/fresh mussel import values.
- Prepared/Preserved NSPF mussels increased U.S. mussel import values in 2024 by 23.2%. Dried/Salted/Brine mussels added 12.4%. Prepared mussel product dinners accounted for 4.2%.
- In 2018, the total calculated duties reached $60,918, rose to $203,421 in 2024, and $3.24 million during the first half of 2025.
- Initially, the average calculated duties were 0.06% in 2018, rose to 0.20% in 2020, fell to 0.13% in 2021 and 2024, and surged to 3.32% during the first half of 2025.
- Mussel imports from New Zealand accounted imposed 53.13% of the total calculated duties in 2025. Mussel imports from Chile were subjected to an average of 34.68% total calculated duties.
- Prepared/Preserved NSPF mussel accounted for 85.3% of the total calculated duties on U.S. mussel import values.
- Dried/Salted/Brine mussel added 13.7% of the total calculated duties on U.S. mussel import values.
- Frozen mussels accounted for 1.1% of the total calculated duties on U.S. mussel import values.
- From 1991 to 2000, the nominal import prices of live/fresh wild U.S. mussel imports fluctuated between $0.79 and $1.00 per pound.
- The nominal import prices of live/fresh wild U.S. mussel imports from 2001 to 2022 varied from $1.09 to $1.95 per pound.
- Nominal import prices of live/fresh wild U.S. mussel imports peak in 2023 at $2.36 per pound but decline to $2.33 per pound in 2025.
- Higher quantities of U.S. imports of live/fresh, live/fresh wild, and live/fresh farmed mussels forced the deflated average imputed prices to decline significantly.
- Live/Fresh mussel imports from New Zealand and South Korea had significantly higher deflated average imputed prices.
- Significant differences were observed in deflated average imputed prices of frozen mussel imports from many countries of origin.
ACKNOWLEDGEMENTS
- This newsletter is a contribution of the Mississippi Agricultural and Forestry Experiment Station and the Mississippi State University Extension Service. This material is based upon work supported in part by the National Institute of Food and Agriculture, U.S. Department of Agriculture, Hatch project under accession number 100004. Any opinions, findings, conclusions, or recommendations expressed in this publication are those of the author. They should not be construed to represent any official USDA or U.S. Government determination or policy.
- This work was supported in part by the Mississippi-Alabama Sea Grant Consortium, National Oceanic and Atmospheric Administration, U.S. Department of Commerce, and the states of Alabama and Mississippi—federal grant number NA24OARX417C0155-T1-01. The statements, findings, conclusions, and recommendations are those of the authors and do not necessarily reflect the views of any of these funders.
ADDITIONAL MATERIALS
- Posadas, Benedict C. 2025. Tariffs on U.S. Mussel Imports: Direct Revenues and Price Impacts. Informational virtual presentation. Horticulture and Marine Economics Outreach, Vol. 2025, No. 36. Mississippi State University, Coastal Research and Extension Center, Biloxi, MS. https://youtu.be/2YpVSkkAG9M.
- Posadas, Benedict C. U.S. Mussel Aquaculture Production, Farmgate Values, and Number of Farms. Horticulture and Marine Economics Outreach. Informational Virtual Presentation HME 2025-32. Mississippi State University, Coastal Research and Extension Center, Biloxi, MS. https://youtu.be/cuk-7qMoDCc.
Download

Vol. 15, No. 11 / Tariffs on U.S. Mussel Imports: Direct Revenues and Price Impacts
1.92 MB