P3684
Mississippi Hay Market Analysis
Mississippi Hay Production
A reported 620,000 acres of hay were harvested in Mississippi during 2020. Nearly 1.5 million tons were produced on 11,565 farms, with a total value of $140 million. This translates to an average of 128 tons produced per farm, with an average yield of 2.38 tons per acre, and an average value of $94 per ton, or $12,032 in hay per farm.
Hay is an extremely important commodity that is primarily used to support the state’s 920,000 head of beef cattle. Mississippi’s environmental conditions allow for generous amounts of hay to be produced during the summer months and stored for winter feeding.
Unfortunately, forage crops used in hay production are typically warm-season perennial grasses, such as bahiagrass and bermudagrass, which are notorious for providing lower nutritive value when compared to cool-season grasses and legumes, such as annual ryegrass or alfalfa. Lower nutritive value results in the need for supplementation to meet the nutrient requirements for several classes of beef cattle, thus increasing feed costs and lowering profits. However, research has shown that increasing hay nutritive value reduces supplementation and feed costs, so there is a need for higher quality hay and markets that can make this hay available.
The current Mississippi hay market is predominantly word of mouth, with minimal advertising. Due to low profit margins in commercial hay production, producers are often reluctant to advertise heavily, and most sales occur when producers need to disperse extra inventory.
Several markets and outlets for hay sales have been developed over the years, but none have been as successful or more frequently used than the Mississippi Market Bulletin. Since its inception in 1928, the Market Bulletin has increased readership to more than 30,000 subscribers to its bi-monthly print and digital issues. Digital versions of the bulletin became available in 2009, and, since then, nearly 12,000 individual ads have been placed for hay alone.
Hay Advertisements
Researchers analyzed hay advertisements from September 2009 to December 2020 based on several characteristics within each listing. Advertisements were broken down by year, month, issue, hay crop, variety, bale shape, bale size, bale description, storage, price, and county.
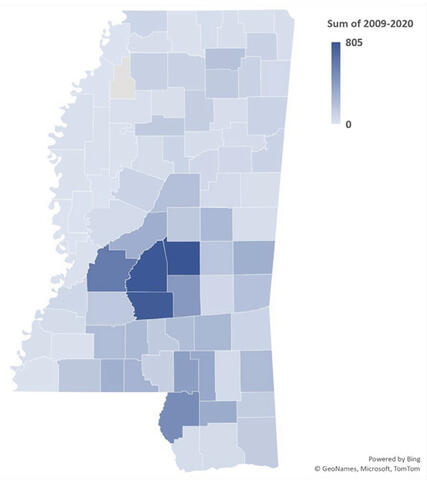
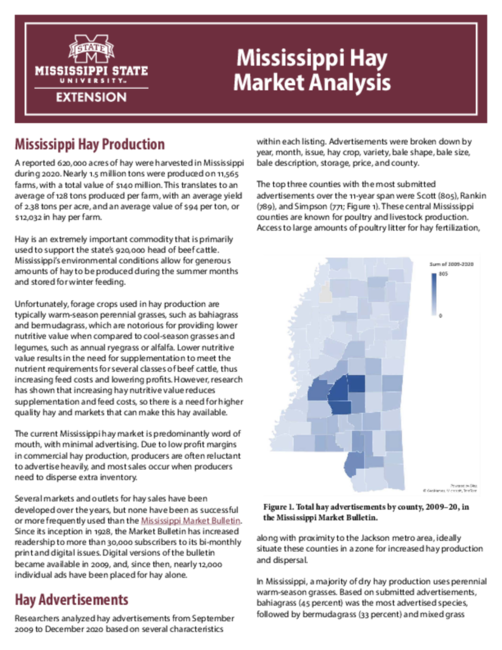
The top three counties with the most submitted advertisements over the 11-year span were Scott (805), Rankin (789), and Simpson (771; Figure 1). These central Mississippi counties are known for poultry and livestock production. Access to large amounts of poultry litter for hay fertilization, along with proximity to the Jackson metro area, ideally situate these counties in a zone for increased hay production and dispersal.
In Mississippi, a majority of dry hay production uses perennial warm-season grasses. Based on submitted advertisements, bahiagrass (45 percent) was the most advertised species, followed by bermudagrass (33 percent) and mixed grass (17 percent). The remaining species comprised less than 5 percent of the market (Table 1).
|
Species |
Percent of ads |
|
Bahiagrass |
45.89 |
|
Bermudagrass |
33.20 |
|
Mixed grass |
17.05 |
|
Ryegrass |
3.38 |
|
Clover |
0.14 |
|
Peanut |
0.14 |
|
Johnsongrass |
0.09 |
|
Crabgrass |
0.07 |
|
Alfalfa |
0.03 |
|
Oat |
0.01 |
|
Soybean |
0.01 |
When analyzed by variety within species, ‘Argentine’ bahiagrass was advertised the most (74 percent), followed by ‘Tifton-9’ bahiagrass (23 percent; Table 2). For bermudagrass, ‘Alicia’ had the greatest number of advertisements (56 percent), followed by ‘Sumrall 007’ (23 percent).
|
Variety |
Percent of ads |
|
Argentine |
73.93 |
|
Tifton 9 |
22.98 |
|
Pensacola |
2.23 |
|
Tif Quik |
0.86 |
Bermudagrass
|
Variety |
Percent of ads |
|
Alicia |
55.90 |
|
Sumrall 007 |
22.93 |
|
Tifton 44 |
7.71 |
|
Horse Heaven |
5.78 |
|
Coastal |
4.50 |
|
Dixie World Feeder |
2.81 |
|
Buffalo Man |
0.16 |
|
Callie |
0.08 |
|
Tifton 78 |
0.08 |
|
Cheyenne II |
0.04 |
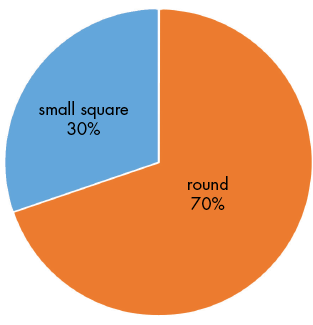
The livestock sector that produces or consumes the most hay is the cow-calf enterprise. Most of the hay used to supply this sector comes in the form of large round bales. However, horse and small ruminant hay markets, along with show animal markets, contribute significantly to the state’s small square bale hay production demand. Large round bales constitute approximately 70 percent of the advertisements, while small square bales are only around 30 percent. Large square bales are extremely rare, representing less than 0.02 percent of advertisements (Figure 2). Within round and square bale shapes, the consumer’s specific needs determine the best dimensions for storage, transport, and feeding. For round bales, the most widely advertised size is 4-by-5 (44 percent), followed by 5-by-5 (13 percent), and 5-by-6 (3 percent; Table 3).
|
Bale dimensions |
Percent of ads |
|
4x5 |
43.64 |
|
small square |
32.17 |
|
5x5 |
13.14 |
|
5x6 |
3.16 |
|
4x5.5 |
1.73 |
|
4x4 |
1.14 |
|
4x6 |
1.14 |
|
5x5.5 |
0.91 |
|
5x4 |
0.82 |
|
6x5 |
0.77 |
|
5.5x5 |
0.26 |
|
5.5x4 |
0.18 |
|
6x6 |
0.11 |
|
4x4.5 |
0.10 |
|
5.5x6 |
0.09 |
|
6x4 |
0.07 |
|
large square |
0.04 |
When placing advertisements, sellers should use descriptors that refer to the quality of the hay, including fertilization, weed presence, maturity at harvest, or the curing process (whether it was rained on during dry-down). Hay testing also can be used as a marketing advantage; this allows buyers to know the nutritive value of the hay and account for any nutritional deficits when feeding.
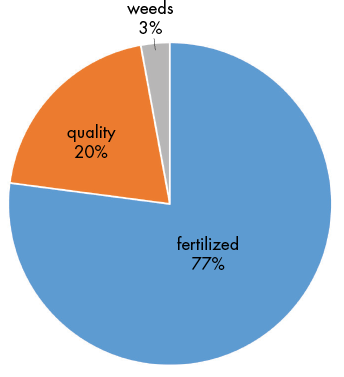
For this analysis, advertisements were broken down by category based on three of the most used descriptors: fertilized, weeds, and quality. “Fertilized” was used when any advertisement referred to the use of fertilizer or lime as it pertains to hay quality. This category comprised 77 percent of advertisements submitted (Figure 3). Advertisements that referred to herbicides, spraying, or weed-free hay were categorized as “weeds.” Only 3 percent of advertisements were in this category. The final category was “quality” and refers to descriptions directly related to qualitative characteristics, such as smell, color, intended livestock use (e.g.,“horse hay”), or actual hay quantitative values (e.g., crude protein or total digestible nutrients). This category comprised 20 percent of the advertisements submitted. For more information on how to submit a hay sample, visit https://www.mscl.msstate.edu/about/forms.
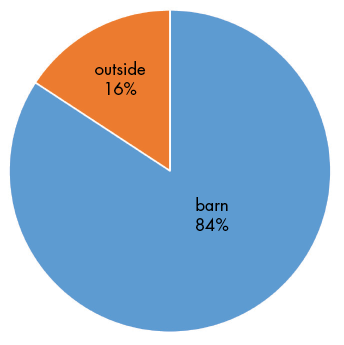
Hay storage has a significant impact on quality and preservation. With annual precipitation of 55–65 inches, it is highly recommended to store hay inside or covered to prevent bale deterioration and loss of nutrients. Proper hay storage is also a marketing advantage, allowing buyers to have a general understanding of the overall quality of the bales. However, storage is not necessarily a direct reflection of the nutritive value of the hay. Of the advertisements that mentioned storage, 84 percent were described as “barn stored” or “covered” (Figure 4). The remaining 16 percent were stored outside.
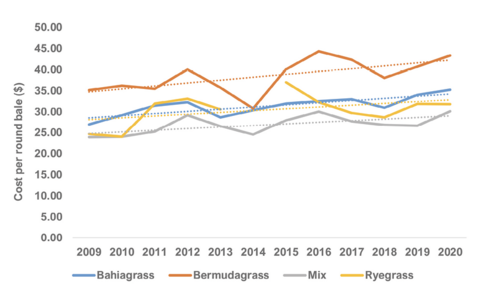
The final analysis conducted on advertisements from 2009 to 2020 was price. Nearly all advertisements stated the price per bale. For our analysis, advertisements were broken down by shape (round and small square) and species within shape (bahiagrass, bermudagrass, mix, and ryegrass).
Figure 5 shows round bale price comparisons. In general, all species increased in advertised price over the 11-year period. Bermudagrass round bales, on average, were listed at higher prices than the other species analyzed. Mean advertised prices increased $8.23 per bale for bermudagrass, $8.26 per bale for bahiagrass, $6.24 per bale for mixed grass, and $7.16 per bale for ryegrass.
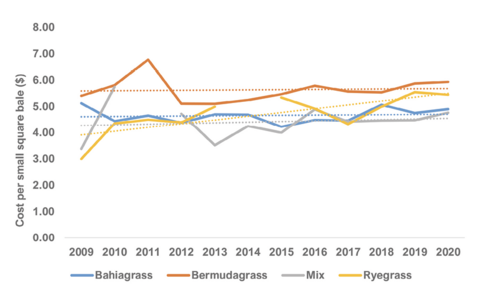
Small square bales, on the other hand, have not increased at the same rate as round bales during the same period (Figure 6). Mean bermudagrass advertised prices increased 53 cents per bale; bahiagrass decreased 22 cents per bale; mixed grass increased $1.39 per bale; and ryegrass increased $2.45 per bale.
For both round and small square advertisements, sellers acknowledge higher production costs and greater demand for bermudagrass, which coincides with higher asking prices.
Summary
The Mississippi Market Bulletin is an excellent resource for producers and consumers interested in selling or procuring hay. Understanding historical trends and best management practices for hay production can help hay producers develop marketing strategies that address buyer demand. As a buyer, finding high-quality hay that meets the nutritional demands of your livestock is essential in reducing feed and supplementation costs. Hay testing, whether by buyer or seller, is an excellent way to help determine the quality of the hay in question.
References
Mississippi State University Division of Agriculture, Forestry, and Veterinary Medicine. (2020). Ag fact book.
Publication 3684 (POD-08-24)
By Brett Rushing, PhD, Associate Extension/Research Professor, Coastal Plain Experiment Station.
The Mississippi State University Extension Service is working to ensure all web content is accessible to all users. If you need assistance accessing any of our content, please email the webteam or call 662-325-2262.
Download
P3684
Mississippi Hay Market Analysis
425 KB