
Fruit and Tree Nut Wholesale Markets: 2015–2021 Price Report
This publication informs agricultural producers, buyers, lenders, and other interested groups about wholesale market prices for fruits and tree nuts commonly grown in Mississippi and the southern United States. Awareness of average prices in the market can help agricultural producers develop crop planning budgets, forecast potential crop and farm returns, and make informed investment decisions during the crop planning process. Knowledge of publicly available market price information might also help suppliers and buyers negotiate fair market prices and purchasing contract terms by reducing any imbalance in parties’ access to price information.
Data
The prices summarized in this publication are terminal market prices obtained from the U.S. Department of Agriculture, Agricultural Marketing Service (AMS) Terminal Market Report. Reported prices are from products sold in selected terminal markets at major U.S. cities during the 2015–2021 period. This report focuses on fruits and tree nuts commonly grown in Mississippi and nearby states. While these prices do not specifically reflect local farm-gate fruit and tree nut prices in the state, they provide a baseline for wholesale market prices received by agricultural producers. Wholesale price descriptive statistics for the following fruits and tree nuts are included:
- Pecans
- Cantaloupes
- Peaches
- Watermelons
- Blueberries
Average Prices, 2015–2021
The following figures depict the average annual prices and the overall average prices during the 2015–2021 period. For each commodity, we also report the lowest and highest price observed across the selected terminal markets each year. Because the reported prices may combine various sizes, varieties, and quality grades, some commodities may have wide price ranges.
Data source for all figures and tables: USDA Agricultural Marketing Service Specialty Crops Terminal Market Report.
Pecans
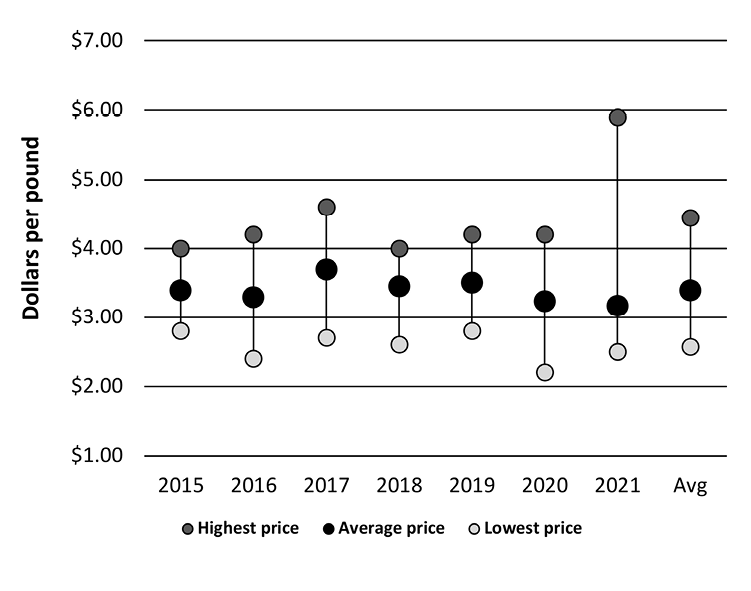
Figure 1 shows the per-pound average wholesale prices of improved pecan varieties sold in sacks or cartons weighing approximately 50 pounds. Estimates include pecans of various sizes and varieties. From 2015 to 2021, the overall average wholesale price of improved pecans was $3.39 per pound, with an average low of $2.57 and an average high of $4.44. The lowest per-pound wholesale price observed during this period was $2.20 in 2020, and the highest was $5.90 in 2021.
|
2015 |
2016 |
2017 |
2018 |
2019 |
2020 |
2021 |
7-year avg. |
|
|---|---|---|---|---|---|---|---|---|
|
Highest price |
4.00 |
4.20 |
4.60 |
4.00 |
4.20 |
4.20 |
5.90 |
4.44 |
|
Average price |
3.39 |
3.29 |
3.70 |
3.45 |
3.51 |
3.23 |
3.17 |
3.39 |
|
Lowest price |
2.80 |
2.40 |
2.70 |
2.60 |
2.80 |
2.20 |
2.50 |
2.57 |
Figure 2 reports the estimated per-pound average wholesale prices of native pecan varieties sold in sacks or cartons weighing approximately 50 pounds. The estimates include pecans of various sizes and varieties classified as native or “natural.” From 2015 to 2021, the overall average wholesale price of native pecans was $4.16 per pound, with an average low of $3.16 and an average high of $4.89. The lowest per-pound wholesale price observed during this period was $2.60 in 2017 and 2019, and the highest was $5.00 in 2016, 2017, and 2018.

|
2015 |
2016 |
2017 |
2018 |
2019 |
2020 |
2021 |
7-year avg. |
|
|---|---|---|---|---|---|---|---|---|
|
Highest price |
4.80 |
5.00 |
5.00 |
5.00 |
4.80 |
4.80 |
4.80 |
4.89 |
|
Average price |
4.04 |
4.10 |
4.28 |
4.12 |
4.11 |
4.24 |
4.25 |
4.16 |
|
Lowest price |
3.50 |
3.50 |
2.60 |
2.70 |
2.60 |
3.25 |
4.00 |
3.16 |
Cantaloupes
Figure 3 shows the per-pound average wholesale prices of cantaloupes sold in half cartons or crates weighing approximately 40 pounds. The estimates include cantaloupes of various sizes and varieties. From 2015 to 2021, the overall average wholesale price of cantaloupes was $0.44 per pound, with an average low of $0.26 and an average high of $0.71. The lowest per-pound wholesale price observed during this period was $0.10 in 2015, and the highest was $0.79 in 2018.

|
2015 |
2016 |
2017 |
2018 |
2019 |
2020 |
2021 |
7-year avg. |
|
|---|---|---|---|---|---|---|---|---|
|
Highest price |
0.76 |
0.58 |
0.65 |
0.79 |
0.76 |
0.69 |
0.78 |
0.71 |
|
Average price |
0.42 |
0.39 |
0.40 |
0.41 |
0.44 |
0.44 |
0.56 |
0.44 |
|
Lowest price |
0.10 |
0.30 |
0.28 |
0.27 |
0.25 |
0.29 |
0.33 |
0.26 |
Peaches
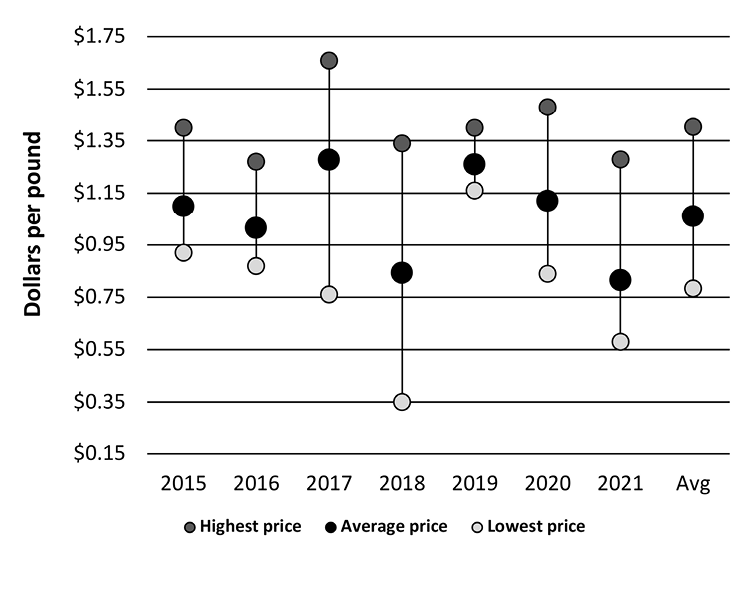
Figure 4 shows the per-pound average wholesale price of peaches sold in cartons containing approximately 25 pounds. The estimates include peaches of various sizes and white and yellow flesh varieties. From 2015 to 2021, the overall average wholesale price of peaches was $1.06 per pound, with an average low of $0.78 and an average high of $1.40. The lowest per-pound wholesale price observed during this period was $0.35 in 2018, and the highest was $1.66 in 2017.
|
2015 |
2016 |
2017 |
2018 |
2019 |
2020 |
2021 |
7-year avg. |
|
|---|---|---|---|---|---|---|---|---|
|
Highest price |
1.40 |
1.27 |
1.66 |
1.34 |
1.40 |
1.48 |
1.28 |
1.40 |
|
Average price |
1.10 |
1.02 |
1.28 |
0.84 |
1.26 |
1.12 |
0.81 |
1.06 |
|
Lowest price |
0.92 |
0.87 |
0.76 |
0.35 |
1.16 |
0.84 |
0.58 |
0.78 |
Watermelons
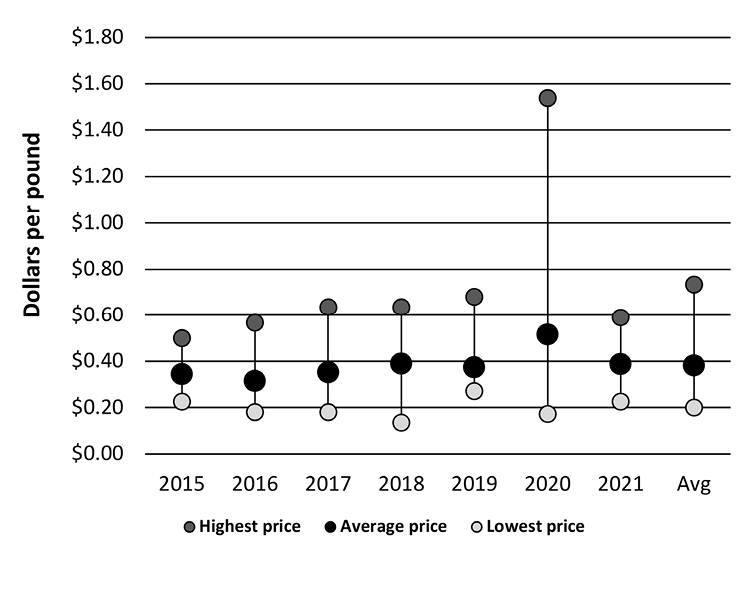
Figure 5 reports the estimated per-pound average wholesale price of watermelons sold in 24-inch bins. While the weight of a regular-sized watermelon varies, the estimates assume an average weight between 20 and 24 pounds and include red-flesh seeded and seedless varieties. From 2015 to 2021, the overall average wholesale price of watermelons was $0.38 per pound, with an average low of $0.20 and an average high of $0.74. The lowest per-pound wholesale price observed during this period was $0.14 in 2018, and the highest was $1.54 in 2020. While the average price increased by 40.5 percent in 2020 relative to the previous year, the highest price increased by 126.5 percent. This wide swing in high prices may be linked to supply chain disruptions that decreased the supply from Mexico and Florida but benefited Texas Rio Grande Valley producers through high market prices. 
|
2015 |
2016 |
2017 |
2018 |
2019 |
2020 |
2021 |
7-year avg. |
|
|---|---|---|---|---|---|---|---|---|
|
Highest price |
0.50 |
0.57 |
0.64 |
0.64 |
0.68 |
1.54 |
0.59 |
0.74 |
|
Average price |
0.34 |
0.32 |
0.35 |
0.39 |
0.37 |
0.52 |
0.39 |
0.38 |
|
Lowest price |
0.23 |
0.18 |
0.18 |
0.14 |
0.27 |
0.17 |
0.23 |
0.20 |
Blueberries
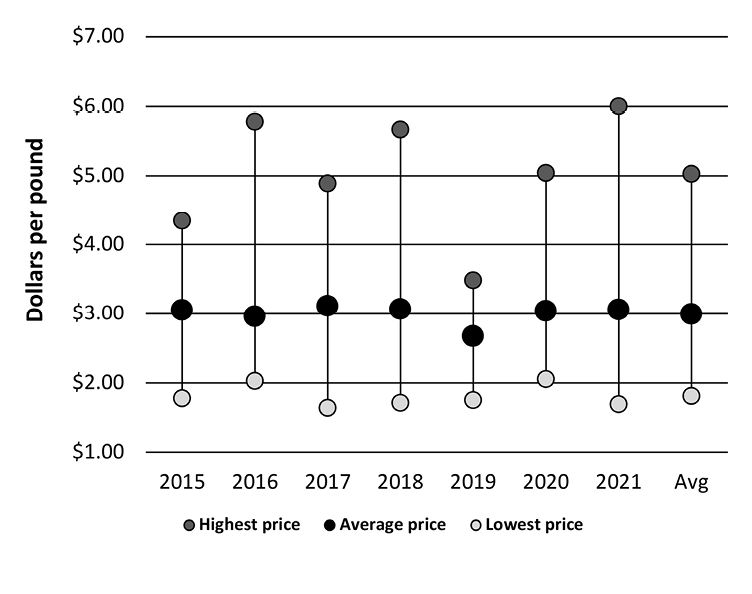
Mississippi is known for blueberry production. Figure 6 shows the annual average wholesale price per pound of blueberries sold in flats containing 12 pints. The estimates include blueberries of various sizes and varieties and assume a weight of approximately 9 pounds per 12-pint flat. From 2015 to 2021, the overall average wholesale price of blueberries was $2.99 per pound, with an average low of $1.81 and an average high of $5.03. The lowest per-pound wholesale price observed during this period was $1.64 in 2017, and the highest was $6.00 in 2021.
|
2015 |
2016 |
2017 |
2018 |
2019 |
2020 |
2021 |
7-year avg. |
|
|---|---|---|---|---|---|---|---|---|
|
Highest price |
4.35 |
5.78 |
4.89 |
5.67 |
3.49 |
5.04 |
6.00 |
5.03 |
|
Average price |
3.05 |
2.96 |
3.11 |
3.06 |
2.67 |
3.04 |
3.06 |
2.99 |
|
Lowest price |
1.78 |
2.03 |
1.64 |
1.71 |
1.75 |
2.06 |
1.69 |
1.81 |
Summary
This publication reports average annual wholesale prices for selected fruits and tree nuts during the 2015–2021 period. When using price information to inform business decisions, it is important to note that prices vary from year to year and within the same year. Prices may vary throughout the production season due to the harvest windows in the different production regions of the country, imports, and the volume of product in the market. In addition, year-to-year variability may take place due to different factors, including weather factors that may affect the acres under production each year.
Resources
U.S. Department of Agriculture, Agricultural Marketing Service Terminal Market Report. Available at: https://www.marketnews.usda.gov/mnp/fv-home
Funding
We gratefully acknowledge funding from the Foundation for Food and Agriculture Research via the Open Market Consortium for Specialty Crops.
Publication 3687 (POD-12-22)
By Alba J. Collart, PhD, Associate Extension Professor, and Elizabeth Canales, PhD, Associate Professor, Agricultural Economics.

The Mississippi State University Extension Service is working to ensure all web content is accessible to all users. If you need assistance accessing any of our content, please email the webteam or call 662-325-2262.


