P3887
Forest Growth and Yield
Before conducting any practice on a forested property, you need some way to quantify the condition of the forest. One way of quantifying a forest’s resources is by its growth and yield. What information helps you better understand a collection of trees and better communicate about that collection of trees to others? Variables such as these are important:
- Number of trees per acre.
- Average height and diameter.
- Basal area per acre (e.g., stocking and site occupation).
- Amount of volume or tons to determine what products could be harvested (and, hence, the value of that forest).
Growth and yield helps landowners determine the following:
- The value of their trees during a timber sale.
- Whether or not it is the right time to thin a forest.
- Where a forest exists in relation to some desired forested condition.
- How that forest will grow into the future.
- What practices can be used to manipulate the forest for optimal wildlife habitat and/or carbon production.
- And many other factors.
More specifically, growth and yield modeling is a means whereby mathematical models are used to predict forest attributes. There are generally two conditions where growth and yield modeling is applied: current time (or at time present) and future time (or projections).
Current Time (At Time Present)
Often during inventories of forests, characteristics of trees are predicted. This is done to make informed management decisions. It can determine the number of resources on a site and ultimately the financial value of those resources (e.g., timber appraisals). Prediction, rather than direct measurement, is used because it is too costly to measure a variable directly, it is logistically difficult, or direct sampling would result in destruction of the resource.
The only way to measure the volume of a tree is to cut the tree down, place it in a vat containing a known volume of water, and then measure the displacement of water. It is impossible to measure the volume (or weight) of a standing tree directly. To determine a tree’s volume, you measure other variables that are easily and cost-effectively measured, yet that are highly correlated (statistically) with the variable of interest.
Many forest growth and yield variables are represented by mathematical equations developed based on biological, logistical, and mechanical properties and considerations. Growth and yield equations that predict volume, weight, biomass, and carbon are extremely important to forest inventories and management, timber appraisals, and policymaking.
Future Time (Projections)
Forest management decisions are often based on what will potentially exist in the future given certain management activities. What do you need to do today, if anything, to achieve your future desired forest condition? With growth and yield projection modeling, you can often estimate with reasonable certainty future conditions of a forest based on past observations in both that forest and other, similar forests.
These projection models are systems of mathematical equations representing biological processes that allow us to predict something—for example, the amount of volume. Growth refers to change over some increment of time, and yield refers to what is observed at a particular point in time, or what can be harvested today or at some other point in time.
Using Projections
Take site index as an example. Site index is the average height of some number of the taller trees in a plantation. For instance, assume a loblolly pine plantation is an average site with a site index of 65 feet (base age 25), was planted at 500 seedlings per acre, and received intensive site preparation. You can find other sites with the same or similar characteristics that are older than this forest, and make observations within the other forests. You can use those observations to infer how your forest will grow.
Of course, these are predictions, not certainties. The comparison forests will have other variables that affect their development. For instance, using the example above, perhaps the genetic stock, elevation, or adjacent land use differs. These will create variation among forested stands despite similarity of other characteristics. Additionally, errors in statistical modeling are possible. Nonetheless, growth and yield models are often the best tools for making future projections.
To produce projection models, first determine what variables you want to focus on. Do you want to know the number of surviving trees, how tree height will develop, or simply total merchantable volume? This will determine what mathematical equations are used. Then, decide what variables you need to measure and/or predict to obtain projections of the variables of interest. This will help determine mathematical model/equation form.
Finally, often we need to decide how biology “behaves.” Modeling is often an art, and not an exact science. For example, one person may feel planting stock (container versus bareroot) has no impact on yields, and another may strongly believe it does. Thus, planting stock may be excluded from or included in a mathematical model simply due to personal preference.
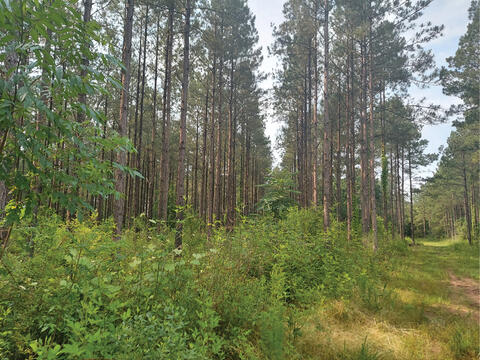
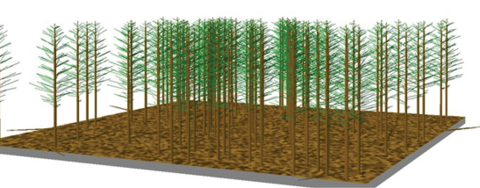
Figure 1 shows the predicted growth of a loblolly pine plantation over time. No thinning was conducted in this forest. A thinning is an operation that reduces the number of trees per acre to capture fiber production that would otherwise be lost to mortality, to maintain vigorous and healthy trees, to remove poorly formed trees, to provide earlier financial returns, to increase the growth and value of the remaining trees, and often to enhance wildlife habitat. See Figure 2 for an example of a thinned forest.
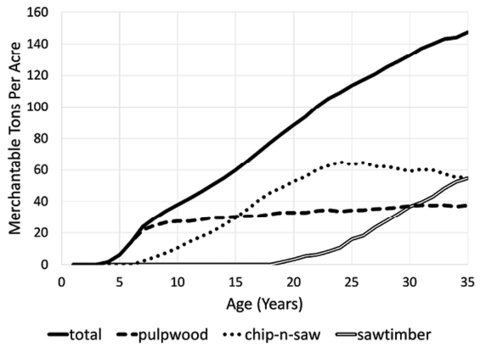
This figure shows how this unthinned plantation will likely grow in the future and provides information about management options and financial returns. Notice until around age 10, nearly all merchantable tons per acre is pulpwood. Pulpwood is lower value material commonly found on smaller trees, trees with smaller diameters, or poorly formed larger diameter trees. Woody fiber from these trees is used to make paper and oriented strand board (OSB), or as biomass to produce heat or biofuels.
Today, a common first thinning age for loblolly pine plantations is 13–15 years. Given the selected management regime in this example, how much of the more valuable chip-n-saw might you have at these ages? Chip-n-saw stumpage in Mississippi currently is worth around four times more than pine pulpwood stumpage (Measells, 2022). Although not as valuable as sawlogs, chip-n-saw logs are generally used to make 2-by-4 pieces of lumber, and the remainder is chipped and used as pulpwood. These trees generally have larger diameters than pulpwood-sized trees, and have sufficient form in the lower stems to allow for lumber production.
Based on these projections, trees won’t become large enough until around age 19 to start producing sawlogs. In Mississippi, pine sawlog stumpage currently is worth nearly twice that of chip-n-saw stumpage (Measells, 2022). Sawlogs are on larger diameter trees of sufficient form to allow a variety of lumber to be manufactured from them.
If you conduct a first thinning at age 15, how many tons per acre might you harvest if you conduct a third-row thinning, or a fourth-row thinning? Will that be enough tonnage to entice a logger to conduct the harvest? You can pair these yields with prices received per ton (commonly referred to as stumpage values), interest rates, and other variables to see the potential financial returns associated with this particular forest management regime.
In the real world, you can’t change the reforestation regime once it is established. However, with projections, you can alter planting density, thinning timing, and other management activities in seconds. You can use this information to better identify management options and activities, and the timing of those activities, that will best meet your objectives given current market conditions and costs associated with various operations.
Growth and yield models can be used, for example, to see how changes in merchantability standards impact yields per acre. Mills have different merchantability standards, depending on what product they are producing. Merchantability standards generally apply to lower stem diameters, upper stem diameters, and log lengths. Let’s say, for example, that advancements allow trees of smaller diameters to be used, or perhaps a new mill just opened near your plantation that takes smaller diameter trees. When pairing yield estimates with economic and market condition factors, you can see how changes in merchantability standards or stumpage values, for example, will impact financial returns.
Here are some other questions that growth and yield models can answer:
- A new biofuel facility just opened that will take smaller diameter trees. How should you change your forest management regime to take advantage of this opportunity?
- What happens to your financial returns if topwood, or upper-stem pulpwood on chip-n-saw and sawlog trees, is harvested because in your area that market exists?
- Should you thin your forest?
- When should you thin your forest to maximize timber production or financial returns?
- What will thinning do to your yields and the timing of those yields?
- Should you conduct only one thinning or two?
- What is the residual density that should be left following both thinnings that best meets your objectives as a landowner?
- Should the residual densities be the same or different between the two thinnings?
You can use growth and yield models to simulate thinnings and see how forests will respond to an increase in light, moisture, and nutrients, or see trade-offs in carbon sequestration between the overstory and understory vegetation. How will the understory vegetation production change and how will that impact wildlife habitat?
You can use these models to determine the best timing of thinnings, the best residual stand density, and the best thinning method for these variables, beyond just for timber production. There are a variety of methods for selecting what trees are to be removed during a thinning. Row thinnings are common. Another type is a thinning from below, or a low thinning, which is the removal of shorter trees (from lower crown classes) and trees that appear to be inferior. These trees are removed in part to provide more light, moisture, and nutrients to the taller, superior trees.
Figure 3 depicts the same forest as Figure 1 and shows the impacts of thinning at age 15 (first) and then again at age 22 (second) on yield throughout the rotation. Based on the site quality of 65 feet (base age 25) and a planting density of 500 seedlings per acre, if a row thinning is conducted for the first thinning at age 15, nearly an equal amount of the harvested trees will be within the pulpwood and chip-n-saw product classes. Why? Because a row of trees will contain both pulpwood and chip-n-saw trees.
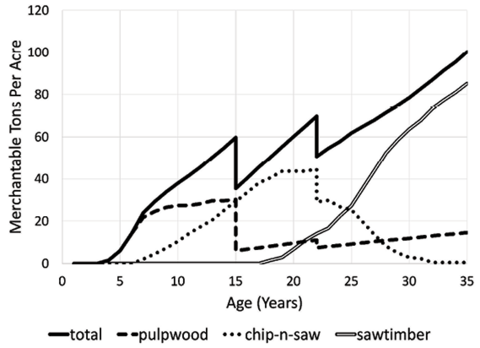
Conversely, with a low thinning back to a residual target basal area of 70 square feet per acre, most likely the first thinning will be entirely composed of trees within the less valuable pulpwood product class. Why? Because nearly half of the tons per acre is pulpwood, and there are enough pulpwood trees to comprise the entire thinning operation.
After the first thinning, given the selected merchantability specifications, most of the merchantable yield is in the chip-n-saw class until the second thinning at age 22. These projections can help you determine whether you should alter planting density given your objectives, budgets, and market conditions. Or you may learn that yields will not be enough to justify the more cost-intensive site preparation.
Notice that, due to the first thinning (from below at age 15), sawlog production occurs slightly earlier than if no thinning was conducted (as in Figure 1). Also notice that the second thinning (from below at age 22) is largely comprised of chip-n-saw product class material, and because of the first and second thinnings, future sawlog production occurs at a much faster rate than if the stand wasn’t thinned. At age 25, the amount of sawlog production in the thinned stand is 71 percent greater (27.2 tons) than if the forest was left unthinned (15.9 tons).
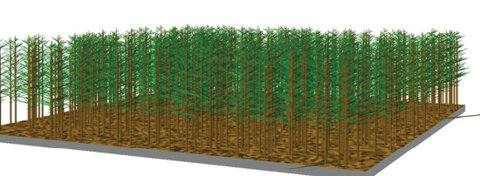
Many growth and yield applications allow you to visualize the response to treatments. In Figure 4, the top image represents a forest before a first thinning at age 14, and the bottom image shows the forest after the thinning (from below). These visualizations can help managers and landowners gain insight into a thinning’s impact on wildlife habitat, carbon sequestration, and erosion, among many other considerations.
Summary
Quantifying a forest’s resources is essential for determining how forests will respond to various treatments and helping foresters determine optimal management scenarios. Growth and yield is an essential part of determining the financial value of a forest, as well as its ecological value and even its value to society.
Predictions of growth and yield are important for planning purposes. Landowners may not need to fully understand all aspects of growth and yield, but their forester needs to use it regularly. For example, growth and yield is extremely important for showing that a landowner has a profit motive, which will allow them to be classified as a tax-related advantageous investor or business (rather than hobby or personal use) for income tax purposes. Growth and yield modeling is essential when determining a retroactive timber tax basis, which reduces the amount of income that a landowner owes tax on.
Growth and yield modeling is an essential part of planning for regional, national, and global timber supplies, and regional and global trade relations. It is also used to determine the feasibility of financial incentive programs, among many other uses.
References
Measells, M. (2022). Mississippi timber price report, 2nd quarter, 2022. Mississippi State University Extension. http://extension.msstate.edu/content/timber-prices-2013-present
Note: The information in Figures 1 and 3 is for discussion purposes only. Other management regimes and product specifications will give different results.
The information given here is for educational purposes only. References to commercial products, trade names, or suppliers are made with the understanding that no endorsement is implied and that no discrimination against other products or suppliers is intended.
Publication 3887 (POD-04-23)
By Curtis L. VanderSchaaf, PhD, Assistant Professor, Central Mississippi Research and Extension Center. The author thanks Anthony W. D’Amato, PhD, of the University of Vermont and Adam Polinko, PhD, of Mississippi State University for providing useful comments.
The Mississippi State University Extension Service is working to ensure all web content is accessible to all users. If you need assistance accessing any of our content, please email the webteam or call 662-325-2262.
Download

P3887
Forest Growth and Yield
3.8 MB
Authors
-
 Associate Professor
- Central MS Research & Ext Center